 FoxChild@Learn
5. Weather, climate and climate change
Curriculum status: Required core content.
This guide follows the England Key Stage 3 Geography programme of study. It builds from the weather you can observe today to the long-term patterns called climate, and then to evidence of climate change from past ice ages to the present. It also explains why physical conditions differ from place to place and how people depend on and change the climate system. Schools choose their own sequence and detailed place examples; the UK comparisons here are illustrative, not prescribed case studies.
Required knowledge
- Describe weather as the short-term condition of the atmosphere and climate as the longer-term pattern of weather, including averages and variability.
- Identify and interpret the main weather elements: temperature, precipitation, wind, cloud, humidity, air pressure and sunshine.
- Explain how latitude, altitude, distance from the sea, ocean circulation, prevailing winds, pressure systems and relief influence weather and climate.
- Use a climate graph, weather map, climate map and time series. Check the legend, axis, units, baseline, location, period and data source before drawing a conclusion.
- Describe evidence of past climate change, including ice-age records, and distinguish natural climate influences from the recent human enhancement of the greenhouse effect.
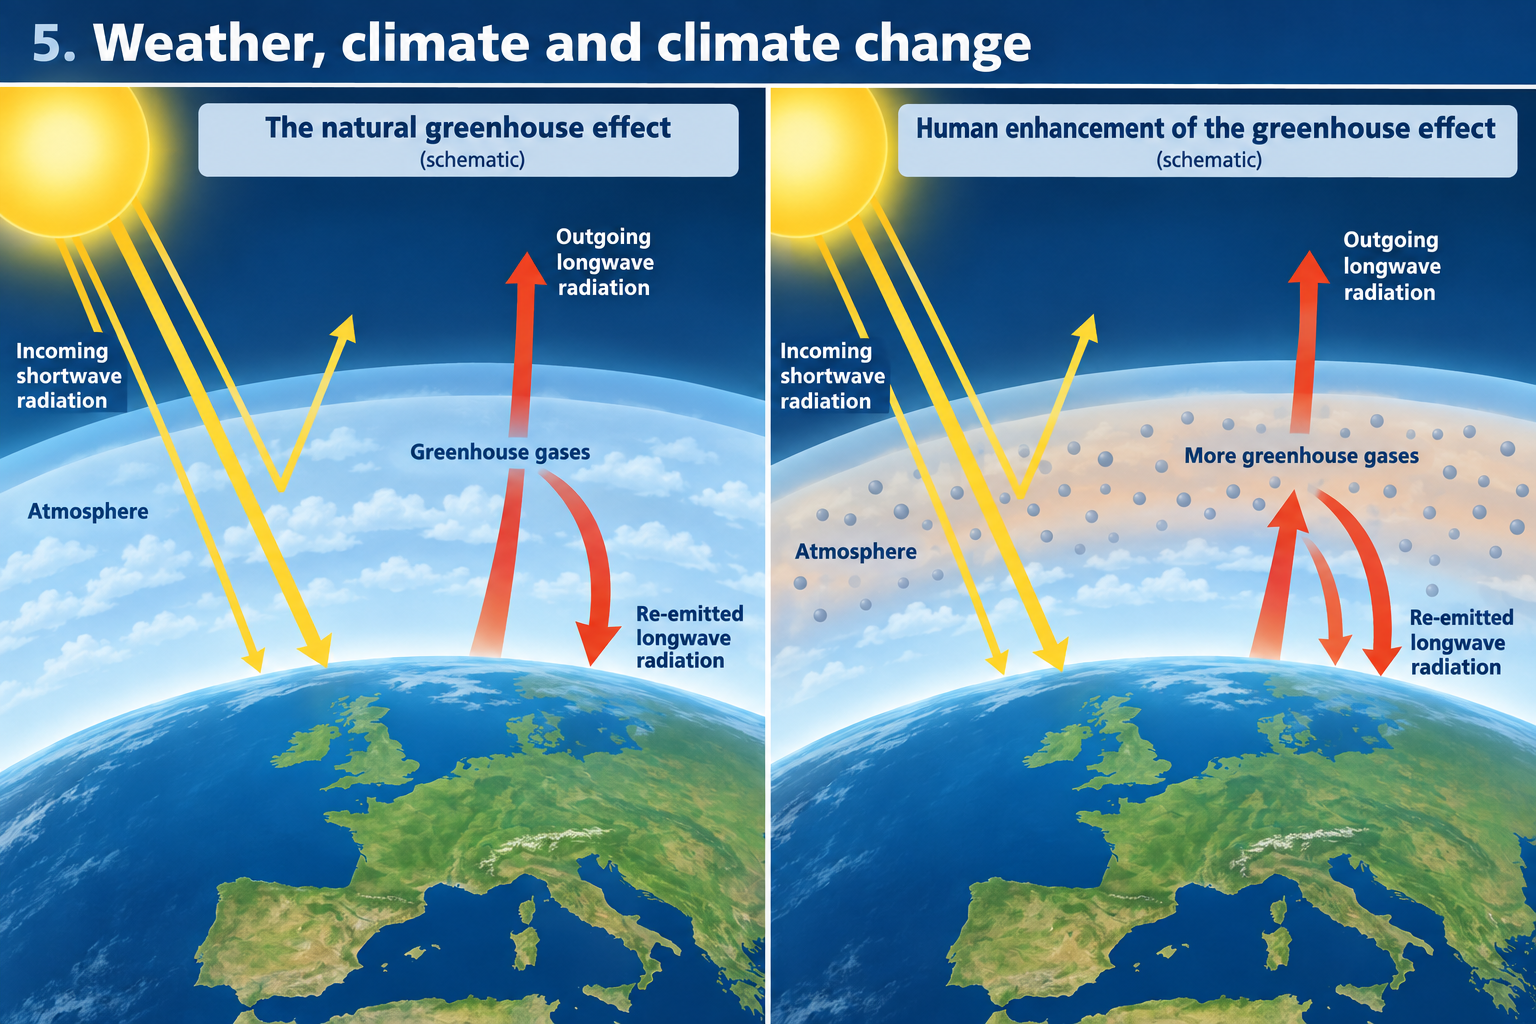
- Explain how greenhouse gases interact with incoming solar energy and outgoing infrared energy. Recognise that the natural greenhouse effect makes Earth habitable, while increased greenhouse-gas concentrations cause additional warming.
- Recognise that climate change affects different places, people and ecosystems unevenly and that climate can influence water, food, health, settlements and economic activity.
- Distinguish mitigation, which reduces greenhouse-gas emissions or increases removals, from adaptation, which reduces harm from current or expected impacts.
- Explain that climate is studied through multiple sources and timescales. One unusual season or a cold day cannot by itself confirm or disprove a long-term trend.
Key vocabulary
| Term | Meaning and use |
|---|---|
| weather | The condition of the atmosphere at a place and time, including temperature, cloud, wind, precipitation and pressure. |
| climate | The long-term pattern of weather in a place or region, including average conditions, variability and the likelihood of extremes. |
| climate normal | A standard multi-decade reference period used to summarise climate. The Met Office uses 30-year periods such as 1991–2020. |
| climate variability | Natural or human-influenced changes around a longer-term climate pattern, from seasons to decades. |
| climate change | A lasting change in climate patterns over years, decades or longer; it can be natural or human-caused, though recent global warming is primarily human-caused. |
| temperature | A measure of how hot or cold the air is. Weather stations record it in degrees Celsius in the UK. |
| precipitation | Water falling from the atmosphere, including rain, snow, sleet or hail. |
| humidity | The amount of water vapour in the air. Relative humidity compares the water vapour present with the maximum possible at that temperature. |
| air pressure | The force exerted by the weight of the air above a place. Differences in pressure help drive winds. |
| wind | Air moving from areas of higher pressure towards areas of lower pressure, modified by Earth’s rotation and friction. |
| insolation | Incoming solar radiation received at Earth’s surface or at the top of the atmosphere. |
| latitude | Angular distance north or south of the Equator; it influences the angle and duration of incoming sunlight. |
| altitude | Height above sea level. Temperature generally decreases with altitude in the lower atmosphere. |
| air mass | A large body of air with similar temperature and moisture characteristics over a wide area. |
| front | A boundary between air masses with different characteristics; lifting along a front can create cloud and precipitation. |
| depression | A region of relatively low pressure, often linked in the UK to cloud, wind and unsettled weather. |
| anticyclone | A region of relatively high pressure, often linked to more settled weather, though the actual conditions depend on season and air movement. |
| relief rainfall | Rainfall enhanced when moist air is forced to rise over higher land, cools and condenses. It is also called orographic rainfall. |
| rain shadow | A relatively drier area on the sheltered side of higher ground after air has lost moisture on the windward side. |
| global circulation | The large-scale movement of air that redistributes heat and moisture between the Equator and the poles. |
| greenhouse gas | A gas that absorbs and emits infrared radiation, affecting the energy balance of the atmosphere. Examples include carbon dioxide, methane and nitrous oxide. |
| greenhouse effect | Natural warming caused as greenhouse gases absorb and re-emit some outgoing infrared energy. |
| enhanced greenhouse effect | Extra warming caused by increased greenhouse-gas concentrations, mainly from human activities. |
| carbon dioxide (CO₂) | A greenhouse gas released by burning fossil fuels, land-use change and other processes; plants and oceans also absorb some carbon dioxide. |
| methane (CH₄) | A greenhouse gas released from sources including livestock, waste, wetlands and fossil-fuel systems. |
| nitrous oxide (N₂O) | A greenhouse gas associated with natural processes and human activities such as fertiliser use. |
| proxy evidence | Indirect evidence used to infer past climate, such as tree rings, ice layers, pollen or sediment. |
| ice core | A cylinder of ice drilled from an ice sheet or glacier; its layers and trapped air can preserve evidence of past climate. |
| climate anomaly | The difference between an observed value and the average for a stated baseline period. |
| mitigation | Action to reduce greenhouse-gas emissions or increase removal of greenhouse gases from the atmosphere. |
| adaptation | Changes that reduce harm from actual or expected climate impacts or make use of possible opportunities. |
| carbon sink | A store that absorbs more carbon from the atmosphere than it releases over a stated period, such as some forests or oceans. |
| carbon source | A process or store that releases more carbon to the atmosphere than it absorbs over a stated period. |
| feedback | A process that amplifies or reduces an initial change. A positive feedback strengthens the initial change; a negative feedback reduces it. |
| weather forecast | A prediction of likely atmospheric conditions over a short time, based on observations and models. |
| climate projection | A model-based description of possible future climate under stated assumptions, such as different greenhouse-gas emissions pathways. |
How the geography works
1. Weather is a connected set of atmospheric conditions
Weather describes what the atmosphere is doing now or over a short period. A weather report may include temperature, rainfall, wind speed and direction, cloud, visibility, sunshine and pressure. These elements interact. Solar energy warms the ground; the ground warms nearby air; rising or sinking air changes pressure; pressure differences drive wind; moving air carries heat and water vapour; cooling air can form cloud and precipitation.
Temperature is measured with a thermometer placed in a shaded, ventilated screen so that direct sunlight does not heat the instrument. Rainfall is measured with a rain gauge. Wind direction is named for where the wind comes from: a westerly wind blows from the west. An anemometer measures wind speed, while a barometer measures air pressure. Weather stations, satellites, ships, buoys, aircraft and weather balloons contribute observations. Instruments must be placed and maintained carefully so measurements can be compared over time.
Air pressure describes the weight of the air above a place. When air warms, it tends to expand and rise; when air cools, it tends to become denser and sink. Rising air is often associated with lower pressure near the surface, while sinking air can contribute to higher pressure. Wind develops because air moves in response to pressure differences. Earth’s rotation and surface friction alter the direction and speed of that movement. A simple school explanation says wind moves from high to low pressure; a full weather map shows that the path is curved and affected by other forces.
Low-pressure systems, or depressions, often bring unsettled conditions to the UK. Air converges and rises; rising air expands and cools. If it cools enough for water vapour to condense, cloud forms and precipitation may follow. High-pressure systems, or anticyclones, are often associated with sinking air and more settled conditions. In summer this can mean sunny, dry weather; in winter it can mean cold nights, frost or fog. High pressure does not automatically mean warm or sunny weather in every season.
An air mass may bring a distinctive combination of temperature and moisture. Air arriving from the Atlantic is often moist; air arriving from a continental region may be drier, but its conditions depend on the path it has taken and the season. When contrasting air masses meet, a front forms. Warm air may rise over denser cold air along a warm front; at a cold front, colder air pushes underneath warmer air and forces it to rise. Lifting can produce cloud and rain. The shape, speed and moisture of the system determine the weather that develops.
Weather forecasts combine observations with computer models. A forecast is not a promise that every location will receive exactly the same conditions: clouds, showers and wind vary over short distances. Forecast confidence tends to decrease farther into the future because small differences in the atmosphere can grow. Maps use symbols, colours, arrows and isobars to simplify complex conditions. Always read the key and time shown on the map.
2. Climate describes patterns, not just an average
Climate is more than a single average temperature or annual rainfall total. It includes the seasonal cycle, typical ranges, variability, prevailing winds and the chance of particular extremes. Two places can have the same annual mean temperature but different seasons: one may be warm throughout the year, while another has hot summers and cold winters. Two places can have the same average rainfall but receive it in different months or in a few intense storms rather than frequent light rain.
Climatologists use observations from weather stations and other sources over long periods. The World Meteorological Organization recommends standard 30-year climate normals so that places and periods can be compared using a consistent reference. A normal is not a forecast and does not describe every year. Some years will be warmer or colder, wetter or drier than the normal. The Met Office’s 1991–2020 UK climate averages are a current standard reference period for many routine comparisons.
Climate variability operates at different timescales. The daily passage of a depression creates weather variability. Seasonal cycles recur each year, though their timing and strength vary. Ocean–atmosphere patterns such as El Niño and La Niña can influence weather over several seasons and affect different regions differently. Decadal variations can make a climate trend look faster or slower over selected short windows. Long-term climate change is assessed across longer records and multiple indicators so that short-term ups and downs do not get mistaken for the whole trend.
A climate normal is calculated for a specific place or area and a stated period. A station on an exposed mountain is not interchangeable with one in a sheltered urban area. If comparing two stations, check their elevation, distance from the sea, setting and data completeness as well as the years used. A regional average may hide local differences, while a single station cannot represent an entire region without qualification.
3. The Sun, latitude and seasons
Most of the energy that drives Earth’s weather comes from the Sun. Solar radiation does not heat every part of Earth equally. Because Earth is roughly spherical, sunlight arrives at a higher angle near the Equator and a lower angle towards the poles. At high latitudes, the same energy is spread over a larger surface area and passes through more atmosphere. The poles therefore receive less average solar energy than tropical latitudes.
Earth’s axis is tilted relative to its orbit around the Sun. As Earth travels around the Sun, each hemisphere tilts towards or away from it during different parts of the year. The hemisphere tilted towards the Sun receives longer daylight and more direct sunlight, creating summer; the opposite hemisphere has shorter days and lower-angle sunlight, creating winter. Seasons are not caused by Earth being much closer to the Sun in summer. The distance changes slightly during the year, but axial tilt explains the opposite seasons in the Northern and Southern Hemispheres.
Latitude is therefore a broad control on climate. Near the Equator, sunlight is more direct through the year and seasonal temperature changes are often smaller. Higher latitudes experience greater seasonal differences in daylight and solar angle. Other factors can strengthen or alter these broad patterns. High mountains near the Equator can be cool because of altitude; warm ocean currents can make some high-latitude coasts milder than inland areas at a similar latitude.
4. Global circulation moves heat and moisture
The atmosphere redistributes heat and moisture around the planet. Warm air tends to rise, and cooler air tends to sink, setting up large-scale circulation patterns. Earth’s rotation deflects moving air: to the right in the Northern Hemisphere and to the left in the Southern Hemisphere. The real circulation varies through time, but a simplified three-cell model helps explain broad patterns of pressure, wind and rainfall.
Near the Equator, intense solar heating warms moist air, which rises. Rising air cools and water vapour condenses, helping to create cloud and heavy rainfall in a zone where winds converge. Higher in the atmosphere, some air flows poleward, cools and sinks in subtropical regions. Descending air is generally dry and creates belts where many of the world’s deserts are found. At higher latitudes, additional circulation cells and boundaries between contrasting air masses produce prevailing winds and shifting weather systems.
In the Northern Hemisphere mid-latitudes, prevailing winds often come from the west. The Met Office describes the UK as lying in the mid-latitude westerly belt, exposed to Atlantic air and near the polar front. The polar-front jet stream is a fast-moving current high in the atmosphere that helps steer weather systems. When the jet stream follows a relatively direct path, depressions may move through quickly. When it meanders or becomes positioned differently, weather systems can slow or change track, contributing to prolonged wet, windy, hot or settled spells. The jet stream is one influence among several; it does not control every detail of UK weather by itself.
The global circulation model is an average pattern. Actual pressure belts and winds shift with the seasons, land–sea heating contrasts, ocean conditions and other processes. Use it to explain broad climatic patterns, not to predict the weather for a particular date or town. A synoptic weather map shows a short-term situation; a global circulation diagram shows a long-term average.
5. How physical features influence local and regional climate
Distance from the sea
Land heats up and cools down more quickly than the sea. The sea can therefore moderate temperatures near a coast: coastal places are often cooler than inland places in summer and milder in winter. The effect depends on wind direction. A wind from the sea can bring maritime air inland; a wind from land may reduce the sea’s influence. Bays, islands, local currents and sea ice can also modify conditions.
Maritime air often contains more moisture than air that has travelled across a continent, so coastal locations may receive more cloud or precipitation when winds arrive from the sea. This is a tendency, not a rule for every coast. Local topography, storm tracks and prevailing wind direction matter. A coastal climate graph may show a smaller annual temperature range than a similar inland station, but check the data before claiming that pattern.
Altitude and relief
Temperature generally decreases with altitude in the lower atmosphere. Air pressure falls with height; rising air expands and cools. A high plateau can therefore be cooler than a lowland at the same latitude. Sun-facing slopes may receive more direct solar energy than shaded slopes. The aspect of a slope, cloud cover, wind and snow cover can all alter local conditions.
Relief also affects precipitation. Moist air forced to rise over hills or mountains expands and cools. If it reaches saturation, water vapour condenses into cloud and precipitation. This is relief, or orographic, rainfall. The side facing the incoming moist wind is the windward slope. Air descending on the other side warms and becomes relatively drier, which can contribute to a rain shadow. The result depends on the wind direction and the height and shape of the land. A rain shadow may shift when winds change.
Ocean circulation
Ocean currents transfer heat around the world. Warm surface water can make nearby air milder and moister; colder water can cool nearby air and affect fog and rainfall. Currents interact with winds, coastlines and deeper ocean circulation. It is too simple to say that one current alone makes the whole UK warm. The UK’s climate reflects its latitude, surrounding seas, prevailing westerly winds, ocean heat transport, topography and changing air masses together.
Urban areas and vegetation
Cities can be warmer than surrounding rural areas, especially at night, because buildings and paved surfaces absorb and store heat, there is less vegetation and water can run off rather than evaporate. Human heat from vehicles and buildings can add to the effect. The urban heat island varies with building form, weather, time of day and vegetation. It is a local climate feature; it does not explain global warming.
Trees and vegetation provide shade and release water vapour through transpiration, which can cool local air. Removing vegetation or changing land cover can alter surface temperature, soil moisture and runoff. Land-use change also affects greenhouse-gas emissions and carbon storage. A local microclimate and global climate change are related through energy and land use, but they describe different scales.
6. The UK’s varied weather and climate
The UK has a temperate maritime climate with changeable weather. Its location in the mid-latitude westerly belt exposes it to Atlantic weather systems, while closeness to mainland Europe means continental air can also influence conditions. The sea moderates temperatures, and relief creates local rainfall differences. The UK’s long coastline, many islands, varied elevation and urban land cover add further variation.
Broadly, many western and northern uplands receive more precipitation than many eastern and southern lowlands because moist westerly air is forced upwards over higher ground and then loses moisture as it moves east. Many eastern and southern areas tend to be warmer and sunnier in annual averages than northern and western areas. These are broad patterns described by the Met Office, not a rule for every station. Wind direction, altitude, season, distance from the coast and local topography can produce exceptions.
Wales, the Lake District and the Scottish Highlands contain high ground where relief rainfall can be substantial. Some lowland areas farther east lie in the lee of uplands and are comparatively drier. Scotland’s far north is generally cooler than southern England because it is farther from the Equator and includes high mountains. Yet a warm southerly wind can temporarily bring mild conditions to the north, and cold easterly air can make southern areas cold. Climate describes averages and patterns; it does not remove day-to-day weather variation.
The UK experiences frontal rainfall as Atlantic depressions pass, relief rainfall over high ground, and convective showers when the Sun strongly heats moist air. Snow and frost become more likely in colder conditions, but altitude and air mass matter as well as latitude. Coastal places may be milder in winter; inland places can have a larger seasonal temperature range. Do not infer a climate trend from one unusually cold winter or a single warm summer.
7. Past climates: the Ice Age to the present
Earth’s climate has changed naturally throughout geological history. Over the past 2.6 million years, the Quaternary Period has included repeated glacial periods when large ice sheets expanded and warmer intervals when ice retreated. The UK landscape preserves evidence of these changes. Ice sculpted valleys, moved rocks and left sediments; changing ice volume altered sea levels. BGS evidence indicates that the last major British glaciation ended thousands of years ago, and glaciers formed again in parts of the Scottish Highlands during a later cold interval.
The term “Ice Age” is sometimes used for a long period with extensive ice sheets and sometimes for a particular cold phase within that period. Britain has experienced more than one glaciation and warmer interglacial intervals. The present interglacial began after the last major glacial period. When the climate warmed, ice sheets retreated, sea levels changed and plants and animals shifted their ranges. These processes changed the conditions in which human communities lived.
Natural factors that can change climate include:
- Changes in Earth’s orbit and tilt: Earth’s orbit, axial tilt and the direction of its axis vary over tens of thousands of years. These Milankovitch cycles change how solar energy is distributed by season and latitude. Small changes in summer sunlight at high latitudes can help determine whether winter snow melts or accumulates. They are important for the timing of ice ages, but they cannot explain the rapid warming observed in recent decades.
- Volcanic eruptions: Large explosive eruptions can send reflective particles high into the atmosphere. These aerosols reflect some sunlight and can cool global average temperatures for a short period. Volcanoes also release greenhouse gases, but recent human emissions are much greater than volcanic carbon dioxide emissions.
- Changes in solar output: The Sun’s energy varies slightly over time. Solar changes can influence climate, but observations and attribution studies show that they do not explain the recent global warming trend.
- Plate movement and mountain building: Over millions of years, moving continents change ocean gateways, wind belts and the distribution of land and sea. Mountain building can alter atmospheric circulation and the long-term carbon cycle.
- Ocean–atmosphere variability: Patterns such as El Niño and La Niña redistribute heat between ocean and atmosphere and can alter weather for seasons or a few years. They contribute to variability but do not account for the long-term rise in global temperature.
- Natural greenhouse-gas changes and feedbacks: Changes in ice, vegetation, ocean storage and greenhouse gases can amplify or reduce an initial climate change. In past ice-age cycles, orbital changes helped initiate shifts and feedbacks involving ice and greenhouse gases strengthened them.
Natural change does not mean that every modern change is natural. The cause of a trend must be tested using evidence, time scale and physical understanding. Natural factors can still affect individual years; the key question is whether they explain the direction and size of the sustained modern change.
8. Evidence from the past: how scientists reconstruct climate
Direct thermometer records cover only a small part of Earth’s long history. Scientists use indirect clues, called proxies, to reconstruct earlier climates. Each proxy records particular conditions and has strengths and limits.
Ice cores contain visible layers of snowfall that compact into ice. The layers can record changes in dust, volcanic particles and snowfall. Tiny air bubbles trapped in the ice preserve samples of past atmosphere, including greenhouse gases. Chemical ratios in the ice can provide clues about past temperatures. An ice core from Greenland records regional conditions and a long history; it does not directly represent every place on Earth.
Tree rings can reveal annual growth conditions. Wide or narrow rings may reflect temperature, rainfall, pests or competition, depending on the tree and location. Pollen in lake and bog sediments provides evidence about the plants that grew nearby; changes in pollen can suggest changing temperature or rainfall. Ocean sediments, corals and cave deposits contain further clues about past sea temperatures, rainfall, ice volume and chemistry.
Glacial landforms and deposits show where ice once advanced or retreated. In the UK, corries, U-shaped valleys, moraines, erratics and glacial sediments preserve evidence of former ice. These features reveal past environments and can be mapped. They are not direct thermometers: scientists interpret them together with dating methods, sediment sequences, fossils and other evidence.
Proxy records may have gaps, different time resolution, local influences or dating uncertainty. A single proxy can produce a misleading picture if it is treated as a complete global record. Scientists compare independent records and use physical models to see whether a proposed explanation is consistent with all the evidence. This is similar to solving a puzzle: one piece helps, but confidence grows when several independent pieces fit together.
9. The natural greenhouse effect and its human enhancement
Sunlight reaches Earth mainly as shortwave radiation. Some is reflected by clouds, ice and bright surfaces; much is absorbed by the land and oceans, which warm. The warmed surface emits energy back upwards as longer-wavelength infrared radiation. Greenhouse gases, including water vapour, carbon dioxide, methane and nitrous oxide, absorb some of this infrared radiation and emit energy in different directions. Some energy returns towards the surface and lower atmosphere. This natural greenhouse effect keeps Earth warmer than it would be without these gases.
The greenhouse effect is not the same as the way a glass greenhouse traps warm air. In the atmosphere, gases affect the transfer of infrared radiation. The natural greenhouse effect is necessary for life as we know it. The climate problem arises because human activities have increased concentrations of several greenhouse gases, strengthening the effect and shifting the planet’s energy balance.
Human sources include burning coal, oil and gas for electricity, heating, transport and industry; clearing forests and changing land use; livestock and some agricultural practices; fertiliser use; and waste. Carbon dioxide is long-lived and accumulates when emissions exceed the amount taken up by land and ocean sinks. Methane has a shorter atmospheric lifetime than carbon dioxide but is more effective at trapping heat over a given period. Nitrous oxide is released from natural and human sources, including some agricultural activity. The gases differ, so climate scientists compare them using defined measures and time periods.
More greenhouse gas means more infrared energy is absorbed and emitted within the climate system. The surface and lower atmosphere warm until the system moves towards a new balance. Warming affects oceans, ice, rainfall, ecosystems and weather patterns. The response is not identical everywhere: regional precipitation and extremes depend on circulation, geography and local factors. The basic global warming trend is clear even though some local details are uncertain.
Water vapour is an important greenhouse gas, but at today’s climate it mainly acts as a feedback. When the atmosphere warms, it can hold more water vapour, which adds further greenhouse warming. Human emissions of carbon dioxide, methane and other long-lived gases initiate much of the current warming; increased water vapour amplifies it. This distinction between a forcing and a feedback helps explain the process accurately.
10. Evidence for current human-caused climate change
Scientists assess climate change using many independent measurements. Surface thermometers show long-term warming. Measurements of ocean heat show that the oceans are storing more energy. Many glaciers are losing mass, Arctic sea ice has declined over recent decades, and global mean sea level has risen through a combination of ocean warming and melting land ice. Seasonal patterns in plants and animals have shifted in many places. These indicators respond in ways expected from a warming climate.
Evidence of rising greenhouse-gas concentrations comes from direct measurements and from analysis of trapped air in ice cores. Scientists can identify the chemical fingerprints of fossil-fuel carbon, linking emissions to human sources. Satellite observations measure changes in outgoing radiation at wavelengths associated with greenhouse gases. Climate models that include human greenhouse-gas emissions reproduce the observed long-term warming more successfully than models that include only natural drivers such as solar changes and volcanoes.
The IPCC’s Sixth Assessment concluded that human influence has warmed the atmosphere, ocean and land since pre-industrial times. Its conclusion is based on many lines of evidence, including instrumental records, paleoclimate proxies, physical understanding and climate simulations. The Met Office’s annual State of the UK Climate reports combine long-running station records and other indicators to describe how the UK climate is changing. Because datasets are revised and new reports appear, use the report year and baseline shown with any statistic.
Attribution science asks how human-caused climate change has altered the likelihood or intensity of a particular event. It does not claim that climate change created every storm, drought or heatwave. For some heat extremes, the role of warming can be assessed with high confidence; for some local rainfall events, evidence may be more uncertain because observations are sparse and weather has strong natural variability. Ask whether the study compares probabilities, intensity or both, and what period and region it covers.
11. Climate impacts are uneven across places and people
Climate change influences physical systems and human activity through shifts in average conditions, seasonal patterns and extremes. A warmer atmosphere can intensify heat stress. A warmer ocean and atmosphere can influence heavy rainfall, but changes in rainfall are not uniform across the world. Sea-level rise increases the baseline from which tides and storm surges act. Warming affects the timing of snow and ice melt, growing seasons, wildfire conditions and water demand. The outcome at a particular place depends on local geography and vulnerability.
The UK may face increased heat risk, changing seasonal rainfall, sea-level rise, coastal flooding and pressure on water resources. Exact effects differ by region. Upland catchments, low-lying coasts, dense urban areas, farmland and transport networks face different combinations of exposure. A town with parks, shade, health services and cooling centres may cope differently from a neighbourhood with little green space, poor housing and limited access to care.
Climate impacts can affect food production through heat, water availability, pests and soil conditions. They can affect ecosystems when temperatures and seasonal timing move beyond the conditions to which species are adapted. They can affect health through heat, air quality, infectious disease patterns and mental stress after disasters. Transport, energy systems and buildings can be disrupted by extreme heat, flooding, storms or drought. Some changes bring local benefits—for example, longer growing seasons for certain crops in some places—but benefits are not guaranteed and may be outweighed by other risks.
Vulnerability is uneven within a country. Older people, infants, people with health conditions, outdoor workers, low-income households and people living in poorly insulated homes may face particular heat risks. Coastal communities may face damage to homes, jobs and cultural places as sea levels rise or shorelines change. Farmers and water managers may need to adapt to changing seasonal conditions. These are not simply physical problems: resources, planning, public health, insurance, housing and political choices influence who can respond.
Climate is connected to other geography topics. Rainfall and evaporation influence rivers, soil and water resources. Temperature and moisture influence ecosystems and agriculture. Sea-level rise affects coasts and settlements. Climate-related migration can occur when livelihoods become difficult, but migration decisions involve employment, family, conflict, policy and choice as well as environmental conditions. Avoid explaining a complex movement of people using climate as its only cause.
12. Mitigation and adaptation
Mitigation reduces the amount of greenhouse gases added to the atmosphere or increases the amount removed. Examples include replacing high-emission energy with lower-emission sources, improving energy efficiency, using public transport, reducing methane leaks, protecting and restoring forests, and changing industrial processes. A carbon sink such as a forest absorbs carbon, but its capacity is finite and can be reversed by fire, drought or deforestation. No single action is enough on its own.
Mitigation often requires coordination among governments, businesses, communities and individuals. Energy systems, housing, transport and food supply chains are linked, so changes in one can affect others. Renewable energy can reduce emissions during operation, but infrastructure requires land, materials, storage, grid connections and careful siting. Electric vehicles reduce tailpipe emissions, but electricity generation and battery supply chains also matter. Evaluations should compare life-cycle impacts, affordability, reliability and who benefits.
Adaptation reduces harm from current or expected climate impacts. Examples include urban shade and cool roofs during heat, flood warnings and flood-resistant buildings, water conservation and storage during drought, coastal setback zones, heat-health plans, drought-tolerant crops, restoring wetlands and updating drainage. Adaptation can protect lives and livelihoods, but it cannot prevent all impacts. A flood wall can reduce some flood risk while transferring water elsewhere or giving a false sense of security if it is overtopped.
Mitigation and adaptation are complementary. Reducing emissions limits future warming; adaptation prepares for changes already underway and those expected. A community can adapt to heat while also reducing emissions from buildings. Some actions provide both benefits: urban trees can shade streets, reduce some heat exposure, support biodiversity and store carbon, though they require water, space and long-term care.
Decisions involve trade-offs and fairness. A new sea wall may protect valuable buildings but alter beaches or sediment movement. Moving infrastructure away from a coast can reduce future exposure but may affect jobs, family ties and cultural connections. A low-carbon transport project may improve air quality but require investment and changes to travel. Ask whose knowledge is used, who pays, whose safety improves, whether people can access the measure and how success will be monitored.
Place example
The UK comparisons below are illustrative examples, not required national case studies. Use them to practise interpreting climate data and linking place to process. Your school may choose different locations.
Western uplands and East Anglia: rainfall contrast
The western uplands of the UK and the low-lying east provide a useful regional comparison. The Met Office describes a broad tendency for western and northern locations to be wetter and for eastern and southern locations to be drier, warmer and sunnier in long-term averages. High ground in Wales, north-west England and Scotland can force moist Atlantic air to rise, cool and produce precipitation. As air crosses the uplands and descends farther east, it may be drier, contributing to a rain-shadow pattern.
This is a broad pattern, not a guarantee for a particular day, year or station. Easterly winds can bring a different weather pattern. Local hills, altitude, coastlines and urban land cover create variation. East Anglia includes river valleys, coastal areas and settlements with different local conditions; the western uplands also vary by aspect and elevation. Compare stations using the same climate normal, preferably the Met Office 1991–2020 period, and check elevation and location before drawing conclusions.
The contrast has human relevance. Rainfall, storage, groundwater, river flow and demand influence water availability. A drier climate average does not by itself mean that every community has water scarcity; reservoirs, aquifers, transfers, infrastructure and water use matter. A wetter upland does not mean water is always available where people need it. This example links climate to hydrology and resources while keeping the explanation process-based.
Coastal and inland UK stations: temperature range
Compare a coastal station in south-west England with an inland station using matched monthly climate normals. Plot mean temperature and precipitation for each month, and keep the same axes and units. Coastal temperatures often have a smaller annual range because the nearby sea warms and cools more slowly than land. In winter, maritime air may moderate cold; in summer, sea breezes and cooler water can limit daytime temperatures. An inland station may heat and cool more quickly, although elevation, urbanisation and local exposure also affect the result.
To write a comparison, describe the data first: “The coastal station has a smaller difference between its coolest and warmest monthly mean temperatures than the inland station.” Then explain the pattern: “The sea changes temperature more slowly than land, so it moderates nearby air.” Check whether the stations are at comparable heights and whether urban heat influences one site. Do not attribute every difference to distance from the sea when several factors vary together.
Ice-age evidence in Britain
The UK landscape holds evidence of past climate in its landforms and superficial deposits. Glacial valleys, moraines, erratics and sediment layers show where ice once moved or deposited material. The British Geological Survey describes the Quaternary as a period of repeated glacial and warmer intervals, and its maps and research show how ice altered both upland and lowland landscapes. In Scotland, Glen Roy’s parallel shorelines record ice-dammed lakes during a later cold interval after a previous ice sheet had retreated.
This example links climate evidence to physical geography. A map of glacial landforms can show the spatial extent and direction of ice movement. A landform alone cannot reveal a complete temperature history, so researchers combine geomorphology with sediments, fossils, dating and climate proxies. The glaciation guide explains the processes that form the landforms; this guide explains how those landforms also preserve evidence about past climate.
Maps, data and evidence
Read a climate graph
A climate graph usually shows monthly precipitation with bars and monthly mean temperature with a line. Begin with the location, elevation, dates and source. Check both vertical axes: rainfall may use millimetres and temperature degrees Celsius, and the axes can have different scales. Identify the months with the highest and lowest values, the seasonal pattern, and the approximate annual temperature range. If the graph includes only averages, it does not show the full range of weather or the frequency of extremes.
For a comparison, use these steps:
- Check that both graphs cover the same months and use comparable units.
- Check the climate-normal period and station locations.
- Describe one temperature pattern and one precipitation pattern using data from the graphs.
- Explain the pattern using latitude, altitude, distance from the sea, prevailing winds or relief where relevant.
- Mention an exception or limitation if the sites differ in more than one way.
Suppose two real Met Office graphs show a smaller annual temperature range at a coastal station and a larger range inland. Describe the pattern, then explain how land and sea heat and cool at different rates. If the coastal station is also lower in altitude or farther south, note that these factors might affect the comparison. Evidence supports a geographical explanation; it rarely isolates one cause perfectly.
Understand a climate normal and anomaly
A climate normal is an average for a stated period. A temperature anomaly is the difference between an observation and a baseline average. If a map says “temperature anomaly relative to 1991–2020,” a shaded value above zero means warmer than that baseline; below zero means cooler. It does not show the absolute temperature. The same month can be warmer than one baseline and cooler than another.
An anomaly map helps compare places because it shows differences from each location’s normal conditions. However, the map still needs a time period, legend, variable and baseline. Check whether the anomaly is for a month, season or year, and whether the map is provisional. A regional mean can hide local variation. A single warm month is evidence about that month, not by itself proof of a long-term climate trend.
Compare weather with climate evidence
Weather maps show short-term conditions. Isobars join points of equal pressure. Closely spaced isobars usually indicate a stronger pressure gradient and stronger winds. Front symbols show boundaries between air masses. Use the key and forecast time before describing the map. A climate graph, by contrast, summarises conditions over many years. Do not use one in place of the other: a weather map cannot describe a 30-year climate normal, and a climate average cannot tell you whether it will rain tomorrow.
If a news report describes a heatwave, separate three questions: Was it hot at this place and time? How unusual was it compared with the local climate normal? Has climate change altered the likelihood or intensity of this type of event? The first two can be answered with weather observations and historical records. The third requires an attribution study or broader climate analysis. Avoid the claim “climate change caused this one day” unless a scientific attribution source supports the wording.
Read past-climate evidence
When using an ice-core graph, identify what the lines show: temperature proxy, carbon dioxide, methane, dust or another variable. Check the time axis, which may run from thousands of years ago towards the present. Note whether the evidence is local or global and whether measurements are direct or inferred. A close relationship between two records can support an explanation, but it does not always reveal which process began first. Use additional evidence and scientific understanding.
Tree-ring data usually have annual resolution at a particular site. Pollen records can cover longer periods but may combine material from a wider area and be affected by how pollen is preserved. Glacial landforms provide spatial evidence of past ice, but dating can have uncertainty. Scientists compare several records to reduce reliance on a single proxy.
Test a place-based climate explanation
Use the question: “Why is one site wetter than another?” First describe the measured difference using a matched period and units. Then map the stations relative to relief and prevailing winds. If moist air arrives from the west, check whether the wetter site is on a windward slope and whether the other is sheltered. Consider altitude, distance from the sea, exposure and seasonal wind changes. Use a precipitation map or regional climate summary to see whether the local pattern fits a broader pattern.
Next, consider limits. Were the stations operating for the full normal period? Is the map based on point observations or gridded estimates? Could one station be on a mountain slope while the other is in a city? Does the annual average conceal different seasonal patterns? A careful answer states the evidence, gives the most plausible process and acknowledges what the data cannot prove.
Compare climate-change indicators
Choose at least two independent indicators, such as global temperature, ocean heat, sea level, glacier mass or growing-season timing. Record the time span, location and data source for each. Ask whether each indicator changes in a direction expected from a warming climate. Compare the evidence: thermometers measure air temperature directly at stations, whereas tree rings or ice-core chemistry are proxies. Sea level responds to both ocean warming and land-ice melt, so it is a combined indicator.
Evidence is stronger when independent indicators, measurement methods and scientific explanations point in the same direction. One local record can contain gaps or unusual conditions; a network of records gives a more reliable picture. The IPCC and Met Office explain their methods and uncertainties in reports. For school work, use their summaries and graphs, note the baseline and avoid mixing data periods without explanation.
Common misconception
- “Weather and climate are the same.” Weather is short-term; climate describes longer-term patterns, including variability and extremes.
- “Climate is only the average temperature.” Climate also includes rainfall, winds, seasons, variability and the likelihood of extreme conditions.
- “The seasons happen because Earth is closer to the Sun in summer.” Earth’s axial tilt changes the angle and duration of sunlight; the hemispheres have opposite seasons.
- “A cold day disproves global warming.” Daily weather varies around the long-term climate trend, and local weather can be cold while the global average rises.
- “A hot day proves climate change.” One hot day is weather evidence. Long-term records and attribution are needed to assess climate change.
- “The UK has the same climate everywhere.” The UK has strong variation with latitude, altitude, relief, wind direction, distance from the sea and urban land cover.
- “Every western place is wet and every eastern place is dry.” This is a broad tendency, not a rule; local topography, air masses and seasons create exceptions.
- “Rain falls only when clouds are present.” Clouds are needed for precipitation, but not every cloud produces rain at a particular place or time.
- “The greenhouse effect is always harmful.” The natural greenhouse effect keeps Earth warm enough for life; the enhanced effect from extra greenhouse gases causes additional warming.
- “The atmosphere works like a glass roof.” Greenhouse gases affect infrared radiation; they do not form a solid barrier that traps all heat.
- “Water vapour is the main human cause of current warming.” Human emissions of carbon dioxide and other long-lived gases drive current warming; water vapour mainly amplifies warming as a feedback.
- “Past ice ages mean current warming must be natural.” Climate has changed naturally, but scientists test the causes of each period. Natural factors do not explain the rapid modern warming as well as human greenhouse-gas emissions do.
- “Scientists use only one thermometer record.” They compare multiple land, ocean, ice, satellite and proxy records and assess their limitations.
- “A climate normal predicts every year.” It is a reference average for a stated period, not a forecast for a particular year.
- “A warmer world means every place becomes wetter.” Rainfall changes vary by region and season; some places may become wetter and others drier.
- “Mitigation and adaptation mean the same thing.” Mitigation reduces causes; adaptation reduces harm from impacts.
- “Renewable energy has no impacts.” Every energy system has material, land, cost and environmental considerations; compare full systems rather than calling one impact-free.
Self-check
Recall
- What is the difference between weather and climate?
- Name four elements measured in a weather station.
- What is a climate normal, and why is a 30-year period useful?
- Why is it warmer near the Equator on average than near the poles?
- How does Earth’s axial tilt create seasons?
- What is relief rainfall?
- What is the difference between a windward slope and a rain-shadow area?
- Name two natural factors that have changed climate in the past.
- What information can an ice core preserve?
- What is the difference between mitigation and adaptation?
Explain
- Explain why a coastal place may have a smaller annual temperature range than an inland place.
- How can a mountain range affect precipitation on its windward and sheltered sides?
- Describe how a low-pressure system can produce cloud and rain.
- Explain how greenhouse gases warm Earth naturally.
- Explain how burning fossil fuels strengthens the greenhouse effect.
- Why can water vapour amplify warming even though it is not the main human cause of modern climate change?
- How can orbital changes contribute to ice-age cycles?
- Why do scientists use several kinds of evidence to reconstruct past climate?
- Why can global warming influence UK water resources without causing every UK region to become drier?
- Explain why a flood wall is an adaptation measure and not mitigation.
Apply and interpret
- A climate graph shows that a western upland station receives more precipitation in most months than an eastern lowland station. Write a description and a process-based explanation. Include one limitation of the comparison.
- A temperature-anomaly map shows a positive value relative to 1991–2020. What does the value tell you, and what does it not tell you?
- A report says one winter was colder than the previous winter. What additional evidence would you need to decide whether the climate trend has changed?
- An ice-core record shows changes in temperature proxy and carbon dioxide across several glacial cycles. Give one conclusion the pattern may support and one question that requires more evidence.
- Two UK towns are at a similar latitude. One is on the coast and one is inland. Name two climate variables you would compare and explain what pattern you might expect.
- A city centre is warmer at night than a nearby rural station. Give two local factors that might explain the difference and one reason this is not by itself proof of global warming.
- A council proposes tree planting, reflective roofs and a heat-health plan. Classify each action as mitigation, adaptation or both, then identify one limitation.
- A school is planning a flood-resilient extension. Name two pieces of climate or geographical evidence it should consult and explain why a current flood map alone may be insufficient.
- Explain how a wet weather event can be influenced by a changing climate without claiming that climate change created the weather system.
- Create a short evidence chain connecting a climate indicator, a physical process and a possible impact on people. Include a source and a limitation.
Suggested answers and reasoning
- Weather is atmospheric conditions over a short time; climate is the longer-term pattern of weather in a place or region.
- Temperature, precipitation, wind, cloud, humidity, pressure or sunshine. Give any four and match each with its correct unit or instrument if asked.
- A climate normal is a multi-decade reference average, often 30 years. It smooths short-term variability and lets users compare periods consistently; it does not predict each year.
- Sunlight arrives more directly near the Equator and is spread over a larger area near the poles. The tilt and curvature of Earth affect the amount of solar energy received.
- Earth’s axis is tilted. As Earth orbits the Sun, each hemisphere receives different daylight lengths and sunlight angles, producing opposite seasons.
- Moist air is forced up higher ground, expands and cools; condensation forms cloud and precipitation on the windward side.
- The windward slope faces incoming moist air; the sheltered side is in the lee and may receive less precipitation after air has lost moisture and descends.
- Examples include orbital variations, volcanic aerosols, changes in solar output, ocean–atmosphere variability and plate movement over very long timescales.
- Ice layers, dust and volcanic material, clues to past temperature, and bubbles containing samples of past atmosphere including greenhouse gases.
- Mitigation reduces emissions or increases removals; adaptation reduces harm from actual or expected impacts.
- The sea heats and cools more slowly than land, moderating nearby air. Wind direction, altitude and urbanisation can change the result.
- Rising air cools and may condense on the windward side, producing precipitation. Descending air on the sheltered side warms and is relatively drier, contributing to a rain shadow.
- Air converges and rises; it expands and cools; if it reaches saturation, water vapour condenses into cloud and precipitation may develop.
- The surface absorbs solar energy and emits infrared radiation. Greenhouse gases absorb and emit some infrared energy, including back towards the surface, warming the lower atmosphere and surface.
- Fossil-fuel combustion adds carbon dioxide to the atmosphere. Higher greenhouse-gas concentrations alter infrared energy transfer and strengthen warming.
- Warmer air can hold more water vapour; water vapour is a greenhouse gas, so it adds further warming. Human emissions of long-lived gases help initiate the change; water vapour is mainly a feedback.
- Orbital shape, axial tilt and the direction of Earth’s axis change how sunlight is distributed by season and latitude. High-latitude summer sunlight can influence whether snow melts or accumulates; feedbacks can strengthen the response.
- Each proxy records only part of the climate story and has limits. Multiple independent records help check interpretation, timing and regional differences.
- Climate change can alter seasonal rainfall, evaporation, snowmelt and demand differently across regions. Water availability also depends on rivers, aquifers, storage, infrastructure and use.
- A flood wall reduces exposure or impacts from flooding; it does not reduce greenhouse-gas emissions or remove the cause of climate change.
- Describe the precipitation difference without inventing values. Explain that moist westerly air rises over western uplands, cools and condenses; air may be drier after crossing high ground. Note station altitude, exact location or period as a limitation.
- It means the measured temperature was above the average for the stated baseline and time period. It does not give the absolute temperature or show a long-term trend by itself.
- Use a longer, consistent temperature record, compare appropriate climate normals, check spatial coverage and consider natural variability. One winter is not enough to establish a change in trend.
- The pattern may support a relationship between greenhouse gases and temperature over glacial cycles. It does not alone establish which change initiated each cycle or explain modern warming; use orbital evidence, dating and other proxies.
- Compare monthly mean temperature, annual temperature range, precipitation, wind or frost. The coastal site may have a smaller temperature range and milder winters, though altitude, exposure and currents matter.
- Buildings and paving store heat; less vegetation and water reduce cooling by shade and evaporation; waste heat can add warmth. This is a local urban heat-island effect and does not establish a global trend.
- Trees can be both: they may provide shade and store carbon, though storage is limited and vulnerable. Reflective roofs are mainly adaptation by reducing heat absorption. A heat-health plan is adaptation. Limitations include maintenance, water, land, cost, coverage or emissions across the life cycle.
- Consult flood-risk and topographic maps, climate projections or local rainfall/river records, drainage and geology data. A current map may omit future conditions, local drainage, changed land use or new evidence.
- Climate change alters the background conditions—such as air and ocean temperature and available moisture—so it can change the probability or intensity of some events. The weather system still forms through atmospheric processes; attribution is needed to assess the climate contribution.
- Example: long-term temperature records show warming; warmer air can increase heat stress; people in poorly shaded homes may face higher health risk. A source should identify the data period and the limitation might be that regional averages hide neighbourhood differences.
Revision points
- Define weather and climate precisely, including the timescale and the role of variability.
- Explain climate patterns through linked factors: latitude, altitude, sea, winds, circulation and relief.
- For UK rainfall, connect moist Atlantic air, western uplands and sheltered eastern areas, then mention local exceptions.
- Distinguish weather maps and forecasts from climate normals, anomalies and projections.
- Use past-climate proxies carefully: identify what each records, its location and its limits.
- Explain the greenhouse effect as energy transfer. The natural effect supports life; human emissions enhance it.
- Support the present-day explanation with multiple indicators and attribution evidence, not one weather event.
- Separate the global trend from regional impacts; geography, exposure and resources influence local consequences.
- Remember the response distinction: mitigation reduces causes; adaptation reduces harm.
Curriculum alignment
- Curriculum coverage IDs:
ks3.physical.weather-climate,ks3.physical.ice-age-to-present,ks3.human-physical-interaction - Related practice packs:
ks3_geography_weather_climate - Shared concept tags:
weather,climate,climate-change,atmosphere
Sources
- Curriculum/specification: Department for Education: National curriculum in England — Geography programmes of study
- Weather elements and temperature controls: Met Office: Understanding weather
- Global atmospheric circulation: Met Office: Global circulation patterns
- UK climate patterns: Met Office: UK regional climates
- Matched station normals: Met Office: Location-specific long-term averages
- UK data and anomaly maps: Met Office: UK actual and anomaly maps
- UK climate observations: Met Office: State of the UK Climate
- Greenhouse effect and climate drivers: Met Office: Causes of climate change
- Assessment of human influence: IPCC Sixth Assessment Report, Working Group I, Chapter 3
- UK ice-age evidence: British Geological Survey: Impacts of climate change
- Past-climate proxies: NASA: Paleoclimatology — Explaining the Evidence
- Adaptation and mitigation: Met Office: Climate change mitigation
- Use the observation period, location, baseline and method stated by each source. For up-to-date UK figures, use the latest Met Office report; for a climate normal, use the specified 30-year period.