 FoxChild@Learn
4. Plate tectonics and tectonic hazards
Curriculum status: Required core content.
This guide follows the England Key Stage 3 Geography programme of study. It explains how Earth’s moving plates shape the surface and why earthquakes, volcanoes and tsunamis are concentrated in particular regions. Named events below are illustrative examples, not a prescribed case-study list. The aim is to understand the processes, compare how hazards affect places and use evidence carefully.
Required knowledge
- Describe Earth’s internal structure at a simplified level and explain that its rigid outer shell is divided into moving tectonic plates.
- Locate the broad distribution of plate boundaries, earthquakes, volcanoes and mountain belts, recognising that these patterns are strongly related but not identical.
- Explain how plates move apart, move towards one another or slide past, and relate those movements to crust formation, subduction, mountain building and earthquakes.
- Describe how stress can build along a fault and be released suddenly as an earthquake. Distinguish the focus, epicentre, seismic waves, magnitude and intensity.
- Explain how magma forms and rises, and how magma composition, temperature and gas content influence eruption style and the hazards produced.
- Identify primary and secondary hazards from earthquakes and volcanoes, including ground shaking, surface rupture, landslides, ash, lava, pyroclastic flows, lahars and—in some settings—tsunamis.
- Compare the impacts of tectonic events in different places. Explain that the physical event alone does not determine the disaster: exposure, building design, preparedness, wealth, governance, access and response matter.
- Describe ways that people monitor, prepare for, respond to and recover from tectonic hazards, while understanding that monitoring cannot give the exact time and place of every earthquake.
- Interpret a plate-boundary diagram, distribution map, earthquake record or impact table and support a conclusion with evidence.
Key vocabulary
| Term | Meaning and use |
|---|---|
| crust | Earth’s thin, outermost rocky layer. Oceanic and continental crust differ in thickness, composition and density. |
| mantle | A thick layer of hot silicate rock beneath the crust. Over long geological timescales, parts of the mantle can flow slowly even though most of it is solid. |
| core | Earth’s central region, mainly composed of iron and nickel; it has a liquid outer core and a solid inner core. |
| lithosphere | The rigid outer layer made of the crust and the uppermost mantle. It is divided into tectonic plates. |
| tectonic plate | A large moving section of lithosphere. Plates can carry oceanic crust, continental crust or both. |
| asthenosphere | A hotter, weaker part of the upper mantle beneath the lithosphere, which can deform and flow slowly over geological time. |
| plate boundary | The zone where neighbouring plates meet and interact. Boundaries can be diffuse rather than one perfectly thin line. |
| divergent boundary | A boundary where plates move apart; rising magma can cool and form new crust. Also called a constructive margin in some school materials. |
| convergent boundary | A boundary where plates move towards one another. Subduction or continental collision may occur. Also called a destructive margin where crust is subducted. |
| transform boundary | A boundary where plates move sideways past one another. Also called a conservative margin because crust is not generally created or destroyed there. |
| subduction | The descent of one lithospheric plate beneath another into the mantle at a convergent boundary. |
| collision zone | A region where two continental plates converge; buoyant continental crust resists subduction and may crumple, thicken and uplift. |
| fault | A fracture in rock along which movement has occurred or may occur. |
| stress | Force acting on rock. Tectonic stress can cause rock to deform, fracture or slip. |
| elastic rebound | A simplified model in which rocks deform as stress builds, then move suddenly along a fault and release some stored energy. |
| earthquake focus (hypocentre) | The point within Earth where an earthquake rupture begins. |
| epicentre | The point on Earth’s surface directly above the earthquake focus. |
| seismic wave | Energy travelling through Earth or along its surface after an earthquake. |
| magnitude | A measure of earthquake size calculated from seismic recordings; it describes the event, not the damage at every location. |
| intensity | A description or measure of shaking and observed effects at a particular place. It can vary from site to site during the same earthquake. |
| aftershock | An earthquake that follows a larger event in the same general area as faults adjust; aftershocks can continue for days, months or longer. |
| liquefaction | A process in which water-saturated, loose sediment loses strength during strong shaking and behaves more like a fluid. |
| magma | Molten or partly molten rock below Earth’s surface. |
| lava | Molten rock that reaches the surface during an eruption. |
| vent | An opening through which volcanic material may reach Earth’s surface. |
| viscosity | A fluid’s resistance to flow. More viscous magma tends to flow less easily and can trap gases. |
| shield volcano | A broad volcano built mainly by repeated flows of relatively runny lava. Eruption style depends on magma and other conditions, not shape alone. |
| composite volcano | A steep-sided volcano built from layers of lava and fragmental material; eruptions can vary in style. |
| pyroclastic flow | A fast-moving, hot mixture of volcanic gas, ash and fragments that flows down the side of a volcano. |
| lahar | A flow of water mixed with volcanic ash, soil and rock fragments, which may travel down valleys. |
| tsunami | A series of long waves caused by sudden displacement of a large volume of water, often by an undersea earthquake, but also by landslides or volcanic activity. |
| hazard | A potentially damaging physical event or process. Whether it becomes a disaster depends on who and what are exposed and how vulnerable they are. |
| exposure | People, buildings, services and livelihoods located where a hazard may affect them. |
| vulnerability | The conditions that make people or systems more likely to be harmed or less able to cope. |
| resilience | The ability to prepare for, withstand, respond to and recover from a hazard. |
How the geography works
1. A dynamic planet with a moving outer shell
Earth has several internal layers. At the centre is the core. Around it is the mantle, and at the surface is the crust. For plate tectonics, the useful idea is that the crust and the rigid uppermost mantle form the lithosphere. This lithosphere is broken into large plates that move relative to one another. Some plates carry mostly oceanic crust; others carry continental crust as well as ocean floor. Their edges are not always neat cracks visible at the surface: some plate-boundary zones are broad regions containing many faults and smaller blocks.
The mantle is very hot, but it is misleading to imagine it as a vast ocean of liquid rock. Most mantle material is solid. Over immense periods, hot rock can deform and flow slowly, rather like a material that is solid in a short experiment but behaves differently if force acts for millions of years. Heat inside Earth contributes to mantle movement. Plate motion is also driven by forces associated with sinking, dense oceanic slabs and the gravitational push from elevated ridges. These mechanisms interact; a single set of convection arrows is a helpful simplification, not the whole explanation.
Tectonic plates move only a few centimetres per year in many places—about the speed that fingernails grow. A centimetre each year sounds small, but it adds up over millions of years. Where plates meet, separate, or slide past one another, forces deform rock. This helps explain why earthquakes, volcanoes and mountain belts form recognisable global patterns. A map of earthquakes is a useful way to see the boundaries, though earthquakes can also occur away from plate edges on old faults.
The idea of moving continents developed from several kinds of evidence, including the matching shapes of some continental margins, similar rocks and fossils on now-separated continents, and evidence for past climates. Sea-floor mapping and magnetic patterns on the ocean floor later helped support the theory of plate tectonics. Modern measurements using satellites can track plate movement directly. Scientific explanations become stronger when independent evidence agrees.
2. Where plate boundaries occur
Plate boundaries are concentrated along mid-ocean ridges, trenches, mountain belts and major fault zones. Around the Pacific Ocean, many boundaries form the broad belt often called the Pacific Ring of Fire. It contains numerous volcanoes and frequent earthquakes because several plates meet and interact around the ocean’s edge. The boundary is not a perfect circle and conditions are not the same at every point.
The Mid-Atlantic Ridge is a long divergent boundary beneath the Atlantic. The North American and Eurasian plates move apart in the north Atlantic; the South American and African plates move apart farther south. Much of the ridge is underwater, where new oceanic crust forms. Iceland sits across the ridge system, so it has volcanic activity related to this divergent setting as well as additional geological influences. The Himalaya is a collision zone where the Indian plate moves towards the Eurasian plate. Earthquakes and mountain-building occur there, but it is not a typical subduction-zone volcano belt.
Most earthquakes occur in zones around plate boundaries because forces there deform and fracture the lithosphere. Volcanoes also cluster at particular types of boundary and at hot spots, but not all plate boundaries have volcanoes. Transform boundaries can produce earthquakes without a chain of volcanoes. Collision zones such as the Himalaya produce major earthquakes and mountains, but little of the familiar subduction-related volcanism. This is why “earthquakes and volcanoes happen at plate boundaries” is a useful first pattern but too general as a complete explanation.
3. Divergent boundaries: plates move apart
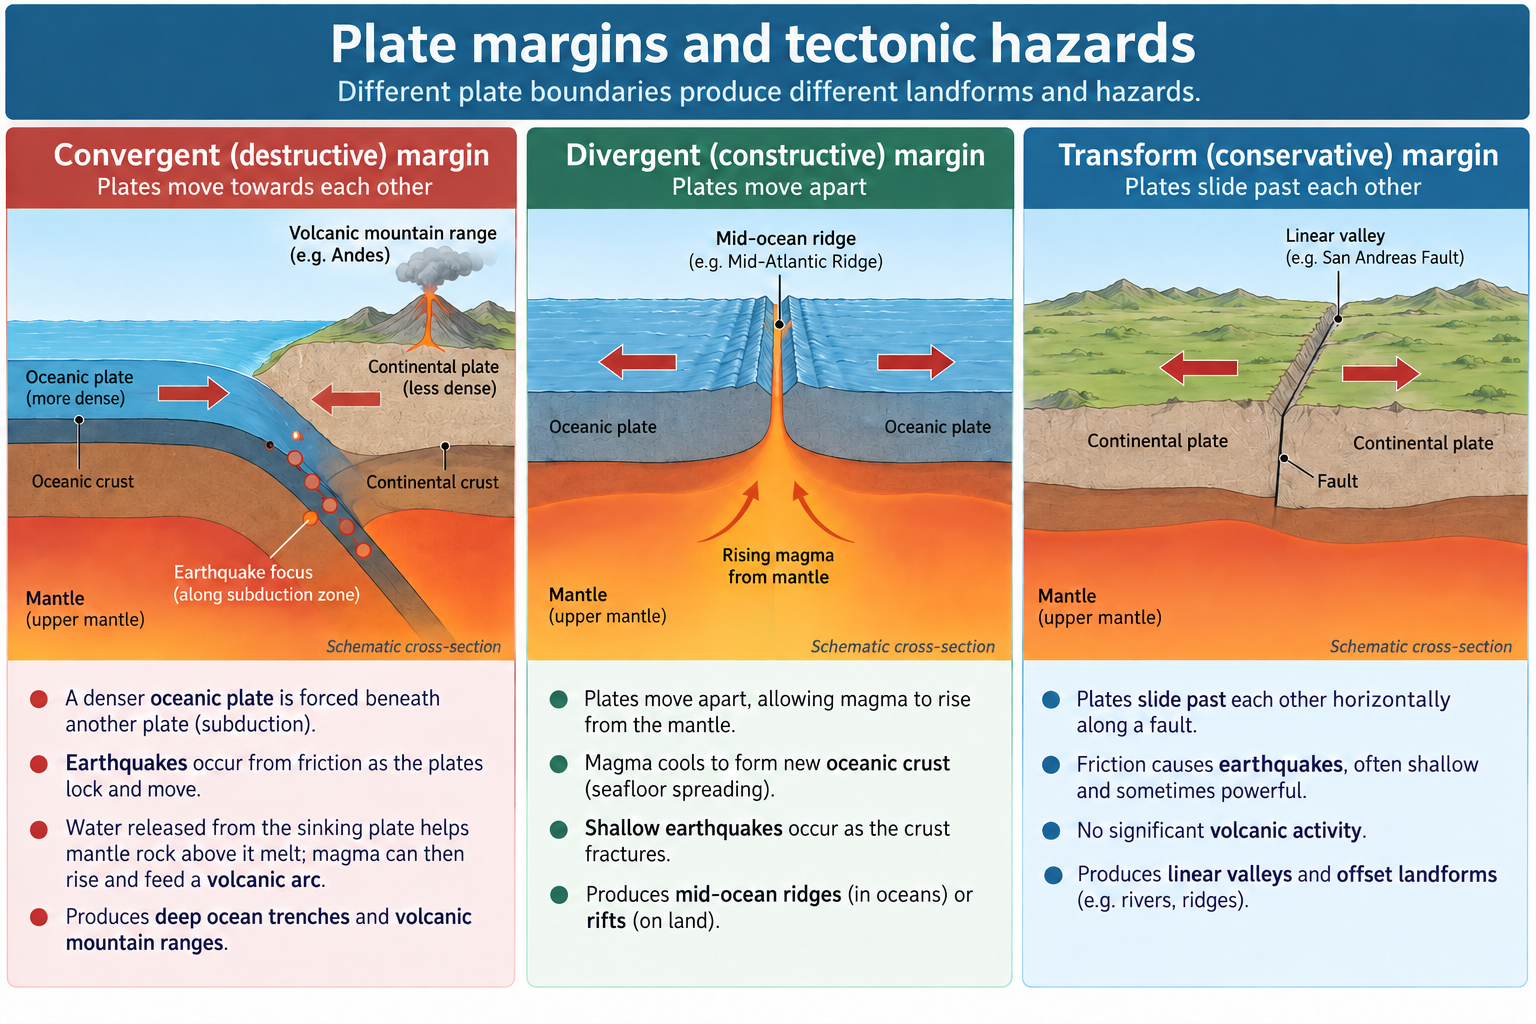
At a divergent boundary, two plates move away from each other. Hot mantle material rises into the space, pressure decreases and some material melts. Magma can enter fractures, erupt as lava or cool below the surface. As it solidifies, it forms new oceanic crust. Repeated movement builds a ridge, and sea-floor spreading carries older crust away from the ridge over time.
Earthquakes at divergent boundaries are usually linked to shallow fault movement and the stretching and cracking of crust. Eruptions may produce relatively runny basaltic lava, although eruption style depends on several factors and can vary. Underwater eruptions commonly occur along ridges, so we do not see all of the activity. On land, fissures—long cracks—may release lava over a wide area rather than building a single steep cone.
Iceland is an example of land located on the Mid-Atlantic Ridge. The island provides visible evidence of processes that are mostly underwater elsewhere. A rift zone can contain fissures, volcanic systems, lava fields and geothermal features. Iceland is not simply a neat gap between two plates; local magma supply and the geological setting influence its volcanic behaviour. When studying a named location, map the boundary and then describe the actual evidence there.
4. Convergent boundaries: plates move towards one another
At a convergent boundary, plates move towards each other. What happens depends on the type and density of the crust involved.
Oceanic plate meets continental plate
Oceanic lithosphere is generally denser than continental lithosphere. Where an oceanic plate converges with a continental plate, the oceanic plate may bend and descend beneath the continental plate. This is subduction. A deep ocean trench can form near the boundary. As the slab descends, water and other materials help conditions that cause melting in the mantle above it. Magma can rise through the overriding plate and form volcanoes. The plate contact and faults can generate shallow, intermediate and deep earthquakes.
The Andes along the western side of South America provide a broad example of an oceanic plate subducting beneath continental South America. The Nazca Plate descends beneath the South American Plate, and the interaction contributes to earthquakes and volcanism as well as uplift. A subduction zone can extend for a very long distance, so an earthquake or volcano far from one city may still be connected to the same boundary system.
Oceanic plate meets oceanic plate
When two oceanic plates converge, one can descend beneath the other. The subduction zone forms a trench, and magma may rise to create a chain of volcanic islands called an island arc. Japan, the Aleutian Islands and parts of Indonesia are associated with complex plate boundaries and subduction systems. The exact arrangement is complicated because several plates or fragments can meet in one region. A simple cross-section teaches the process, but a real map is more complex.
Subduction earthquakes can be very powerful because a large area of the plate boundary may become locked by friction and then slip. If movement suddenly lifts or lowers the sea floor, it can displace water and generate a tsunami. Not every undersea earthquake produces a dangerous tsunami; the amount and type of vertical seafloor movement, depth, magnitude and water conditions matter.
Continental plate meets continental plate
When two continental plates converge, neither is easily pushed deep into the mantle because continental crust is relatively buoyant. The crust can buckle, fold, thicken and be uplifted. This process helps form high mountain belts. The Himalaya and Tibetan Plateau are associated with the continuing convergence of the Indian and Eurasian plates. The collision produces earthquakes but is different from the oceanic-continental subduction process described above.
Mountain building does not happen in a single push. It unfolds over millions of years, while rivers, glaciers, landslides and weathering simultaneously wear the mountains down. The height and shape of a mountain range reflect both tectonic uplift and surface processes. A photograph of a high peak shows a result, not the full balance of building and erosion.
5. Transform boundaries: plates slide past
At a transform boundary, plates move sideways relative to each other. Friction may hold sections of the boundary in place, even while the plates continue to move elsewhere. Stress accumulates in the rocks. When the fault slips, stored elastic energy is released as seismic waves. This produces earthquakes. Crust is not generally created or consumed along the transform fault, which is why the boundary is called conservative in some school texts.
The San Andreas Fault in California is a familiar example of a transform system between the Pacific and North American plates. The fault system contains many strands and smaller faults. Not every earthquake occurs exactly on the most famous mapped trace, and not every section is expected to rupture at the same time. Movement is not a smooth continuous slide at every point; sections may lock, creep slowly or rupture suddenly.
Transform boundaries illustrate why a region can have substantial earthquake risk without many volcanoes. If a diagram shows a volcano at every boundary, it is misleading. A strong explanation links a hazard to the relevant process: sideways fault movement can create earthquakes; subduction can create earthquakes and magma; divergence can create new crust and volcanic activity; continental collision can create uplift and earthquakes.
6. Earthquakes: stress, rupture and shaking
Rocks along a fault can be pushed, pulled or sheared. If friction prevents movement, rock may bend or deform while stress increases. When the stress becomes greater than the frictional resistance, a section can suddenly slip. This sudden rupture releases energy, which travels away from the focus as seismic waves. The elastic-rebound model helps explain why an earthquake can follow a period when a fault was locked and moving slowly elsewhere.
The focus, or hypocentre, is where the rupture begins below ground. The epicentre is the point on the surface directly above it. The strongest shaking is not always at the epicentre: depth, rupture direction, local sediments, buildings and wave behaviour can make other sites shake more strongly or suffer greater damage. A map of epicentres shows where recorded events began; it does not display every place affected.
There are several kinds of seismic wave. Some travel through Earth; others move along the surface. Their motion can shake buildings, crack roads, damage bridges and trigger landslides. Shaking may last seconds or longer depending on event size, distance and ground conditions. Soft, water-saturated sediments can amplify shaking compared with some solid-rock sites, and loose wet sediment may liquefy. Buildings on unstable slopes can be damaged by both shaking and landslides.
Magnitude estimates the size of an earthquake using seismic measurements. Modern catalogues often use moment magnitude, which relates to the physical size of the rupture and slip. Magnitude is logarithmic: a one-unit increase represents about ten times the measured wave amplitude and about thirty times the released energy, as a useful approximation. Intensity describes the shaking and effects at a particular place. One earthquake has one event magnitude estimate but many local intensities. Two sites at equal distance may experience different effects because their ground, buildings and exposure differ.
Aftershocks follow a large earthquake as the crust adjusts. They often become less frequent with time, but some can be strong enough to cause further damage. People returning to damaged buildings may face additional danger. Forecasts can estimate aftershock likelihood over a period, but scientists cannot name the exact time, location and magnitude of every future shock.
7. Volcanoes: magma, gases and eruption style
Magma forms when rock melts partially beneath Earth’s surface. It can rise because it is hot and buoyant, but it may collect in chambers or move through cracks before reaching a vent. Magma composition, temperature, dissolved gases and the surrounding rock influence how it behaves. Magma with more silica is often more viscous; lower-temperature magma can also be more viscous. Gas bubbles may escape more easily from runny magma, while viscous magma can trap gas and allow pressure to build. This is a useful pattern, not a promise that every eruption follows the same script.
Runny basaltic lava can flow over long distances and build broad shield volcanoes or lava plains. More viscous magma may produce thicker lava domes and explosive eruptions when trapped gases expand or when magma fragments violently. Composite volcanoes may be built from alternating lava flows and layers of ash and other fragments. Volcano shape alone does not predict the next eruption; scientists monitor changes in earthquake activity, ground deformation, gas, temperature and other signals.
Volcanic hazards differ. Lava can burn or bury buildings, roads, farms and utilities, but it often moves slowly enough in some settings for people to evacuate from its path. Ash consists of fine fragments that can reduce visibility, affect breathing, damage machinery and disrupt aircraft. Ashfall can make roofs heavy when wet and contaminate water supplies. Pyroclastic flows are fast, hot currents of gas, ash and fragments; they are extremely dangerous and can travel down valleys. Lahars are flows of water and volcanic debris that may move far from a volcano, sometimes after an eruption when rain mixes with ash. Volcanic gases can harm people and animals or affect nearby ecosystems.
The hazards and affected area depend on volcano type, eruption size, wind, topography, water and settlement. Ash can travel far with the wind. Lava and pyroclastic flows tend to follow slopes and valleys. Lahars can travel down river channels. A map of hazard zones should therefore be interpreted alongside the source volcano, topography, wind patterns and settlement locations.
8. Tsunamis: waves caused by displaced water
A tsunami can begin when an undersea earthquake suddenly moves a large part of the sea floor vertically, displacing the water above it. Submarine landslides and volcanic processes can also displace water. The waves may travel rapidly across deep ocean with a long wavelength and relatively small height offshore. As they enter shallow water, they slow, their wavelength shortens and their height may increase. A tsunami is not a single ordinary wind wave, and it may arrive as several surges separated by time.
The first wave is not always the largest. Strong or long-lasting shaking near a coast can be a natural warning. In areas with tsunami education, people are taught to move quickly to higher ground or inland rather than waiting to see the sea change. Warning systems use earthquake and sea-level observations, but a warning cannot remove all uncertainty. Coastlines, bays, estuaries, islands, roads, elevation and public communication affect what people can do.
Tsunami impacts may include drowning, injury, building collapse, damaged ports and transport, contamination of drinking water, saltwater intrusion and disruption to livelihoods. The waves can carry debris and undermine foundations. Recovery may take a long time, especially where homes, businesses, hospitals or roads are destroyed. Mapping coastal elevation and evacuation routes helps communities understand their options before an event.
9. From physical hazard to human disaster
An earthquake or eruption is a physical event. A disaster occurs when the event causes severe disruption and losses for a community that cannot cope with the impacts using its available resources. A magnitude figure alone cannot tell how many people will be harmed. A remote earthquake can have a high magnitude and few direct casualties; a smaller earthquake under a crowded city with weak buildings can be devastating.
Risk depends on the hazard, exposure and vulnerability, as well as capacity to prepare and respond. A useful conceptual question is: “What event might occur, who or what is in its path, how susceptible are they, and what resources can reduce harm?” Some textbooks present risk as a multiplication of hazard, exposure and vulnerability. Treat such an equation as a model: the variables require clear definitions and the numbers are not always measurable or directly comparable.
Factors that can influence impacts include:
- Magnitude, depth and duration: Larger or shallower earthquakes often create stronger shaking near the source, but local conditions still matter.
- Distance and direction: Shaking usually changes with distance, though rupture direction and geology can create uneven patterns.
- Population and land use: More people and infrastructure in the affected area can increase exposure; time of day may change who is present.
- Building design: Reinforced structures, flexible connections and secure foundations can reduce collapse. Poorly constructed buildings may be more vulnerable.
- Ground conditions: Soft sediments, steep slopes and liquefaction-prone areas can intensify certain impacts.
- Preparedness and communication: Drills, hazard maps, public knowledge, reliable warnings and clear evacuation routes can save lives.
- Income and public services: Resources affect access to stronger housing, hospitals, emergency teams, insurance and reconstruction. These resources are unequally distributed within countries as well as between them.
- Governance and trust: Land-use planning, building regulations, enforcement, emergency coordination and public trust influence how warnings and recovery work.
- Accessibility: Damaged roads, bridges, ports, airports or communication networks can slow rescue, supplies and medical care.
- Secondary hazards: Landslides, fires, damaged dams, tsunamis, ash and disease may create additional problems after the first event.
Impacts are often grouped as social, economic and environmental, but the categories overlap. A damaged hospital is an economic cost and a social problem because health services are reduced. Ash can harm crops, while volcanic soils may support agriculture in the longer term. An eruption may interrupt tourism and transport but also create new landforms and geothermal opportunities. Describe the timescale and who experiences each effect.
10. Monitoring, prediction, preparation and response
Earthquakes cannot currently be predicted with exact date, time and location. Scientists can identify areas where earthquakes are more likely over a long period, map faults, estimate ground shaking and monitor changing activity. Seismometers record ground motion. Satellite positioning can measure slow ground movement. Historical records and geological evidence show past ruptures and possible recurrence patterns. None gives a clock that says precisely when the next earthquake will happen.
Volcano monitoring may provide useful warning when activity changes. Instruments can measure small earthquakes, ground swelling, gas emissions, heat and changes in crater lakes. Scientists combine signals and compare them with the volcano’s past behaviour. Some eruptions are preceded by detectable changes; others may occur with little warning. An alert level communicates current concern and recommended actions; it is not a guaranteed countdown.
Preparation can reduce vulnerability. Building codes set requirements for structures in earthquake-prone areas. Retrofitting can strengthen older buildings, schools and bridges. Land-use planning can avoid placing critical facilities in areas with high hazard where alternatives exist. Public education can teach people to protect themselves during shaking and follow evacuation routes after an event. Families, schools and services can practise emergency plans and prepare supplies.
Volcanic hazard maps identify possible lava, ash, lahar or pyroclastic-flow zones. Monitoring teams issue alerts; authorities may close areas, evacuate settlements and direct people to shelters. At coasts, tsunami warning networks, evacuation signs, high-ground routes, sirens and public drills can improve response. These measures need regular maintenance, clear communication and access for people with different mobility and language needs.
During response, emergency services search for survivors, provide medical care, distribute water and food, restore communications and reopen safe routes. Neighbours and local organisations often respond before outside teams arrive. Short-term emergency relief and long-term recovery are different phases. Rebuilding can reduce future risk if new structures are safer and land use changes where necessary. It can also reproduce vulnerability if poorer groups are excluded from safer homes or if people must rebuild in the same exposed location.
Risk reduction cannot remove all risk. Stronger buildings cost money; evacuation can disrupt livelihoods; relocating a community can damage cultural ties and access to land. A decision should compare who benefits, who pays, whether the measure is affordable and how it affects people with fewer choices. Preparedness is most effective when it is planned with communities and linked to local knowledge.
11. Tectonic hazards in the United Kingdom
The UK is far from the nearest active plate boundary, the Mid-Atlantic Ridge, but it still experiences earthquakes. The British Geological Survey explains that stress within the plate can be released on older fault planes. BGS detects many small earthquakes that people do not feel, and a smaller number that are noticed. Most UK earthquakes are minor, but local shaking can still damage buildings in particular circumstances.
This example demonstrates that “far from a plate boundary” does not mean “no earthquakes”. An old fault may be reactivated by regional stress; post-glacial uplift may also contribute to stresses in some areas. The precise driving forces for UK earthquakes are not fully understood. Monitoring and hazard assessment therefore matter even where the expected hazard is lower than in an active boundary zone.
UK volcanoes are extinct or very old; there are no active volcanoes in the UK today. However, volcanic rocks such as basalt and ancient volcanic landforms remain part of the landscape. The Giant’s Causeway records past volcanic processes, not a present volcanic hazard. This distinction between geological evidence and current risk is important when reading maps or photographs.
12. Evidence that plates move
Plate tectonics is supported by several independent observations. The continents on either side of the Atlantic have shapes that can be fitted together approximately, especially when comparing continental shelves rather than modern shorelines. Matching rock formations, mountain belts and fossils occur on continents now separated by an ocean. This evidence suggests that land areas were once connected, although it does not by itself measure their movement today.
Evidence from the ocean floor provides a clearer process sequence. Mid-ocean ridges are places where new crust forms. Magnetic minerals in cooling lava align with Earth’s magnetic field at the time they solidify. Because Earth’s magnetic field has reversed many times, bands of ocean-floor rock on both sides of some ridges preserve alternating magnetic directions. Their broadly symmetrical pattern supports sea-floor spreading. Rock samples are generally younger near the ridge and older farther away, which provides a second line of evidence.
Today, satellite positioning and other geodetic methods measure how locations shift over time. A single year of movement may be too small to notice without instruments, but observations over several years can reveal the direction and approximate speed of a plate. Scientists compare multiple stations and correct for measurement uncertainty. This is why a map with arrows is a model based on measurements, not simply a drawing made from the direction of one earthquake.
You can use an idealised calculation to understand why slow motion matters. If two points move apart at a steady four centimetres per year for one million years, the simple multiplication gives 40 kilometres of separation. This is not a prediction for a real plate segment: rates can change, boundaries may migrate, and movement is not uniform across every point. The calculation shows how small annual distances can become large over geological time.
13. Recurrence, forecasts and uncertainty
Earthquakes do not happen at perfectly regular intervals like a school bell. A fault section may store strain for a long time, release some of it in one rupture and then adjust through aftershocks or slow movement. Historical earthquake catalogues can be incomplete because instruments have not always existed and older written accounts describe shaking differently. Geological evidence can extend the record, but dating deposits and linking them to one particular fault can involve uncertainty.
Scientists can estimate the probability of earthquake shaking over a stated time period and region. Such a forecast may guide building codes or infrastructure design. It does not identify the exact hour an earthquake will occur. A fault that has not produced a recorded earthquake recently is not necessarily safe; the record may be short, the fault may move slowly, or evidence may be missing. A recent earthquake also does not prove that another large earthquake will happen immediately, although aftershock probabilities may be elevated following a major event.
Volcano forecasting uses changing signals rather than a fixed timetable. More small earthquakes, ground swelling or changes in gas may indicate magma movement. These signs are interpreted together, because any one may have other explanations and not every change leads to an eruption. Scientists communicate alert levels and likely hazards so authorities can make decisions under uncertainty. Evacuation decisions balance the possibility of an eruption against disruption, safety and the time needed to move people.
14. Choosing measures for a place
Consider a coastal settlement near a subduction zone. No single action protects everyone from every hazard. Building codes can reduce collapse during shaking, but they do not stop a tsunami. A seawall may reduce damage from some waves but can be overtopped and may affect beaches or coastal ecosystems. Warning systems provide time to evacuate, but only if sensors, communication, routes and public understanding work. Elevated shelters or designated high ground can provide alternatives where roads are congested or people cannot travel far.
A complete plan combines measures. Hazard maps can guide land use and show potential tsunami zones. Schools can practise “drop, cover and hold on” for shaking and evacuation for tsunami risk. Hospitals, power stations and communications facilities need continuity plans. Signage should be understandable to residents and visitors, and routes need to account for people with mobility needs. Drills can reveal bottlenecks that are not obvious on a map.
Evaluate each measure by asking: What hazard does it reduce? Who benefits? Who may not be able to use it? How reliable is it during a power or network failure? What will it cost to build and maintain? Could it shift risk to a neighbouring place? What evidence would show that the measure works? These questions make risk management geographical: they connect a physical process to location, population, infrastructure and decision-making.
For example, compare a warning siren with earthquake-resistant housing. The siren may give people time to move away from a tsunami but does little to protect them from buildings collapsing during the initial shaking. Stronger housing can reduce earthquake deaths but will not keep people safe from a large wave that inundates the coast. Combining measures can address different parts of the hazard pathway. The priorities should reflect local hazard maps and the needs of people who live there, not a generic checklist alone.
Place example
The following event comparisons are illustrative examples. Schools may select different case studies. The examples help show how tectonic processes interact with location, exposure, vulnerability and response; they do not imply that one country is uniformly safe or unsafe.
Nepal, 25 April 2015: a large earthquake in a mountainous region
On 25 April 2015, a magnitude 7.8 earthquake struck Nepal. The rupture occurred on the boundary where the Indian plate converges with the Eurasian plate. The earthquake began northwest of Kathmandu and was followed by many aftershocks, including a magnitude 7.3 event on 12 May. This setting is part of the active collision zone that has built the Himalaya. The event shows that continental collision can generate major earthquakes even where a simple model might lead pupils to expect only mountains.
The shaking caused widespread impacts across Nepal and was felt in neighbouring countries. USGS summaries report around 9,000 fatalities and about 23,000 injuries in Nepal, with hundreds of thousands of homes destroyed or damaged. Landslides occurred on steep mountain slopes; they blocked roads and affected settlements. The earthquake and landslides damaged infrastructure, including hydroelectric facilities. These figures are drawn from post-event reports and may differ slightly among sources because agencies update totals and use different reporting definitions.
Several physical and human factors influenced the impacts. Kathmandu is a densely settled valley that contains sediment deposited from surrounding uplands; local ground conditions can amplify shaking. Many homes were not adequately reinforced. In rural mountain districts, steep relief made roads and rescue access difficult, while landslides created additional barriers. The timing and distribution of the shaking exposed people in homes and public places. These factors interacted: difficult access mattered more where roads were blocked and services were damaged.
After the event, local residents, Nepalese services, neighbouring countries and international organisations provided search, rescue, shelter, food and medical support. Earthquake monitoring and aftershock information helped explain ongoing hazards. Longer-term recovery involved rebuilding homes, schools, heritage buildings, roads and services. A reconstruction programme has to consider earthquake-resistant design, local building knowledge, costs and people’s access to safe housing. Stronger building rules can reduce future risk only when people can afford compliant materials and when construction is inspected and supported.
This is a useful case for linking a plate-boundary process to secondary hazards and vulnerability. The event was not damaging only because the magnitude was large. Local geology, building strength, settlement, slope hazards, transport and resources all affected consequences. When citing this event, include the date, magnitude, location, one primary hazard, one secondary hazard and a sourced impact. Avoid using one total without saying whether it counts deaths, missing people, homes or economic loss.
Japan, 11 March 2011: earthquake and tsunami on a subduction zone
On 11 March 2011, the Great East Japan, or Tohoku, earthquake occurred offshore of northern Honshu. The USGS event catalogue gives a magnitude of 9.1 and locates the earthquake at a subduction zone where the Pacific Plate moves beneath the plate carrying northern Japan. The rupture displaced the sea floor and generated a destructive tsunami. The earthquake was extremely large, but the tsunami caused much of the devastation along the coast.
The tsunami inundated coastal settlements, ports and low-lying plains. USGS impact information records many thousands of people killed or missing and extensive damage to buildings, roads, bridges and railways. The waves travelled far inland in some locations and carried debris. Damage to critical infrastructure created cascading effects. The event also led to a serious nuclear emergency at the Fukushima Daiichi power station after tsunami flooding disabled important systems. This illustrates how a natural hazard can trigger a technological disaster when a critical facility is exposed and protective systems fail.
Japan had earthquake monitoring, building standards, drills and tsunami warning arrangements. These reduced some risks and many people received warnings, yet they could not prevent all losses. The tsunami exceeded the design assumptions or protection levels at some locations; people had differing amounts of time and different routes to reach safety. Some communities were distant from high ground. Older people, children and people with disabilities can face additional barriers during evacuation. A warning system helps only if information reaches people clearly and they can act on it.
Recovery included search and rescue, temporary housing, debris removal, rebuilding infrastructure and decisions about where homes and services should return. Coastal defences and land-use plans were reviewed. Raising defences may reduce risk from some waves but can be costly and may not be enough for every event. Evacuation, vertical shelters, land-use planning and education can complement engineering. The best mix depends on local topography, population, livelihoods, cost and community priorities.
Japan and Nepal can be compared carefully. Both events involved major earthquakes and damaging aftershocks or secondary hazards. Nepal’s impacts included mountain landslides and difficult overland access; Japan’s offshore rupture generated a major tsunami that affected an extensive coast. The countries differ in tectonic setting, wealth, population distribution, building systems, terrain, warning time and event type. A comparison should use the same categories and dates, not a simple claim that one place “handled it better.”
Compare event evidence without turning a place into a stereotype
Use a table with consistent headings—hazard, location, date, magnitude or eruption style, exposure, vulnerability, impacts, response and recovery. Separate the physical event from the social context. Then identify one similarity, such as both earthquakes occurring on active plate boundaries, and one difference, such as whether the earthquake was inland or offshore. Explain how those differences influenced the secondary hazards.
Disaster statistics are not perfectly comparable. A death total may exclude missing people, indirect deaths or later fatalities. An economic-loss estimate can use different currencies, years or accounting methods. A displaced-person total can count people in temporary shelters or households that moved elsewhere. Always name the source and its date. For a KS3 response, accurate broad evidence and clear explanation are more useful than several unsourced precise numbers.
Maps, data and evidence
Map plate movement and hazard distribution
Begin with the map title and legend. Identify plate names and boundary symbols, then compare earthquake dots and volcano symbols with the lines. Look for clusters along the Pacific margins, mid-ocean ridges, the Andes and the Himalaya. Describe the pattern in spatial language: “many recorded earthquakes follow the western edge of South America”; “a belt of volcanoes lies near some subduction zones”; “the Himalaya has earthquakes but no continuous arc of active volcanoes of the same type as the Andes.”
Do not assume each dot represents the same magnitude. A map may omit small earthquakes because of its scale or data threshold. The number of mapped events also depends on monitoring networks and the time period. An apparent empty region might have fewer recorded earthquakes, fewer stations or both. Check the map date, event threshold, projection and source.
Read a boundary cross-section
Use arrows to show relative motion. At a divergent boundary, the arrows point away and magma may rise between them. At an oceanic-continental convergent boundary, arrows point towards each other and the denser oceanic plate descends beneath continental lithosphere; show a trench, earthquake foci and possible magma rise. At a transform boundary, arrows point in opposite directions parallel to the fault. At a continental collision zone, show crust thickening and folding rather than drawing one continent plunging neatly into the mantle.
Label what is certain and what is simplified. A diagram can show the broad process, but it is not to scale. Plates are not floating loose on liquid magma. Volcanoes do not appear at every boundary. Earthquake foci can occur at different depths in subduction zones, while most transform earthquakes are relatively shallow. Use an inset map to connect the cross-section to a real location.
Read earthquake evidence
For an earthquake data table, identify magnitude, depth, date, location and the type of impact data. A larger magnitude usually means a larger source event, but it does not on its own tell how severe the impacts will be at a particular place. Add distance to the epicentre, local ground, building types and exposure before explaining damage.
An earthquake-intensity map often uses coloured zones to show reported or modelled shaking effects. Read its key, scale and data source. Intensity zones may be irregular because geology, rupture direction and buildings vary. A contour line on such a map is not necessarily a sharp boundary where damage changes instantly. It represents a generalised pattern.
If comparing death tolls, identify the event period and whether the figure includes people missing or later deaths. If comparing economic loss, use the same currency and price basis where possible. A large total may partly reflect the value of exposed infrastructure rather than a greater level of suffering. Pair economic evidence with social and environmental indicators.
Use a hazard profile and risk pathway
For one location, organise a hazard pathway: plate movement → fault stress or magma movement → earthquake or eruption → primary hazard → secondary hazard → exposure → impact. For example: plate subduction builds stress; a fault ruptures beneath the sea; vertical sea-floor movement displaces water; tsunami waves reach a low-lying coast; homes and people are exposed; impacts depend on warnings, evacuation routes and building location.
Draw arrows between the stages and write evidence beside each link. Use “can” or “may” where an outcome is possible but not guaranteed. A subduction earthquake can generate a tsunami, but only if seafloor or water movement is sufficient. A volcano can produce ash, but wind direction influences which places receive the heaviest ashfall.
Strengths and limits of evidence
Seismometers give accurate records of ground motion at their locations but are not evenly distributed worldwide. Satellite measurements can detect slow movement across plate boundaries, but the data need interpretation. Historical accounts extend records before instruments existed but may use descriptions rather than modern measurements. Geological evidence such as tsunami deposits can preserve traces of past events, although dating and interpretation have uncertainty.
Photographs help identify visible damage, landslides or ash but show only a particular place and time. News images may focus on the most dramatic locations. A complete study uses maps, scientific measurements, official reports, local accounts and data across multiple sites. Always ask who collected the evidence, when, where and for what purpose.
Common misconception
- “The mantle is a sea of liquid magma.” Most mantle material is solid, although it can deform and flow slowly over geological timescales.
- “Continents move independently through the oceans.” Continents are carried as part of tectonic plates that include crust and upper mantle lithosphere.
- “All plate motion is caused only by convection.” Mantle flow contributes, and forces such as slab pull and ridge push also matter.
- “Every plate boundary has volcanoes.” Transform boundaries and continental collision zones can have earthquakes without a typical volcanic arc.
- “All convergent boundaries work the same way.” Oceanic-continental subduction, oceanic-oceanic subduction and continental collision have different processes and landforms.
- “Earthquakes happen only at plate boundaries.” Many occur there, but stress can also reactivate faults within plates, including in the UK.
- “The epicentre is where the earthquake begins underground.” The focus is underground; the epicentre is the point above it at the surface.
- “Magnitude tells the damage everywhere.” Magnitude describes the event; local shaking, ground, buildings and exposure influence impacts.
- “Every undersea earthquake creates a tsunami.” A tsunami requires significant water displacement; many submarine earthquakes do not produce a damaging tsunami.
- “A tsunami is one large ordinary wave.” It is a series of long waves, and later waves can be larger than the first.
- “Volcanoes erupt only in one predictable way.” Eruption style and hazards vary with magma, gas, water, topography and other conditions.
- “Scientists can predict the exact date of an earthquake.” Scientists assess long-term hazard and monitor activity but cannot precisely predict every event.
- “A natural hazard always becomes a disaster.” Impacts depend on exposure, vulnerability, preparation, response and the event itself.
- “A wealthy country cannot suffer a disaster.” Wealth and technology can reduce some risks but cannot remove exposure or prevent every failure.
- “People in a low-income country are all equally vulnerable.” Vulnerability varies within countries according to housing, location, age, health, wealth and access to services.
Self-check
Recall
- What makes up the lithosphere?
- What is a tectonic plate?
- Name the three main types of plate boundary.
- What is subduction?
- What process can create new oceanic crust at a divergent boundary?
- What is the difference between the focus and epicentre?
- What is the difference between earthquake magnitude and intensity?
- Name two primary earthquake hazards and two secondary hazards.
- What factors can influence magma viscosity?
- Name three hazards produced by a volcano.
- How can an undersea earthquake generate a tsunami?
- Why can earthquakes occur in the UK even though the UK is far from the nearest active plate boundary?
Explain
- Explain how stress builds and is released along a fault.
- Why can subduction create both earthquakes and volcanoes?
- Explain why continental collision can create a high mountain range without a typical subduction-volcano chain.
- How can viscous magma contribute to an explosive eruption?
- Explain how a tsunami changes as it approaches shallow water.
- Give two reasons why soft sediment may increase earthquake damage.
- Why does a tsunami warning system not guarantee that everyone reaches safety?
- Explain how monitoring can help with a volcanic eruption but cannot remove all uncertainty.
Apply
- A map shows a band of earthquakes beside a deep ocean trench and a line of volcanoes inland. Identify a likely boundary type and explain how the features are connected.
- Another map shows many earthquakes along a long fault but few nearby volcanoes. Suggest a boundary type and justify your answer.
- Two earthquakes have magnitudes 6.0 and 7.0. What is the approximate difference in wave amplitude and released energy? Why can the smaller event still cause severe local damage?
- A shallow magnitude 6 earthquake occurs beneath a dense city on soft, water-saturated sediment. Name three possible impacts and explain how location and ground conditions contribute.
- A volcano monitoring team detects more small earthquakes and ground swelling. What might these signals mean? Why would the team use more evidence before recommending evacuation?
- A coastal community experiences long, strong shaking from an offshore earthquake. What should people do if they have been taught to recognise natural tsunami warnings, and why should they not wait at the shore?
- Compare one factor that reduced risk and one factor that increased risk in either the Nepal 2015 or Japan 2011 example.
- A learner concludes that Japan had fewer impacts than Nepal because it was wealthier. Give two reasons this conclusion is too simple and identify two kinds of evidence that would improve the comparison.
- Build a hazard pathway for a volcanic eruption that produces ashfall in a town downwind. Include at least two links between physical processes and human impacts.
- Design a school earthquake-preparedness plan. Name three practical actions and explain who should be involved in planning them.
- Create a five-row comparison table for the Nepal 2015 and Japan 2011 earthquakes. Use the headings plate setting, primary hazard, secondary hazard, one exposure or vulnerability factor, and one risk-reduction measure. Mark any information you still need to research.
- A news report says an earthquake was magnitude 7.2 and another was magnitude 6.2. A learner says the first was “one unit stronger, so it caused exactly ten times the damage.” Identify the accurate part of the claim and explain what evidence is needed before comparing damage.
Suggested answers and reasoning
- The crust and rigid uppermost mantle.
- A large moving piece of lithosphere.
- Divergent, convergent and transform.
- One plate descends beneath another at a convergent boundary.
- Magma rises into the gap, cools and solidifies, adding new crust as plates move apart.
- The focus is where rupture begins underground; the epicentre is directly above it at the surface.
- Magnitude estimates the size of the earthquake source; intensity describes shaking and observed effects at a particular site.
- Primary: ground shaking or surface rupture. Secondary: landslides, liquefaction, fire or a tsunami; identify that a tsunami occurs only in suitable settings.
- Composition, silica content, temperature, gas and the surrounding conditions.
- Examples include lava, ashfall, pyroclastic flows, lahars and volcanic gases.
- Sudden vertical movement of the sea floor displaces water and sends waves across the ocean; an undersea landslide can also displace water.
- Stress can be released along pre-existing faults inside the plate; the BGS also notes possible contributions from regional stress and post-glacial uplift.
- Plate movement pushes or shears rocks; friction may lock a fault while rocks deform; when the fault slips, stored energy travels away as seismic waves.
- A descending slab and processes above it can contribute to melting and magma rise; locked plate contact and faults can also rupture and release earthquakes.
- Continental crust is buoyant and resists subduction, so it can crumple, thicken and rise, forming mountains; the setting does not create the same typical subduction-related magma source.
- Viscous magma can trap gases; pressure can build until gas and magma escape explosively. Other variables also affect eruption style.
- In deep water the wave travels rapidly with a long wavelength; in shallow water it slows, shortens in wavelength and can grow in height.
- Soft sediment may amplify shaking; loose saturated material may liquefy and undermine foundations. Local results depend on sediment and building design.
- People may be far from safe routes, receive a warning late, have mobility needs, distrust a message, lack a vehicle, or be unable to leave because roads are damaged. Good planning must account for these barriers.
- Monitoring may detect changes in seismicity, ground shape, gas or heat that signal rising activity. Signals can be ambiguous, and eruptions may occur without clear warning, so teams combine data and communicate uncertainty.
- Oceanic-continental or oceanic-oceanic subduction is likely. The oceanic plate descends at the trench; earthquakes occur along the contact and within the slab, while melting above the slab can feed inland volcanoes.
- A transform boundary is plausible because sideways movement along a fault produces earthquakes without typically creating a volcanic arc. Check the arrows, map location and geological setting.
- The magnitude 7 event has about ten times the measured wave amplitude and roughly thirty times the released energy as a useful approximation. A magnitude 6 event can still be shallow, close to a settlement, amplified by sediment or affect vulnerable buildings.
- Building collapse, service disruption and liquefaction-related damage are possible. A shallow source can produce strong nearby shaking; dense exposure means many people and buildings may be affected; saturated sediment can amplify shaking or lose strength.
- The volcano may be becoming more active, with magma or fluids moving beneath it. The team needs additional seismic, gas, deformation, temperature and historical evidence because signals do not provide a guaranteed eruption time or size.
- Move to higher ground or inland along the planned route immediately. Strong or long shaking can be a natural warning; dangerous waves may arrive before a warning message, and later waves may be larger.
- For Nepal, preparedness, local response or international support may have reduced some risks, while weakly reinforced homes and landslides increased risk. For Japan, building rules and warnings reduced some risks, while extensive low-lying coastal exposure and tsunami height increased risk. Support the choice with sourced evidence.
- Event type, terrain, location, exposure and secondary hazards differed; wealth does not eliminate risk and impacts were not limited to one category. Compare casualty definitions, building performance, warning coverage, terrain, displacement and infrastructure impacts using consistent sources.
- Example: eruption sends ash into the atmosphere; wind transports it towards the town; ash falls onto roofs, roads or water; wet ash can increase roof load, reduce visibility and disrupt travel; warnings and shelter may reduce exposure.
- Possible actions include securing heavy objects, practising “drop, cover and hold on”, identifying safe assembly points and communication methods, checking emergency supplies, and learning evacuation routes. Include students, staff, facilities teams, families, local emergency services and people with access needs.
- Nepal: continental collision; strong ground shaking; landslides; steep slopes and vulnerable housing; stronger construction and safer access planning. Japan: subduction; offshore ground shaking; tsunami; low-lying coastal exposure and critical infrastructure; warnings, evacuation routes and vertical shelters. Check each claim against event sources, and mark any detail that needs local evidence. This is a framework, not a completed statistic table.
- One magnitude unit corresponds approximately to ten times the measured wave amplitude and roughly thirty times the released energy, not ten times the damage. Damage depends on depth, distance, ground, buildings, exposure, event duration and secondary hazards. Compare intensity maps, affected populations, building impacts and consistent casualty definitions.
Revision points
- Draw and explain each boundary with arrows, crust type and the correct hazards; avoid putting a volcano at every boundary.
- Use the sequence stress → fault rupture → seismic waves → local shaking → primary or secondary impact.
- Distinguish event magnitude from local intensity, and hazard from disaster.
- For volcanoes, connect magma properties to movement, eruption style and hazard; state where wind and relief affect impacts.
- Explain tsunami formation only when significant water displacement occurs, and remember that the first wave may not be the largest.
- Compare places by linking physical processes to exposure, vulnerability, preparation and response rather than ranking countries by wealth.
- Use dated, named evidence. State units and definitions when quoting magnitude, casualties or damage.
- Monitoring improves decisions, but it does not remove uncertainty or replace preparedness.
Curriculum alignment
- Curriculum coverage IDs:
ks3.physical.plate-tectonics - Related practice packs:
ks3_geography_tectonics_1 - Shared concept tags:
tectonics,earthquakes,volcanoes,hazards
Sources
- Curriculum/specification: Department for Education: National curriculum in England — Geography programmes of study
- Plate motion and boundaries: U.S. Geological Survey: Understanding plate motions
- Plate structure and earthquakes: British Geological Survey: What causes earthquakes?
- Earthquakes within the UK: British Geological Survey: Where do earthquakes occur?
- Nepal 2015 event and impacts: U.S. Geological Survey: M7.8 Nepal Earthquake, 2015
- Nepal response and recovery context: U.S. Geological Survey: One year after the M7.8 Nepal earthquake
- Japan 2011 earthquake and impact: U.S. Geological Survey: M9.1 Great Tohoku Earthquake, Japan
- Tsunami process and deposits: U.S. Geological Survey: Tsunami deposits in Japan
- Use the stated event date and magnitude source. Impact totals may differ according to reporting date and definitions; use consistent, dated figures when comparing events.