 FoxChild@Learn
7. Hydrology, the water cycle and water resources
Curriculum status: Required core content.
This guide follows the England Key Stage 3 Geography programme of study. It explains how water moves between stores at global and local scales, how a drainage basin routes water, why places differ in water availability, and how water use and management affect people and ecosystems. The England water-planning example is used to practise interpretation, not as a required school case study.
How to use this chapter
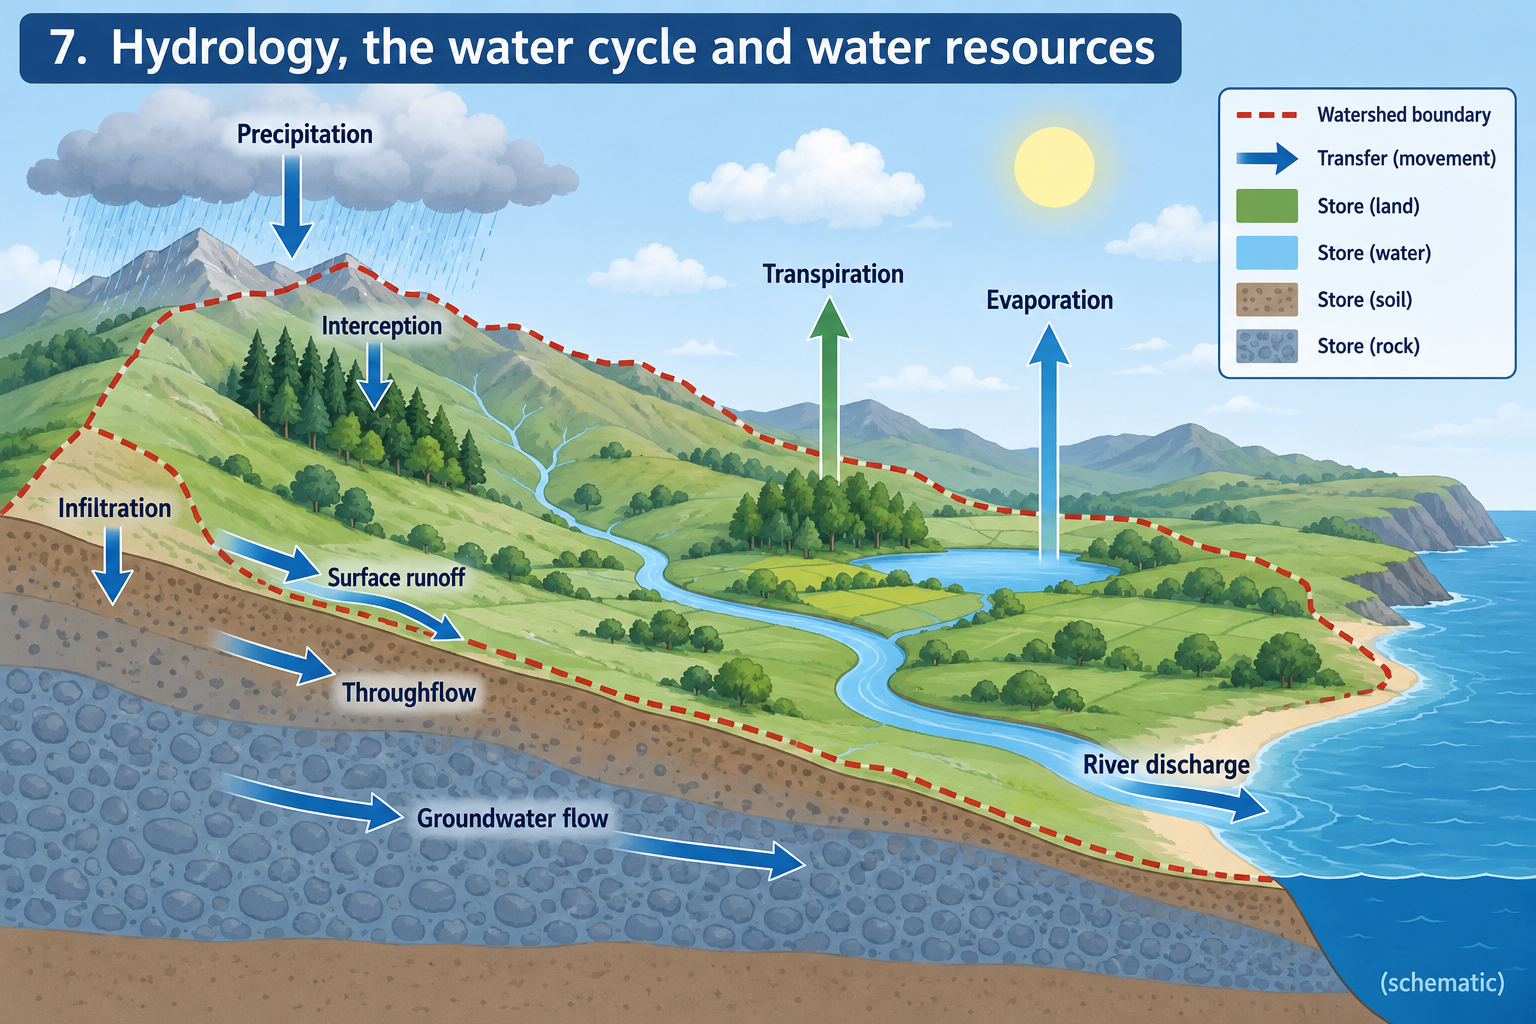
Hydrology is the study of water: where it is stored, how it moves, how much is available and how it interacts with land, climate, living things and people. The water cycle connects ocean, atmosphere, land, ice, soil, groundwater, rivers, lakes, plants and people. At a smaller scale, a drainage basin gathers water from a land area and routes it toward a stream or river.
A useful way to reason about water is to trace a drop through the system. It could evaporate from the sea, condense in a cloud, fall as rain or snow, be caught by vegetation, infiltrate soil, move through rock, feed a spring, enter a stream, be taken up by a plant, be stored in a reservoir or be used in a home. It may pass through several stores before returning to the atmosphere or ocean. The path is not identical everywhere, and the time spent in each store can range from hours to thousands of years.
Keep the difference between a store and a transfer clear. A store is where water is held for a time. A transfer is the movement of water between stores. Evaporation is a transfer from surface water to atmosphere; a lake is a store. Confusing stores and transfers makes water-cycle diagrams difficult to interpret.
Required knowledge
You should be able to:
- Describe stores and transfers in the water cycle at global and drainage-basin scales.
- Explain how climate, geology, relief, vegetation, soil and land use affect runoff, infiltration and river flow.
- Explain why freshwater availability, access and demand vary between places and through time.
- Distinguish physical water shortage from water-access problems related to infrastructure, quality, affordability or management.
- Compare ways of managing water supply and demand, including benefits, costs, limits and environmental effects.
- Read a drainage-basin sketch, water-budget table, rainfall or discharge graph, water-stress map and simple water-planning chart.
- Explain why a renewable water cycle does not guarantee unlimited accessible clean freshwater.
- Use a place example carefully, separating observed information from a forecast or illustrative scenario.
- Consider the needs of households, farming, industry, ecosystems and future generations.
Key vocabulary
| Term | Meaning |
|---|---|
| Hydrology | The study of water, its movement, storage and interaction with people and the environment. |
| Water cycle, hydrological cycle | Continuous movement of water between land, sea, atmosphere, ice, soil, rock, living things and human systems. |
| Store | A place or part of the system where water is held for a period of time. |
| Transfer, flux | Movement of water from one store to another. |
| Evaporation | Liquid water changing to water vapour. |
| Transpiration | Water vapour released from plants, mainly through leaves. |
| Evapotranspiration | Combined transfer of water to the atmosphere through evaporation and transpiration. |
| Condensation | Water vapour cooling and changing to liquid droplets or ice crystals. |
| Precipitation | Water falling from the atmosphere as rain, snow, sleet or hail. |
| Interception | Precipitation caught by vegetation or structures before reaching the ground. |
| Infiltration | Water entering the soil from the ground surface. |
| Percolation | Water moving down through soil and permeable rock. |
| Throughflow | Water moving sideways through soil toward a stream or slope base. |
| Groundwater | Water held and moving beneath the ground in pores and cracks. |
| Aquifer | Permeable rock or sediment that can store and transmit groundwater. |
| Recharge | Water entering an aquifer, often after infiltrating from the surface. |
| Water table | The upper surface of a zone where the ground is saturated with water. |
| Surface runoff | Water flowing over the land surface toward a channel. |
| Baseflow | Groundwater contribution that sustains stream or river flow between rainfall events. |
| Drainage basin, catchment | Land area drained by a river and its tributaries, bounded by higher ground called a watershed. |
| Watershed | The boundary between neighbouring drainage basins. |
| Discharge | The volume of water flowing past a point in a channel per unit of time. |
| Water balance | A comparison of water inputs, outputs and changes in storage over a chosen place and period. |
| Water scarcity | A condition in which available water is insufficient for needs, or people cannot reliably access safe water. |
| Water stress | Pressure on water supply when demand is high relative to available resources and environmental needs. |
| Drought | A period of unusually low water availability relative to normal conditions; different types affect rain, soil, rivers or supply. |
| Desalination | Removing dissolved salts from seawater or brackish water to produce water for use. |
| Water reuse | Treating and using water again for a suitable purpose. |
| Abstraction | Taking water from a river, lake, reservoir or aquifer. |
How the geography works
1. The global water cycle
Water continually moves between the atmosphere, land and oceans. The Sun supplies much of the energy that drives evaporation from oceans, lakes, rivers and wet ground. Plants also transfer water vapour to the atmosphere through transpiration. Water vapour rises, cools and condenses into tiny droplets or ice crystals. When droplets or crystals grow large enough, they fall as precipitation.
Precipitation that falls on land does not all take the same route. Some water evaporates again quickly. Some is intercepted by leaves and later evaporates. Some soaks into the soil. Some travels across the land surface to a stream or lake. Some moves through the soil and rock as groundwater. In cold regions, precipitation may be stored as snow or ice for a long time before melting. Plants take up water through roots and return some of it to the atmosphere. Rivers carry water toward lakes and the ocean, where evaporation can begin another part of the cycle.
There is no single starting point. A diagram may begin at the ocean because it is a large water store, or at a cloud because precipitation is easy to see. The diagram represents connected processes rather than a one-way conveyor belt. The same water molecule may pass through different routes many times.
Stores and transfers
Major stores include:
- Oceans, which hold by far the largest share of Earth's water.
- Ice sheets, glaciers and seasonal snow.
- The atmosphere, where water occurs as vapour, droplets and ice crystals.
- Soil moisture, stored in pore spaces near the surface.
- Groundwater in permeable rock and sediment.
- Rivers, lakes, wetlands and reservoirs.
- Water held in plants, animals and human-built systems.
Transfers include evaporation, transpiration, condensation, precipitation, interception, infiltration, percolation, surface runoff, throughflow, groundwater flow, melting, freezing and streamflow. Some transfers change water's state as well as its location. Evaporation changes liquid to gas. Condensation changes gas to liquid. Freezing and melting exchange water between liquid and solid stores.
A water-cycle diagram is a simplified model. It cannot show every store, every route and every timescale at once. A clear diagram should label its scale, show the main stores as boxes or pools, and show transfers with arrows. Arrow direction matters. A label such as infiltration describes movement from the surface into soil; percolation continues downward through soil and permeable rock. Avoid drawing arrows that make every rainfall drop go directly to a river.
Timescales and residence
Water does not stay in every store for the same length of time. A droplet may remain in the atmosphere for days. Water in a river may reach the sea in hours or weeks. Soil moisture may remain for days or months depending on weather, plants and soil. Groundwater may travel slowly and stay underground for years, centuries or longer. Ice can store water for much longer.
The time spent in a store is sometimes described as residence time. The concept helps explain why a store responds quickly or slowly to a change. A small stream may rise quickly after rain; a deep aquifer may respond over a longer period. Water pumped from an aquifer may take a long time to be replaced. The cycle continues, but each store has a different turnover rate.
A short residence time does not automatically mean a resource is easy to use. A river may carry water rapidly through a steep catchment, but there may be little storage for a dry month. A long residence time can buffer drought, but groundwater may be deep, difficult to access or vulnerable to contamination. Storage, timing, location, quality and access all matter.
2. Drainage basins: water moving through a local system
A drainage basin is an area of land drained by one river and its tributaries. Higher land around it forms a watershed, the boundary separating it from neighbouring basins. Rain falling on one side may flow toward one river; rain falling on the other side may enter another.
A drainage basin is an open system. Water and energy enter and leave it. Precipitation is a main water input. Outputs include river discharge and evapotranspiration. Water can be stored temporarily in vegetation, soil, surface depressions, groundwater, channels, lakes and reservoirs.
At a simple scale, a basin water balance can be written as:
Change in storage = precipitation − river discharge − evapotranspiration − other transfers out
The exact equation used depends on which inputs, outputs and stores are included. Water may also be imported or exported by pipes, canals, reservoirs or pumping. The key idea is that a basin's available water changes when inputs, outputs or storage change. A wet winter can refill soil and groundwater; a hot dry summer can reduce stores while demand rises.
Interpreting a basin diagram
A useful drainage-basin sketch includes:
- A boundary following higher ground around the catchment.
- A watershed label.
- The main river channel and tributaries.
- A north arrow and a simple scale or location note.
- Arrows showing water movement, each labelled with a process.
- Possible stores such as vegetation, soil, groundwater, a lake or a reservoir.
- Human features if they matter, such as roads, urban surfaces, drains, farms or water-treatment works.
A diagram may show water flowing downhill but should not imply that every parcel travels directly to the main channel. Some infiltrates, some is taken up by plants, some evaporates, and some reaches a stream long after rainfall. A good sketch shows more than one pathway.
Pathways after precipitation
When precipitation reaches land, it may be intercepted by leaves, buildings or other surfaces. Interception can delay water reaching the soil. Water on leaves may evaporate, drip from leaves, run down stems, or fall after the canopy becomes wet. A forest canopy therefore changes the timing and pathway of rainfall; it does not make all rain disappear.
Water that reaches the ground may infiltrate the soil. If soil has open pore spaces and is not already saturated, more water can enter. Water can move downward through permeable layers and recharge an aquifer. Some moves sideways through the soil as throughflow and may reach a channel. If rain falls faster than water can infiltrate, or the soil is saturated, water may flow over the ground as surface runoff.
Surface runoff can reach a channel quickly. Throughflow usually takes longer because water moves through soil. Groundwater often moves more slowly, although rates vary with rock, fractures and pressure. Groundwater may emerge as a spring or seep into a river as baseflow. Baseflow can sustain a river between storms, particularly where permeable aquifers supply water.
Factors that affect the route
The same storm can produce different responses in different basins. Important controls include:
- Rainfall amount and intensity. More rain adds more water. Intense rainfall may exceed the soil's infiltration capacity.
- Antecedent conditions. If soil and stores are already wet, less additional water can be absorbed.
- Temperature and season. Warm conditions can increase evaporation and plant transpiration. Frozen ground can limit infiltration. Snowmelt can add water rapidly.
- Relief and slope. Steeper slopes often encourage faster downslope movement, though soil and vegetation also matter.
- Geology. Permeable rock can accept and store water; impermeable rock limits downward movement and may encourage surface flow.
- Soil texture and structure. Coarse, well-structured soil often has larger connected pore spaces than compacted or clay-rich soil.
- Vegetation. Leaves intercept rain; roots create pathways; plant cover slows flow and helps protect soil.
- Land use. Roads, roofs and paving reduce infiltration. Drains and channels can route water rapidly.
- Basin shape and size. A compact basin can deliver runoff to one point more nearly together than a long narrow basin, though local conditions affect the actual response.
- Water management. Reservoirs, drainage systems, leaky pipes and abstractions change storage or flow.
These controls interact. It is misleading to say “clay always causes flooding” without describing conditions. Clay-rich or compacted soil often has low permeability, but actual runoff also depends on slope, rainfall intensity, vegetation and how wet the soil already is.
A simple storm response
Imagine rain falling on two nearby catchments. Catchment A has forested slopes, permeable soil and space for water to infiltrate. Catchment B has saturated clay soil, steep slopes and many roads. The same storm may produce faster runoff in B because less water enters the ground and drainage routes connect streets to streams. Catchment A may store more water temporarily and release some slowly through soil and groundwater.
This is a model, not a guarantee. A forest can still produce rapid runoff if its soil is saturated or rainfall is very intense. An urban area can reduce peak flow through permeable paving, wetlands and storage basins. Land cover matters, but it works alongside soil, geology, relief and rainfall.
3. Freshwater: how much is available and to whom?
Most of Earth's water is saline ocean water. Only a small proportion is freshwater, and much of that is stored in ice or underground rather than in lakes and rivers that people can reach easily. The quantity that people can safely, affordably and reliably use is much smaller than the total amount of water on the planet.
Freshwater is unevenly distributed. Some places receive reliable rainfall and have rivers or aquifers; others are arid or have highly variable seasonal rainfall. A place with heavy rain can still face shortages if water arrives in a short season, runs rapidly to the sea, is polluted, or cannot be stored and moved. A place with little rain may have reliable supply through groundwater, imported water, desalination or careful demand management.
Water availability changes over time. The rainy season, dry season and drought years alter supply. Climate affects precipitation, evaporation and snow or ice storage. Population growth, farming, industry and energy production affect demand. Water quality and infrastructure determine how much supply is usable. A household may live beside a river but lack a safe treatment system or a pipe connection.
Physical scarcity and access
Physical scarcity occurs when the amount of water available is low compared with needs, especially after allowing for the needs of ecosystems. Economic or infrastructural scarcity occurs when water exists but people lack the money, technology, governance or distribution network to access it safely. These types can overlap.
A water-scarcity map is not a simple rainfall map. It may compare withdrawals with renewable supply, include ecological needs, or show access to safe drinking water. Read the map's title, date, units, categories and method. Two maps can show different patterns because they measure different things.
Access also differs within a country or city. Piped networks may reach some neighbourhoods but not others. A rural community may depend on a well that fails during a drought. Water may be available but unsafe because of pathogens, chemicals or salt. Affordability can limit how much a household uses. These examples show why the question “Is there water here?” is incomplete. Ask whether safe water is available at the right time, in the right place, at a reliable and affordable cost.
Water stress and competing demands
Water stress describes pressure on resources when demand is high relative to supply and environmental requirements. Demand includes more than household taps. Agriculture uses water for crops and livestock. Industry uses water in processes, cooling and cleaning. Energy generation may require water or affect river flows. Cities need water for homes, sanitation, parks, fire safety and businesses. Rivers, wetlands and other ecosystems also need enough water and suitable quality.
Water users can compete. During a dry period, water reserved for a river or wetland may limit abstraction for irrigation or industry. A reservoir may supply homes while changing the timing and amount of water downstream. A new development can bring homes and employment but add to demand. Managing water involves deciding which needs are met, when, and at what environmental cost.
A person's water footprint includes water used directly and water used to produce goods and services they consume. Growing some crops requires more irrigation in one climate than another. Producing food, clothes, electricity and manufactured goods can depend on water in places far away. A product's water footprint is not a complete measure of environmental impact, but it helps show that consumption can shift pressure between regions.
4. Water quality and the human water cycle
People interact with water at many points. A river may supply drinking water, receive treated wastewater, support wildlife and provide recreation. Groundwater can supply homes and farms, but pollution entering permeable rock may remain for a long time. A reservoir stores water but also changes the local water cycle by holding a large volume behind a barrier.
Water quality affects availability. Water can be plentiful but unusable if it contains harmful microorganisms, excess nutrients, chemicals or salt. Treatment can make some sources safer but requires energy, equipment, skilled workers and maintenance. Preventing pollution can be more reliable than removing pollutants after they enter a river or aquifer.
Sources of pollution include untreated sewage, agricultural fertilisers and pesticides, soil erosion, industrial chemicals, road runoff, landfill leakage and household products. The effects depend on pollutant type and amount, river flow, temperature, local habitat and treatment. Excess nutrients can contribute to algal growth; pathogens can make water unsafe; sediment can cloud water and affect habitats. Do not assume every pollutant behaves in the same way.
The human water cycle includes abstraction, treatment, storage, distribution, use, wastewater collection and return to the environment. Water companies may draw from reservoirs, rivers or aquifers, treat it, and send it through pipes. After use, wastewater is treated and returned to rivers or the sea. Leaks lose treated water before it reaches users. Water used indoors may be returned after treatment; water used to irrigate crops may evaporate or enter soil. Human actions change both the amount and quality of water available to others.
Place example: 5. The United Kingdom's uneven water reality
The United Kingdom is often pictured as wet, with frequent rain and many rivers. Yet average national rainfall does not reveal whether water is available in a particular catchment, season or neighbourhood. Rainfall differs across the country because of prevailing weather, mountains, distance from the sea and local climate. Demand and storage also vary. Southern and eastern parts of England generally receive less rainfall than many upland western areas, while some heavily populated areas have high water demand.
A country can receive substantial rainfall overall while some regions face water stress. Rain may fall where and when fewer people need it, then run quickly through rivers or be unavailable during a dry summer. Reservoirs, aquifers, pipes and transfers can move water across time and place, but each has costs and environmental effects.
The Environment Agency's National Framework for Water Resources 2025 is a planning document, not a prediction of an inevitable shortage. Its modelling explores population, climate and environmental scenarios. In the framework's “do nothing” scenario, it estimates a possible public water-supply deficit of up to 5,000 megalitres per day by 2055 across England and Wales. This figure is a scenario output that depends on assumptions; it should not be described as today's measured shortage or as a certainty. The same framework shows that projected pressures differ between regional planning groups and that environmental requirements form part of the challenge.
This current example shows why water planning is about more than rainfall. Forecast supply must account for household demand, industry, population, climate, drought resilience and water needed to protect rivers and ecosystems. Plans can change as evidence and conditions change. A responsible geography answer labels a number with its date, unit and scenario.
Chalk aquifers in southern and eastern England
Chalk is a major aquifer in southern and eastern England. An aquifer is rock that stores and transmits groundwater. Rain can infiltrate through soil and enter pores, cracks and fractures in the chalk. Groundwater can then move slowly and feed wells, springs or river baseflow. Aquifers provide storage that can support supply when rainfall is low, although recharge depends on rainfall, geology and land conditions.
An aquifer is not an underground lake with open caverns everywhere. Water occupies spaces and cracks in the rock. How fast it moves depends on how connected those spaces are. Pumping groundwater too quickly can lower water levels and affect springs, streams or wetlands. Pollutants can also move through permeable rock, so protecting the land above an aquifer matters.
The British Geological Survey identifies Chalk as a major aquifer across southern and eastern England. This is a useful place link because it connects rock type to water storage, supply and vulnerability. It also demonstrates that a geological map can help explain why two nearby places differ in groundwater availability.
Water transfer and reservoirs
A reservoir stores water for later use. It may collect rain and river flow when supplies are available, then release water during drier periods. A reservoir can improve reliability, supply homes and businesses, support some recreation, or help manage flows. Its construction changes a landscape: land may be flooded, habitats altered, settlements or roads affected, and downstream flow patterns changed.
A water transfer moves water from one area or source to another through pipes, canals or rivers. Transfers can help balance regional differences between supply and demand. They require energy and infrastructure, can be expensive, and may affect the source catchment and the receiving catchment. A transfer does not create new water; it changes where water is available and who can use it.
A reservoir or transfer should be compared with other options. Demand reduction, leakage repair, water reuse, groundwater management, smaller local storage and nature-based measures may avoid or delay some infrastructure. Each option has limits. A new reservoir may take years to build and alter habitats; a transfer depends on water being available at its source; conservation measures may reduce runoff but cannot supply a city on their own.
6. Managing water supply and demand
Water management aims to make supply reliable while protecting people, economies and ecosystems. It can increase supply, reduce demand, improve distribution or protect water quality. Most long-term strategies combine several approaches rather than relying on one large project.
Increase or diversify supply
- Reservoirs store surface water for later use. They can improve reliability but flood land, alter habitat and river flow, and require investment.
- Groundwater abstraction draws from aquifers. It can provide stored water, but excessive pumping may lower water levels or reduce river and wetland flows.
- Water transfers move water between regions or catchments. They can share supplies but require construction, energy, agreements and safeguards for source rivers.
- Desalination removes salt from seawater. It can provide a reliable coastal source but often uses substantial energy, requires expensive facilities and produces concentrated brine that must be managed.
- Water reuse treats wastewater for suitable uses. It can reduce demand on rivers and aquifers, but treatment standards, energy, public confidence and intended use matter.
- Rainwater capture collects water from roofs or surfaces. It can reduce mains demand for some uses but depends on rainfall and storage capacity.
Supply options are not interchangeable. A city far inland may not have easy access to seawater. A reservoir needs a suitable valley, land, finance and environmental permission. Reuse may be appropriate for industrial processes or irrigation but require additional treatment for drinking water. Consider location, cost, time, reliability and quality.
Reduce demand and waste
Demand management can include repairing leaks, installing water-efficient appliances, using water meters, improving irrigation, changing industrial processes, fitting low-flow fixtures and encouraging people to use water carefully. Reducing leakage can make more treated water available without constructing a new source. Better soil management or drip irrigation can reduce losses in agriculture, although results vary by crop, soil and climate.
The Environment Act target in England aims to reduce public water-supply use per person by 20 percent by 2038 from a 2019–20 baseline. Treat this as a policy target, not a completed reduction. A target gives planners a direction and can support planning for household efficiency, but actual results depend on action, measurement and review.
Demand measures can raise questions of fairness. Households differ in size, health needs, income and access to efficient appliances. A tariff or meter can encourage reduced use but should not make essential water unaffordable. Businesses may need water for safe operations and employment. Good management measures essential needs, protects vulnerable users and shares responsibility across households, companies and other water users.
Protect catchments and nature
A catchment approach considers land and water together. Protecting soil, wetlands, riverside vegetation and groundwater recharge areas can help regulate flows and improve water quality. Wetlands may store water and slow its movement. Vegetation can intercept rainfall, roots can improve soil structure and floodplains can provide space for high flows. These measures can support wildlife and reduce some pressures.
Nature-based approaches have limits. A wetland cannot stop every extreme flood or supply every urban demand. Restoring vegetation takes time and requires land and maintenance. Measures need to suit local geology and hydrology. They work best as part of a wider plan that can include reservoirs, drainage, warning systems, leakage reduction and demand management.
Protecting aquifers includes limiting pollutants and managing abstraction. The ground above a permeable aquifer may need careful land use because spilled chemicals or contaminated water can infiltrate and move underground. Groundwater often travels slowly, so pollution can be difficult to remove once it enters the aquifer.
7. Drought, floods and water security
Drought is a period when water availability is unusually low compared with normal conditions. It can begin with low rainfall, but impacts may appear later. Meteorological drought means precipitation is below normal. Agricultural drought occurs when soil moisture is too low for crops or vegetation. Hydrological drought occurs when river flow, reservoirs or groundwater levels fall. A public-supply drought occurs when available resources threaten reliable household supply.
These types are connected but do not start or end at the same time. Rain can return and end a meteorological drought while an aquifer remains low because it takes time to recharge. Soil may dry quickly in hot weather. A reservoir may have enough stored water for weeks or months, delaying supply effects. Drought is therefore about rainfall, storage, demand and response, not one rainfall total alone.
Floods and water security relate to the same pathways. Intense rain on saturated ground or urban surfaces can become rapid runoff. A catchment may send a sharp rise of water to channels. Flooding is more directly explored in the rivers chapter; here the main link is that land cover and storage affect both the movement of water and the amount retained for drier periods. Measures that slow or store runoff may provide several benefits, but their effect depends on location and scale.
Water security means reliable access to an adequate quantity of safe water while maintaining ecosystems and planning for future changes. A secure system needs more than a large reservoir. It also needs clean sources, treatment, functioning pipes, affordability, emergency planning, demand management and safeguards for rivers and aquifers.
Maps, data and evidence
8. Reading water data
Water budgets
A water budget compares inputs, outputs and changes in stores for a defined area and time. Make the period clear: a monthly budget may show a wet winter and dry summer; an annual average may hide those seasonal differences.
A simplified example, with invented values for practice, could show a catchment receiving 900 mm of precipitation during a year. During the same year, 420 mm leaves through evapotranspiration and 400 mm through streamflow. The remaining 80 mm increases soil or groundwater storage, assuming no other important transfers. If the next year begins with low stores, the same rainfall may not produce the same river response. This arithmetic is a simplified teaching model: real catchments include measurement uncertainty, transfers and spatial variation.
Check that units match before calculating. Millimetres of water over a catchment describe depth; cubic metres per second describe river discharge; litres per day may describe supply or demand. These units cannot be compared directly without converting using area and time.
Hydrographs and rainfall graphs
A storm hydrograph shows how discharge changes over time after rainfall. Its rising limb shows discharge increasing; peak discharge is the highest flow; the falling or recession limb shows flow decreasing. Lag time is the time between peak rainfall and peak discharge, depending on how the graph defines the rainfall peak and flow peak.
A short lag and a steep rising limb suggest a rapid basin response. A longer lag and a gentler rise suggest a slower response. But the graph alone does not identify the cause. Use information about soil, geology, slope, vegetation and land use. A high peak could relate to intense rain, wet ground, urban surfaces or a combination.
Read axes, units, time period and scale. Determine whether rainfall bars show hourly intensity or total rainfall. Check whether discharge is measured at the same location over the whole period. Avoid stating a precise lag time unless the graph supports it.
Maps and forecasts
A water-stress map or supply forecast depends on definitions and assumptions. Ask:
- What geographic area is mapped?
- Is the map about rainfall, withdrawals, safe drinking-water access or projected supply and demand?
- What year or scenario does it represent?
- What are the units and categories?
- Does it include water needed by ecosystems?
- Does it show a measurement, a modelled forecast or a policy target?
- What uncertainty or limitation is stated?
A projection is a reason to plan, not a statement that one outcome will certainly happen. Scenarios explore how outcomes may differ if population, climate, demand or policy changes. Compare a “do nothing” case with a planned case only after reading the assumptions behind both.
Common misconception: 9. Frequent errors
The water cycle has one fixed starting point. It is a connected cycle. A diagram may choose a starting point for convenience, but water can enter the explanation from any store.
Every drop of rain goes straight to a river. Some water is intercepted, evaporates, infiltrates, moves through soil, recharges groundwater, is taken up by plants or is stored as snow and ice.
Water is renewable, so it cannot run out. Water cycles, but a particular aquifer, reservoir or river can be depleted faster than it is replenished. Safe, accessible freshwater is unevenly distributed.
A wet country cannot experience water shortages. National rainfall can hide regional and seasonal differences, high demand, poor infrastructure, pollution and limited storage.
Groundwater is a river flowing through a large underground cave. Most groundwater occupies small connected spaces and cracks in soil or rock. Its movement is often slow.
All rainfall infiltrates equally. Infiltration depends on soil, rock, slope, vegetation, land use, rainfall intensity and whether the ground is already saturated or frozen.
Urbanisation is the only cause of rapid runoff. Urban surfaces can speed runoff, but steep slopes, saturated soil, intense rainfall and impermeable geology can also contribute.
A reservoir creates water. It stores water that arrives from rainfall, rivers or transfers. It changes timing and availability but does not create water molecules.
A supply forecast is a certain future shortage. A forecast depends on assumptions and scenarios. It should be labelled with date, units and scenario.
Water management is only an engineering problem. Decisions involve ecosystems, cost, access, health, fairness, land use, demand and governance as well as engineering.
Self-check: 10. Questions
Answer from memory. Explain questions should connect the process with its effects.
- What is hydrology?
- What is the difference between a water store and a transfer?
- Name four stores and four transfers in the global water cycle.
- What provides much of the energy that drives evaporation?
- How do evaporation and transpiration differ?
- What is the difference between infiltration and percolation?
- What is a drainage basin and what is a watershed?
- Why is a drainage basin described as an open system?
- How can soil saturation change the route of rainfall?
- How can permeable rock affect river flow between storms?
- Give two ways vegetation can change water movement.
- Why can roads and roofs lead to a faster stream response after rain?
- Explain one reason why urbanisation does not always create the same flood response.
- What does negative change in groundwater storage mean?
- How does physical water scarcity differ from poor access to water?
- Why is a rainfall map not necessarily a water-stress map?
- Give three different uses of freshwater besides household drinking.
- What is one way that water quality can reduce availability?
- Why is pumping water from an aquifer not always sustainable?
- What is the purpose of a reservoir and one effect it may have?
- How is a water transfer different from desalination?
- Give two ways to reduce demand and one fairness question to consider.
- Why does a meteorological drought not always coincide with hydrological drought?
- What does a short lag time on a storm hydrograph suggest?
- Why should a hydrograph be considered with information about a catchment?
- How does a water-cycle diagram simplify reality?
- Why is groundwater not usually an underground open river?
- What does it mean when a water forecast is scenario-based?
- Give an example of a nature-based water-management measure and a limitation.
- Write a short water pathway from precipitation to a river.
Suggested responses
- Hydrology is the study of water, how it is stored and moved, and how it interacts with people and the environment.
- A store holds water for a time; a transfer moves water from one store to another.
- Stores include ocean, atmosphere, soil, groundwater, ice, lakes or plants. Transfers include evaporation, precipitation, infiltration, runoff, transpiration or groundwater flow.
- Energy from the Sun drives much evaporation.
- Evaporation changes liquid water to vapour from a surface; transpiration is water vapour released by plants.
- Infiltration is water entering soil from the surface. Percolation is downward movement through soil and permeable rock.
- A drainage basin is land drained by a river and tributaries; a watershed is higher ground dividing neighbouring basins.
- Water and energy enter and leave it. Precipitation is an input; streamflow and evapotranspiration are outputs.
- Saturated soil has little storage space left, so a greater share may flow over the land surface or enter channels quickly.
- Permeable rock can accept and store infiltrated water, then release it slowly as groundwater flow or baseflow.
- Vegetation can intercept rain, slow water reaching ground, take up water through roots and affect soil structure.
- Impermeable surfaces limit infiltration and drains can route runoff quickly to streams.
- Soil moisture, slope, rainfall intensity, geology, vegetation and stormwater measures also matter.
- More water has left the aquifer store than entered it during the period measured.
- Physical scarcity means water resources are low relative to needs. Poor access means infrastructure, money, quality or governance prevents safe reliable use even if water exists nearby.
- A water-stress map may include demand, access, quality or ecosystem needs as well as supply; read its title and method.
- Farming, manufacturing, cooling or energy production, sanitation, recreation and ecosystem needs.
- Pollution by pathogens, chemicals, salt or excess nutrients can make water unsafe or costly to treat.
- Pumping faster than recharge can lower water levels and reduce spring, stream or wetland flows.
- A reservoir stores water for later use and may improve reliability; it can flood land and change habitats or downstream flows.
- A transfer moves water from one source or region to another; desalination removes salt from seawater or brackish water.
- Repair leaks, use efficient fixtures, change irrigation or reuse treated water. Consider whether measures keep essential water affordable for households with different needs.
- Rivers, reservoirs and aquifers respond at different speeds; stores can remain low after rainfall returns.
- The stream responds rapidly to rain, perhaps due to fast runoff or limited storage, but more catchment evidence is needed to explain why.
- Similar graphs may result from different geology, land use, soil and rainfall. Context helps identify likely causes.
- It shows major pathways and stores but leaves out many routes, scales, human transfers and different timescales.
- Most groundwater occupies connected pores and cracks rather than large empty caverns.
- The result depends on a set of assumptions about future conditions; it is not a certain prediction.
- Wetland or floodplain restoration can store water and support habitats, but needs land and cannot provide every supply need or stop every flood.
- Rain falls onto vegetation; some is intercepted, some reaches soil and infiltrates; water moves through soil or groundwater to a channel and becomes streamflow.
11. Practice tasks
Task A: Trace two pathways
After a storm, trace one drop from a leaf and one drop from a road to a nearby stream. Explain how their routes might differ.
Model response: A drop caught by a leaf may stay on the canopy and evaporate, drip later to soil or run down the stem. If it reaches soil, it may infiltrate and move as throughflow or groundwater before entering the stream. A drop on a paved road cannot readily infiltrate. It may enter a drain and reach the stream quickly as surface runoff. The exact difference depends on drains, soil beside the road, vegetation, rainfall intensity and how wet the catchment already is.
Task B: Read a simple water balance
A small basin receives 720 mm of precipitation during a month. During that month, 260 mm leaves through evapotranspiration and 390 mm leaves by streamflow. Assume no water is imported or abstracted. How much does storage change? Explain why the answer does not tell us the starting storage.
Model response: Storage increases by 70 mm because 720 − 260 − 390 = 70. The calculation only describes the change during the month. It does not say whether the basin began with very dry soil or a full aquifer. The same increase can leave the basin with very different amounts of water depending on the starting store.
Task C: Compare two basins
Basin A has permeable rock, woodland and a gentle slope. Basin B has compacted soil, steep slopes and a large paved town. Explain which may respond more quickly to a storm and name two pieces of evidence that could test the explanation.
Model response: Basin B may respond more quickly because compacted soil and paving reduce infiltration, while steep slopes and drains can route water rapidly to channels. Basin A may have more interception and infiltration, which can delay some water. Rainfall intensity and antecedent soil moisture could change the pattern. Compare storm hydrographs and map or field evidence about land cover, soil and geology.
Task D: Evaluate an option
A council must choose between repairing a leaking pipe network, building a new reservoir, or transferring water from another catchment. Recommend a first action and explain what else should be considered.
Model response: Repairing significant leaks can release water already treated and may be quicker than building major infrastructure, so it is a strong early action if evidence shows leakage is large. It does not remove every future supply challenge. A new reservoir can store water but changes land, habitats and river flows. A transfer can balance regional supply but affects the source and receiving areas and uses infrastructure and energy. The council should compare reliable yields, cost, timescale, environmental effects, demand savings and fairness between communities.
Task E: Interpret a planning forecast
A report estimates a possible water-supply deficit for a future year under a “do nothing” scenario. Explain three things a reader should check before using the number.
Model response: Check the report's publication date, geographic area, unit and scenario assumptions. Find out whether it is a measured deficit or modelled possibility, what population and climate assumptions it uses, and whether it includes environmental water needs. Compare it with other scenarios and planned actions. Describe it as a conditional projection rather than a certain outcome.
12. Applied enquiry: compare catchment response
A catchment enquiry can investigate how land cover and ground conditions affect the route water takes after rain. A useful question is: “Which of these two small catchments is likely to send water to its stream more quickly after a storm, and what evidence supports that prediction?” The answer should be a reasoned hypothesis, not a claim that land cover determines every outcome.
The table below contains invented classroom data. It is designed for interpretation practice and is not a real monitoring record.
| Catchment characteristic | Catchment Pine | Catchment Park |
|---|---|---|
| Land cover | Mixed woodland and rough grass | Housing, roads and paved car park |
| Surface | Mostly unsealed soil | Extensive roofs and hard surfaces |
| Slope | Gentle to moderate | Moderate |
| Ground before storm | Damp, not saturated | Damp, with connected road drains |
| Rain during example storm | 22 mm in one hour | 22 mm in one hour |
| Time to observed peak stream response | 5 hours | 2 hours |
Catchment Park has a shorter observed response in this example. Paving limits infiltration, drains connect surfaces to channels, and some runoff can travel quickly. Catchment Pine has vegetation and unsealed ground that can intercept or absorb some water and route other water more slowly through soil. The identical rainfall helps comparison, but the table does not prove which single factor caused the difference. The catchments may differ in geology, shape, channel networks, measurement location or the way the peak was identified.
If students measure a local site, they should keep methods consistent. Rain gauges need an open location away from obstacles that shelter them from wind or intercept rain. A stream measurement should use the same point and method each time, and students should work only where the teacher has judged access safe. Land cover can be mapped by category and area. Notes about soil wetness and recent rainfall can help explain why a storm response changes.
Compare rainfall and discharge
Rainfall and discharge graphs can help test a catchment hypothesis. Use a common time axis. Mark the rainfall peak and the stream-discharge peak, then estimate the lag. Describe the rising limb, peak and recession. Compare events only when the measurement period, scale and location are clear.
A steep rising limb means discharge increased quickly. It can fit rapid runoff, but it may also reflect a very intense storm or wet conditions before the storm. A low peak might reflect less rain, more storage, a larger channel or a different catchment size. A discharge value is a volume per unit of time; a larger basin may have greater discharge even if it responds more slowly. For fair comparison, consider basin area or use discharge per unit area if the dataset supports that calculation.
A catchment stores water between storms. If it is dry, soil and vegetation may take up more of the next rainfall. If stores are saturated, additional rain may run off more rapidly. Frozen ground can also restrict infiltration. The effect can change over a few days without any land-use change. This is why a single hydrograph is evidence of one event, not a universal description of the catchment.
Build a supported conclusion
A concise conclusion should:
- State which catchment appears to respond faster or more slowly.
- Quote specific evidence such as time to peak, rising-limb shape or mapped surface cover.
- Explain a plausible pathway from precipitation to stream.
- Identify an uncertainty or alternative factor.
- Say what additional observation would help test the explanation.
For example: “Park responded faster in this invented dataset, reaching its observed peak after two hours compared with Pine at five hours. Its larger paved area and connected drains could route surface runoff rapidly to the stream. However, the table does not show geology, basin size or channel layout, so it cannot isolate land cover as the only cause. Repeating measurements across several storms and mapping drainage routes would test the interpretation.”
13. Water decisions: compare perspectives
Water-management choices can look different depending on who is affected. A household needs safe and affordable supply. A farmer may need water at a particular stage of crop growth. A water company must provide reliable water and maintain pipes. A river's plants and animals need suitable flow and quality. A local council considers homes, jobs, roads and emergency plans. Future residents depend on decisions made today.
Consider a fictional town beside a chalk aquifer and a small river. The town's population is growing. A dry summer reduces river flow; the aquifer is also used by farms. Planners are considering three responses:
- Repair a section of leaking water mains and support household efficiency.
- Build a reservoir in a nearby valley.
- Increase groundwater pumping while building a new pipeline.
The first option reduces loss of treated water and may act relatively quickly, but it cannot meet every additional need if leakage is already low or demand continues to rise. Household efficiency can reduce demand, but it should not transfer the full responsibility to residents if major leaks or industrial use are important. The second option can store water for dry periods, but construction takes time, costs money and changes land and river systems. The third option can increase supply but may lower groundwater levels or reduce spring and stream flows if abstraction exceeds recharge. The pipeline also has a cost and may shift pressure to another community.
A decision table helps compare options without hiding trade-offs.
| Question | Why it matters |
|---|---|
| How much reliable water could the option provide? | A high average yield may not be dependable during drought. |
| When would the water be available? | Seasonal demand and supply do not always match. |
| What is the effect on rivers, wetlands and aquifers? | Ecosystems are part of the water system, not spare users. |
| How soon could the option operate? | Demand may rise before a large project is finished. |
| Who pays and who benefits? | Costs and benefits can fall on different groups. |
| Does the option improve quality as well as quantity? | More water is not useful if it is unsafe or costly to treat. |
| Can demand reduction or reuse meet some of the need? | Avoiding waste may reduce pressure on new sources. |
| What happens under a different climate or population scenario? | Long-lived infrastructure should be robust to uncertainty. |
There may not be one perfect solution. A balanced plan can combine leak repair, demand measures, protection of the aquifer, carefully monitored abstraction and selective new storage. Students should support a recommendation with evidence and explain which groups may gain or lose. “Build a reservoir” is a proposal; a complete evaluation explains the expected water benefit, the likely effects and the alternatives.
Water security and fairness
Safe water is essential for drinking, cooking and sanitation. Access to it affects health, education, work and dignity. A water service can be technically present but unreliable, unaffordable or unsafe. A household that spends a long time collecting water may have less time for paid work or school. Communities with limited political influence may have less say in allocation decisions.
Fair management asks who has access, who carries risk, and who makes the decision. A restriction during drought might affect a golf course differently from a hospital, household or livestock farm. The priority system should be clear and lawful. Water charges can support maintenance and encourage conservation, but essential needs and vulnerable households need protection. The environment also needs water to keep habitats and river functions healthy.
Long-term planning can use scenarios instead of pretending to know one exact future. Planners may test higher and lower population growth, hotter or drier conditions, different efficiency levels and alternative infrastructure schedules. Monitoring water levels, rainfall, river flow, demand and leaks helps them adjust decisions as evidence changes.
Revision points: 14. Consolidation
- Treat the water cycle as connected stores and transfers operating at different timescales.
- In a drainage basin, trace precipitation through interception, infiltration, throughflow, groundwater, runoff and channel flow.
- Explain how rainfall, antecedent conditions, relief, geology, soil, vegetation and land use combine to shape water movement.
- Separate the amount of water in nature from the amount that is safe, affordable and accessible.
- Evaluate supply and demand measures by considering reliability, time, cost, fairness and environmental effects.
- Read water data using its units, time period, spatial scale, method and scenario.
- Water is renewable as part of the cycle, but particular stores and supplies can be depleted, polluted or inaccessible.
- Link management to people and ecosystems rather than treating water as an engineering problem alone.
Curriculum alignment
- Curriculum coverage IDs:
ks3.physical.hydrology,ks3.human.natural-resources,ks3.human-physical-interaction - Related practice packs:
ks3_geography_water_resources - Shared concept tags:
hydrology,water-cycle,water-security,human-physical-interaction
Sources
- Curriculum/specification: Department for Education: England Geography programme of study
- Water cycle processes: Met Office: The water cycle
- Water cycle and groundwater: U.S. Geological Survey: Hydrologic cycle
- Groundwater movement: U.S. Geological Survey: Groundwater flow and the water cycle
- Runoff and urban land use: U.S. Geological Survey: Surface runoff and the water cycle
- England and Wales water planning: Environment Agency: National Framework for Water Resources 2025, section 3
- Groundwater and aquifers: British Geological Survey: Chalk aquifer of southern and eastern England
- Demand policy: Department for Environment, Food & Rural Affairs: Water demand target delivery plan
- Forecast figures are tied to the Environment Agency's stated scenarios and may be revised as plans, evidence and modelling change. Check the publication date and assumptions before quoting a figure.