 FoxChild@Learn
2. The geography of the United Kingdom
Curriculum status: Enrichment guide. This extends required KS3 learning with additional place examples; the programme does not prescribe this chapter or its named examples.
This guide follows the England Key Stage 3 Geography programme of study. Its purpose is to help you connect location, physical geography and human activity. Learn to use a map and evidence to explain why places differ, while avoiding the idea that one description can represent an entire country.
Required knowledge
- Locate the United Kingdom in north-west Europe and identify England, Scotland, Wales and Northern Ireland. Distinguish the UK from Great Britain and from the island of Ireland.
- Use a map to locate surrounding seas, major islands, broad upland and lowland regions, major rivers and selected cities. Use compass directions and relative location accurately.
- Explain how geological structure, relief, climate, drainage, soils and coastlines help shape landscapes and influence some human decisions.
- Recognise the UK’s varied settlement pattern: large cities, smaller towns, villages, dispersed rural settlement, industrial regions and places with lower population density.
- Explain that physical and human geography interact. Land use is also shaped by history, transport, resources, technology, planning and people’s choices.
- Compare regions with evidence at an appropriate scale. A national average or broad pattern can hide important local differences.
- Interpret physical and human maps, climate graphs, photographs and simple data tables, describing what the evidence shows before explaining why.
Key vocabulary
| Term | Meaning and use |
|---|---|
| United Kingdom (UK) | The sovereign state made up of England, Scotland, Wales and Northern Ireland. |
| Great Britain | The island containing England, Scotland and Wales; it does not include Northern Ireland. |
| British Isles | A geographical name for the group of islands that includes Great Britain, Ireland and many smaller islands. The term can be politically sensitive; use “UK and Ireland” where that is what you mean. |
| relief | Differences in height and slope across the land surface. Relief is not simply whether a place is “hilly”; it can be measured and mapped. |
| upland | A broad term for higher land. Upland is a relative description and does not always mean a very high mountain. |
| lowland | Land at lower elevations, often with gentler slopes, though lowlands can contain hills and steep valleys. |
| topography | The arrangement of natural and built features on the land surface, including elevation, slope, valleys and ridges. |
| geology | The rocks and geological structures beneath and at the surface, together with their history. |
| drainage basin | The land drained by a river and its tributaries, bounded by a watershed or drainage divide. |
| tributary | A smaller river or stream that flows into a larger river. |
| climate | The long-term pattern of weather, usually described using observations over a standard multi-decade period. |
| maritime influence | The effect of nearby seas on temperature, moisture and weather; the exact effect varies with wind direction, season and location. |
| orographic rainfall | Rainfall enhanced when moist air is forced to rise over higher ground, cools and condenses. |
| land use | The main purpose for which people use an area, such as housing, farming, industry, recreation, transport or conservation. |
| population density | The number of people living in a defined area, often expressed as people per square kilometre. It is an average, not a claim that people are evenly spread. |
| urban | Related to towns and cities. Statistical definitions use rules about settlement form, population and density; the boundary depends on the dataset. |
| rural | Related to countryside and smaller settlements. Rural does not mean empty, unchanging or without services. |
| region | An area grouped because it shares a feature or because it is used as a planning or statistical unit. Different maps can define different regions. |
| scale | The relationship between a distance on a map and the corresponding real distance, or the level at which a pattern is studied: local, regional, national or global. |
How the geography works
1. Location and orientation
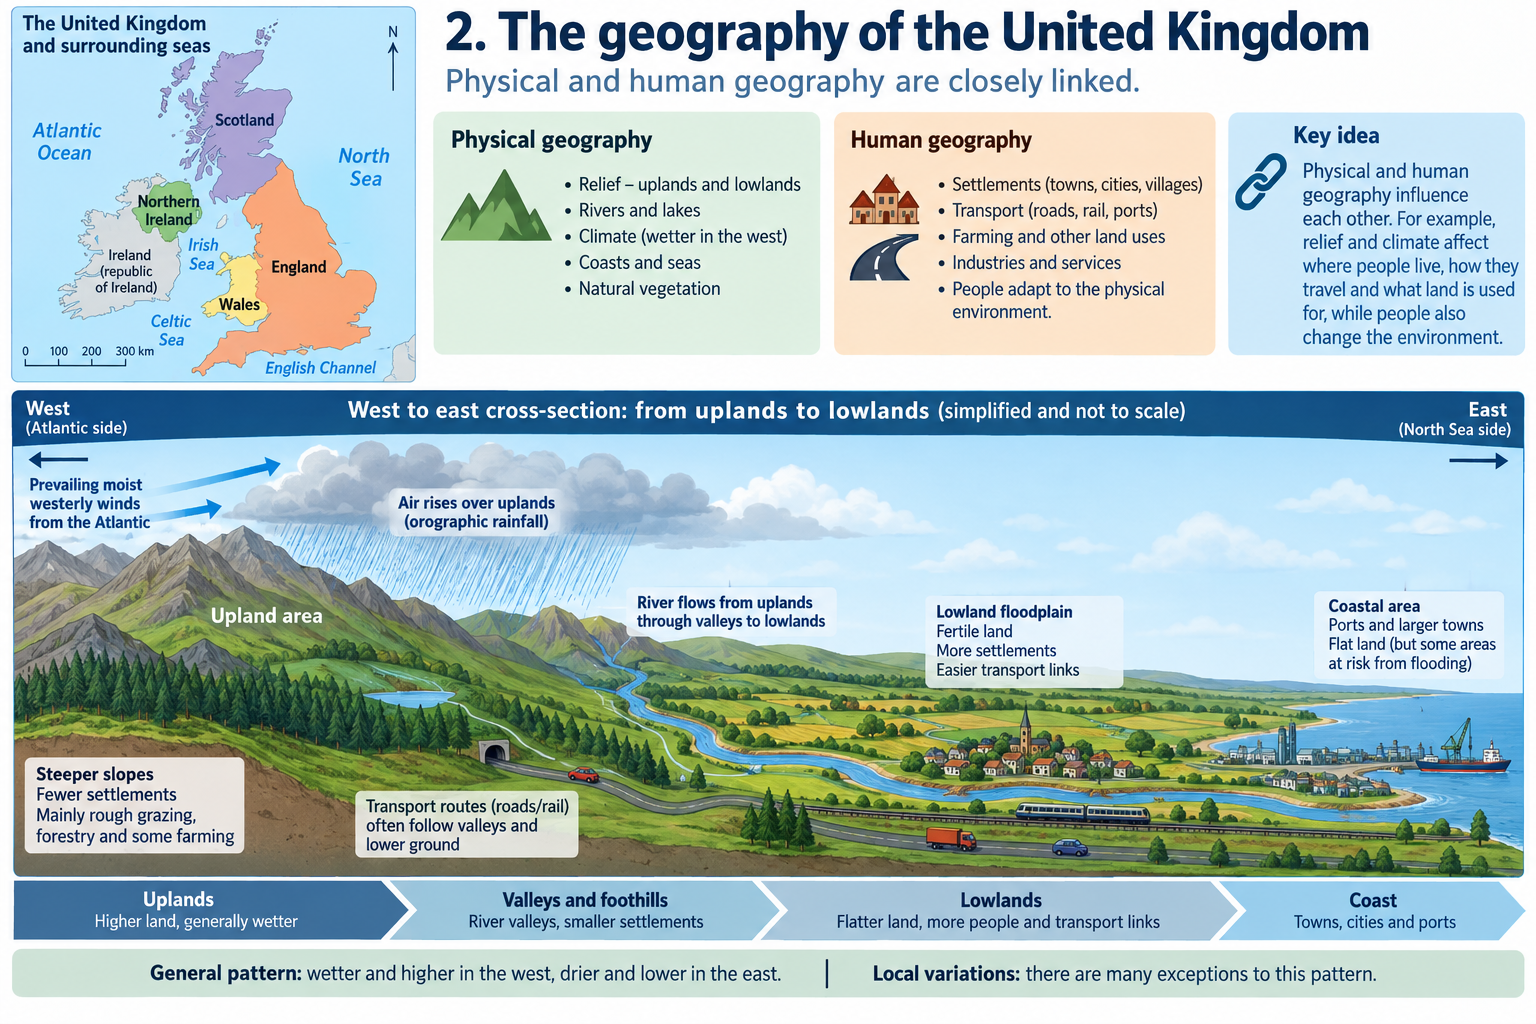
The UK lies off the north-west coast of mainland Europe. The Atlantic Ocean is to its west; the North Sea is to the east of Great Britain; the English Channel lies to the south; and the Irish Sea separates Great Britain from Ireland. The North Channel links the Irish Sea to the Atlantic between Northern Ireland and Scotland. The UK has a long, varied coastline, many islands and several large estuaries. Its position between the Atlantic and the European landmass affects connections, weather and trade, but no single factor explains the character of a place.
The United Kingdom is made up of four constituent countries: England, Scotland, Wales and Northern Ireland. Great Britain is the large island containing the first three. Ireland is a separate island shared by Northern Ireland and the Republic of Ireland, which is an independent state. The Isle of Man and the Channel Islands are not part of the UK. These distinctions matter when reading statistics or describing a route. A table labelled “Great Britain” may exclude Northern Ireland; a UK total normally includes it. Always check the geographical coverage in a dataset’s title or notes.
The four capital cities are London, Edinburgh, Cardiff and Belfast. They are not the only important cities, and a capital’s functions do not tell you everything about the surrounding region. Other cities and urban areas include Birmingham, Manchester, Glasgow, Liverpool, Leeds, Newcastle upon Tyne, Bristol and Nottingham. Which city appears largest can depend on whether the map or dataset measures a local authority, a built-up area, a metropolitan region or a wider commuting zone.
For a location description, move from broad to precise: “The Lake District is in north-west England, in Cumbria, inland from the Irish Sea, and west of the Pennines.” That sentence uses more than one reference point. On a map, north is usually at the top, but check the north arrow if the map is rotated. Grid references, latitude and longitude, a scale bar and named features can make a description more exact.
2. Relief, rock and landscape
Across the UK, higher and more rugged landscapes are widespread in Scotland, Wales and northern and western parts of England. Lower and generally gentler areas are more common in eastern and southern England. This is a broad pattern, not a straight boundary. Southern England has chalk downs and steep escarpments; the Midlands include hills; northern England contains fertile lowlands as well as uplands; and Scotland has extensive lowland areas as well as high mountains. Northern Ireland also contains both uplands and lowlands. Use a relief map rather than relying on a “north high, south low” slogan.
The underlying geology helps explain some landscape contrasts. Resistant rocks may remain as higher land while softer rocks are worn down more easily. Rock structure, jointing, permeability and the angle of strata also matter. The British Geological Survey explains, for example, how resistant granite contributes to rugged upland landscapes such as Dartmoor and Bodmin Moor. However, geology does not determine every land use: farming, forestry, roads, settlements and recreation also depend on climate, soils, access, investment, planning and historical decisions.
Scotland has three broad physical regions that help organise a map description. The Highlands occupy much of the north and west and include mountain ranges, glens, plateaus and islands. The Central Lowlands form a lower-lying belt between the Highlands and the Southern Uplands and contain major urban areas including Glasgow and Edinburgh. The Southern Uplands lie farther south and consist of rolling upland landscapes. These are broad regional labels, not uniform surfaces: each contains local variation in geology, land cover, population and access.
In Wales, upland areas dominate much of the centre and north, while lower-lying belts and coastal plains create contrasting settlement and transport corridors. Eryri (Snowdonia) includes high mountains, glacial valleys and lakes. The South Wales valleys descend from upland areas towards the coast and contain settlements shaped by past industrial development and more recent change. In England, the Pennines form a major upland spine, while the Lake District, Yorkshire Dales, North York Moors and south-west uplands create other distinct relief regions. Lowland landscapes include the Thames basin, East Anglian plains, the Vale of York and much of the Midlands.
Northern Ireland includes the Antrim Plateau in the north-east, upland areas around the Mourne Mountains in the south-east and lower land around Lough Neagh and river valleys. The Mournes rise sharply near the coast, illustrating how a relatively small area can contain strong changes in relief. Across the UK, landscapes are mosaics. A national map can show broad patterns, but a local map is needed to see valley shape, slope, river terraces, land cover or the edge of a settlement.
3. Weather and climate contrasts
The UK has a temperate maritime climate, but its weather varies from day to day and from season to season. The surrounding seas influence temperature and moisture. The prevailing westerly wind belt often brings Atlantic air and weather systems from west to east. Winds are not always westerly, so a particular day or season can differ from the general pattern. The sea’s influence is one reason that the UK’s climate differs from a strongly continental climate, but latitude, altitude, distance from the coast, cloud, aspect and circulation patterns also affect conditions.
In broad averages, many eastern and southern locations are warmer, drier and sunnier than many western and northern locations. The Met Office warns that this is only a summary: there is considerable regional and seasonal variation. Higher western uplands can receive substantial orographic enhancement. When moist air is forced up a slope, it expands and cools; water vapour condenses into cloud and precipitation. After crossing higher ground, descending air can be drier, contributing to a rain-shadow effect on the eastern side. The effect depends on the wind direction and local topography, so do not assume that every eastern location is dry or every western location is wet.
Temperature generally decreases with altitude because air pressure and density decrease with height, and the UK’s north is, on average, cooler than its south because it is farther from the equator. Coastal locations can have smaller temperature ranges than inland places because the sea warms and cools more slowly than land. These are tendencies that help form a hypothesis, not rules that predict every observation. A south-facing slope can receive more direct sunlight than a nearby north-facing slope, while cloud or local exposure can modify the difference.
Climate graphs help compare places when they use the same period, units and scale. Monthly mean temperature is usually shown by a line, and precipitation by bars. Read the axes carefully: some graphs use different scales for temperature and rainfall. Describe the pattern first—for example, “the west-facing upland site has higher precipitation in most months”—then offer a process-based explanation such as exposure to Atlantic air and forced uplift. Check the time period before treating climate normals as current weather. Climate is a long-term pattern; weather is the condition at a particular time.
4. Rivers, coasts and water
The UK has many river systems, but they differ in length, gradient, geology, rainfall, storage and the shape of their drainage basins. The River Thames flows through southern England to the North Sea estuary. The River Severn drains parts of Wales and western England before reaching the Bristol Channel. Other important rivers include the Trent, Tyne, Clyde, Tay, Forth, Mersey, Tees, Wye and Bann. A river crossing more than one national border can connect places and also create shared management questions.
Relief affects river gradients and the speed at which water moves downhill. Geology affects infiltration and groundwater storage: permeable rock can allow water to soak into the ground, whereas impermeable surfaces and soils can increase surface runoff, though real catchments contain mixtures. Rainfall intensity, soil saturation, vegetation, urban surfaces and river engineering affect the timing and volume of river flow. These factors interact. It is inaccurate to say that a place floods only because it receives heavy rain; the catchment’s response and exposure matter too. Rivers and flood risk are studied in more depth in the hydrology and rivers guides.
The UK’s coastlines include cliffs, beaches, estuaries, bays, islands and low-lying coastal plains. Coastal processes move sediment and continuously reshape land, while ports, roads, housing, tourism and conservation influence how people use and manage the coast. On the east coast, the North Sea faces mainland Europe; on the west, the Atlantic and Irish Sea influence exposure. But wave direction, geology, sediment supply and coastal defences create local differences. A coastline is not simply a fixed line on a map: it may retreat, accrete or be managed, and map dates matter.
Water is a resource as well as a physical process. Rainfall and demand are unevenly distributed; reservoirs, rivers, groundwater and transfer systems connect catchments to people and economic activity. A region’s water supply depends on rainfall, geology, storage and infrastructure, not on one climate map alone. Water use and water-resource management appear again in the GCSE option books.
5. Settlements, population and economic activity
People are not distributed evenly across the UK. Large urban populations are concentrated in major cities and connected urban regions, while more sparsely populated areas occur in many uplands, islands and rural areas. This pattern is related to employment, transport, services, historical development and physical geography. Relief can make some routes more costly to build and maintain, but a road or railway can also make a previously remote area more accessible. New infrastructure can influence where people and businesses choose to locate.
Urban does not mean only a city centre, and rural does not mean empty countryside. Villages may have substantial populations; commuter settlements can be connected to distant city jobs; and rural regions can include industry, tourism, agriculture, energy infrastructure and conservation. ONS statistical classifications use features such as settlement form, population and access. They classify statistical areas in a consistent way; they do not measure every aspect of how residents identify with a place. A large local authority can contain both urban settlements and extensive countryside.
Physical conditions can help explain opportunities and constraints. Gentler land can be easier for building major transport routes, but rivers, wetlands and flood risk may constrain development. Upland slopes and thin soils can limit some types of intensive agriculture but support grazing, forestry, tourism, conservation or renewable energy in suitable settings. Coastal locations can support ports, fishing, tourism and energy infrastructure, while also facing erosion, flooding and exposure. These are possible relationships, not automatic outcomes.
Economic geography also changes through time. Coal, iron, ports, water power and transport routes helped shape some older industrial regions. Deindustrialisation changed employment and land use in many former mining and manufacturing areas. Universities, health care, creative industries, financial services, logistics, tourism and advanced manufacturing have become important in different places, though the mix varies. A region can retain industrial activity while developing new employment. Avoid labelling a whole region as “declining” or “prosperous” based on a single measure or a few familiar images.
The UK is connected internally and globally by roads, railways, ports, airports, digital networks and supply chains. These connections make goods, people, ideas and services move between regions. They can create benefits, such as access to jobs and markets, and costs, such as congestion, pollution, land take and uneven investment. A transport corridor can connect a city to nearby regions while bypassing other communities. To evaluate a proposal, ask who can reach it, what it carries, who benefits, who bears the costs and at what scale.
6. Linking physical and human geography
Strong geographical explanations connect processes rather than listing features. One useful chain is: “The prevailing wind carries moist Atlantic air towards higher ground; the air rises and cools; condensation produces more precipitation; the high rainfall contributes to wet conditions and river flow; this can affect farming, roads, reservoirs and recreation.” Every step needs evidence or a plausible process, and the chain should not be presented as the only explanation for land use.
Another chain might connect relief and settlement: “A steep valley side restricts the amount of level ground; buildings and roads may cluster along the valley floor; this can concentrate development close to a river; planning then has to balance access and flood risk.” A real place may contradict part of the generalisation because engineering, wealth, planning and historical settlement patterns can change where development occurs.
Geographical patterns have different causes at different scales. At a local scale, slope, a bridge or a station may influence a settlement pattern. At a regional scale, geology, industrial history and transport corridors may matter. At a national scale, policy, migration, investment and international connections shape change. Do not use one scale of evidence to prove a claim about another. A local photograph can show a feature in one place; it cannot by itself show that the same feature is typical of the UK.
Place example
The following comparisons are illustrative teaching examples, not compulsory national case studies. Your school may use different named locations. The aim is to practise connecting evidence to process and to recognise differences within places.
Eryri (Snowdonia): upland landscape and changing use
Eryri in north-west Wales is a useful example of a mountain landscape. The area contains high relief, steep slopes, glacially shaped valleys, lakes and a coastline. Bedrock, past glaciation and continuing weathering and river processes contribute to its physical character. Relief and exposure help explain why weather, vegetation, access and land use can differ between valley floors, slopes and high ground. A map of the area can show the relationship between ridges, valleys, roads, rivers and settlements more clearly than a written description alone.
Human activity varies across this landscape. Settlements and transport routes often follow valleys or coastal corridors where gradients are gentler, but historic routes, engineering and modern road design have altered accessibility. Farming, forestry, tourism, conservation and recreation can occur in the same broader region. Mountain walking and other outdoor activities bring visitors and income, but they can also create pressure on paths, habitats, parking and local services. Tourism is neither automatically beneficial nor automatically harmful; outcomes depend on visitor behaviour, local jobs, ownership, infrastructure and environmental management.
To investigate Eryri, compare a topographic map with land-cover data and photographs from different viewpoints. Ask whether steep slopes correspond to fewer roads or buildings, then check for exceptions. A road may cross an upland area because a pass offers a practical route. A settlement may exist on a valley floor because water, routes or historic land use encouraged it, even though rivers can create flood risk. If using visitor or employment statistics, record the year and geographical unit; national-park boundaries and local-authority boundaries are not necessarily the same.
East Anglia: low relief, agriculture and water questions
Much of East Anglia is low lying relative to the western uplands and contains extensive agricultural land. The region includes coastal areas, river valleys, market towns and larger urban centres such as Norwich and Cambridge. A relief map can help explain why transport routes and fields may cross broad areas with fewer steep slopes, but it cannot explain the whole landscape. Soil properties, drainage, land ownership, farm technology, markets and planning also influence land use.
East Anglia is often used to illustrate the broad west–east contrast in UK rainfall. The Met Office’s regional summaries describe eastern areas as generally drier than western uplands, but this is an average pattern across time and space. It should not be turned into a claim that every part of East Anglia is dry all year. Water supply, river flow, agricultural demand and population demand interact. The region’s water challenges cannot be inferred from rainfall alone: storage, groundwater, water quality, conservation and infrastructure are relevant too.
This example is valuable because it complicates the assumption that a lowland is always easy to live in. Flat or gently sloping ground may support farming and transport, while low elevation can make some local areas sensitive to drainage and coastal flooding. Climate trends, land use, river engineering and sea-level change may alter those pressures. When comparing East Anglia with Eryri, compare actual evidence such as relief, precipitation normals, land cover, settlement density and route access. Do not compare an upland national park with an entire lowland region without noting that their sizes and boundaries differ.
Thames Valley and London: a river, a metropolis and connected land uses
The River Thames flows through a large region of south-east England and passes through London before reaching the North Sea. The Thames Valley contains settlements, transport corridors, farmland, open space and changing urban edges. London is a major national and international centre, but it is not representative of every part of south-east England or of the whole UK. The city’s growth reflects its river and port history, political and economic functions, transport networks, migration and investment, as well as its physical location.
The river has provided a route and resource for people and activity, while its estuary and floodplain create management questions. Urban growth increases demand for housing, water, transport and services. It can also increase the area of hard surfaces, which can change runoff patterns. Flood risk is shaped by river discharge, tides, rainfall, drainage, topography, defences and the location of people and buildings. A map showing a floodplain does not say that all places within it flood equally or that risk is unchanging; flood probability, depth, warning, exposure and defences must be considered.
Compare central London with a smaller Thames-side settlement and with the surrounding countryside. Look at land use, density, road and rail access, building age and distance from the river. A transect from the city centre outward can reveal how building density and function change, but the pattern may be interrupted by parks, airports, industrial zones or other centres. A local study should use an up-to-date map and make clear whether data refer to the city, a borough, a built-up area or the wider metropolitan region.
Belfast and Northern Ireland: a regional city in a coastal setting
Belfast is located near the eastern coast of Northern Ireland at the head of Belfast Lough, close to the mouth of the River Lagan. Its location links it to sea routes and to the lower Lagan valley. A relief map can show higher ground around parts of the city and lower routes through the valley. Like other cities, Belfast’s development reflects physical location, transport, industrial history, governance, investment and social change. It is not possible to explain its urban pattern through topography alone.
The city’s position is part of a wider network of settlements, roads and services across Northern Ireland. Northern Ireland’s population is not concentrated only in Belfast: towns, rural areas and smaller settlements form a varied settlement system. The Antrim Plateau and the Mourne Mountains provide contrasting upland settings; lower areas and the shores of Lough Neagh provide different physical environments. A comparison can therefore take place within one constituent country, avoiding the assumption that each nation has only one type of landscape.
Use a city map, aerial photograph and transport map to identify possible connections between topography and urban form. Then use population or employment data to test an explanation. A photograph might show a steep slope or a port facility, but a single image cannot establish how common that feature is. If you compare Belfast with London, choose a clear shared measure, state the dates and scale, and recognise their different population sizes and economic roles.
Maps, data and evidence
Read a relief map systematically
Begin with the title, legend, scale, north arrow, date and source. Identify the height interval between contour lines. Contours close together usually indicate a steep slope; widely spaced contours usually show a gentler slope. Contours form closed loops around hills and may form V shapes where they cross valleys. The direction of the V normally points upstream in a river valley, though you should check contour heights and drainage context. A spot height or trig point gives a stated elevation at a specific point; it is not the average height of the surrounding region.
Use a sequence of observations: “The land rises west of the settlement; the contours are close together on the valley side; the river and road follow a lower corridor.” Then explain cautiously: “The valley may offer a route with a gentler gradient than crossing the higher land.” Map evidence supports a possible explanation but may not show why a route was historically selected. For that, look for additional sources, such as older maps, historical accounts or transport-planning information.
Compare climate data fairly
When comparing climate graphs, check whether both use the same period and units. State the month or season and compare the same measure: temperature with temperature, rainfall with rainfall. Note whether the station is coastal, inland or at higher altitude. A climate normal describes an average over a defined period; it does not mean that every year or every day follows that average. Avoid saying “climate is changing because one month was warm”; long-term evidence is needed to identify a climate trend.
Suppose two illustrative stations show different annual precipitation totals, with a western upland station higher than an eastern lowland station. A sound explanation would mention that moist westerly air is often forced to rise over western uplands and loses moisture as it moves east. You should also check the stations’ elevations and locations. Do not invent a numerical difference if the graph does not provide it. The Met Office’s regional climate pages explain broad patterns and also emphasise regional variation.
Read settlement and population maps
A dot map may show the distribution of settlements or population. A choropleth map shades areas by a value, such as population density. Check the legend, data year, class breaks and unit. If the map shows total population, a large region may have a high value because it covers a large area. If it shows density, it describes an average per area but can hide contrasts within that area. A small area with a high density might contain a town, while a larger district may include both dense and sparse places.
Population density is calculated by dividing population by land area. If an imaginary district has 24,000 people over 120 square kilometres, its average density is 200 people per square kilometre. This calculation does not mean that 200 people live on each square kilometre; the distribution is likely uneven. Always name the geographical unit before comparing results. Differences in boundaries can create misleading comparisons even where the underlying pattern is similar.
The Office for National Statistics Rural Urban Classification is one example of a statistical framework. The ONS explains that the 2021 classification for England and Wales takes account of address density, settlement form, population size and relative access to major towns and cities. It is designed for consistent statistical comparison. It does not claim to capture every landscape, economic, historical or cultural feature that people associate with rural or urban identity. Scotland and Northern Ireland can use different classifications or geographies, so read the metadata before combining datasets.
Use photographs and maps together
An oblique photograph can show the shape and visible land use of a place. An aerial photograph can show the arrangement of streets, fields, rivers and buildings. Neither automatically reveals the reason those features are there. Locate the photograph on a map, check its direction and date, and identify what is inside and outside the frame. A photograph taken in one season may make vegetation or water levels look different from a photograph taken in another.
Combine sources to strengthen an explanation: use a contour map to describe relief, a climate graph to compare rainfall, a land-cover map to identify vegetation or built land, and an annotated photograph to show a local example. If sources appear to disagree, check when they were made, what they measure and the scale they cover. Different evidence may be describing different parts of the same place rather than giving contradictory accounts.
Common misconception
- “Great Britain and the UK mean the same thing.” Great Britain is one island containing England, Scotland and Wales. The UK also includes Northern Ireland.
- “The Republic of Ireland is part of the UK.” It is an independent state. Northern Ireland is part of the UK; both are on the island of Ireland.
- “The UK is uniformly wet, cool and flat.” Climate and relief vary substantially. Broad national tendencies have local exceptions.
- “The south is low and the north is high.” This is an oversimplification. There are southern uplands, northern lowlands and local variation everywhere.
- “Upland means uninhabited.” Uplands contain settlements, farms, roads, businesses and communities. Density and access vary from place to place.
- “Lowland means easy to build on.” Low elevation may coincide with flood risk, soft ground or drainage issues. Local geology, water and planning matter.
- “Rural areas are empty and cities are self-contained.” Rural places have populations and economic activity; cities depend on wider flows of workers, goods, water, energy and services.
- “Physical geography decides land use.” Physical conditions create opportunities and constraints, but human choices and infrastructure also shape outcomes.
- “A map proves why a pattern exists.” A map can show where a pattern occurs. Explaining why usually requires more than one source and a process-based argument.
- “An average describes every location.” A regional mean can conceal differences among valleys, slopes, neighbourhoods, coastal sites and settlements.
Self-check
Recall
- Name the four constituent countries of the UK.
- What is the difference between the UK and Great Britain?
- Which sea lies east of Great Britain? Which sea lies between Great Britain and Ireland?
- Name one UK upland region, one lowland region, and one major river.
- What does relief describe?
- What is the difference between weather and climate?
- What is a drainage basin?
- Give one reason that people may cluster in a settlement corridor.
- What information should you check before comparing two climate graphs?
- Give one reason why population density is an average rather than a description of every location.
Explain
- How can moist air and upland relief combine to increase precipitation?
- Explain one way that relief can influence transport without determining exactly where a road is built.
- Why could a lowland area have a flood-management challenge?
- How can a river provide opportunities and create risks for people?
- Why might urban and rural classifications differ between statistical datasets?
- Explain how a region can change economically while keeping some older industries.
- Why should a climate normal not be used to predict the weather on one particular day?
- What additional evidence would help you test whether an upland region is less densely populated than a nearby lowland region?
Apply
- A relief map shows a steep ridge between two towns. The road crosses the ridge at a lower pass. Give a possible geographical explanation and identify one other factor you would investigate.
- A western station and an eastern station have different long-term rainfall averages. Write a two-sentence description and explanation that mentions the wind, relief and one possible exception.
- A choropleth shows high population density in a small area and lower average density in a large neighbouring district. What can you conclude, and what can you not conclude without more detailed data?
- A tourist photograph shows a crowded mountain car park on a sunny weekend. Name two conclusions it can support and two conclusions it cannot support on its own.
- A town lies beside a river on low-lying land. Identify one benefit of the location, one potential risk and two kinds of evidence needed for a balanced judgement.
- Design a simple comparison between Eryri and East Anglia. Select three physical indicators and two human indicators, state what map or dataset you would use, and predict one possible relationship.
Suggested answers and reasoning
- England, Scotland, Wales and Northern Ireland.
- Great Britain is the island containing England, Scotland and Wales. The UK is the state that also includes Northern Ireland.
- The North Sea is east of Great Britain; the Irish Sea lies between Great Britain and Ireland.
- Examples include the Scottish Highlands, the Pennines, Eryri, the East Anglian plain, the Thames, the Severn or the Clyde. Check that the named feature is in the UK and use a map to locate it.
- Relief describes differences in elevation and slope across a land surface.
- Weather is short-term atmospheric conditions; climate is the longer-term pattern of weather over a stated period.
- It is the area drained by a river and its tributaries, bounded by a watershed.
- A valley may provide a flatter route, access to water, a crossing point or historical connections. A real answer needs local evidence.
- Check units, period, station location, altitude, graph scales and what the bars or line represent.
- People are distributed unevenly within a geographical area, so the calculated value summarises the whole area.
- Moist air forced up a slope expands and cools; water vapour condenses into clouds and precipitation. Wind direction and local topography affect where the strongest uplift occurs.
- Steeper slopes can increase construction difficulty and cost, so routes may follow valleys or cross at passes. Existing infrastructure, demand, engineering and planning can change the final route.
- A lowland may include a floodplain or low-lying coast. Risk also depends on water levels, drainage, defences, exposure and vulnerability.
- Rivers can support water supply, transport, power, recreation or fertile land. They may also flood, erode banks or carry pollution. The balance depends on location and management.
- Frameworks can use different spatial units, thresholds and measures. Read each classification’s method before comparing it with another.
- Some older industrial activity may continue while new services, technology, tourism or advanced manufacturing develop. Use employment and land-use evidence over time rather than a label.
- A climate average smooths many years of observations. One day’s conditions vary with current air masses, fronts and local weather systems.
- Use population-density data at a consistent scale, settlement maps, accessibility or service data, and relief. State dates and definitions and look for exceptions.
- The pass may offer a lower-gradient route through the ridge. Check geology, river valleys, population, existing roads, engineering and historic routes before claiming a cause.
- A strong response first describes the observed difference without inventing values. It then explains how prevailing westerlies and uplift may contribute, while noting that wind direction and local exposure can create exceptions.
- You can conclude that the first statistical area has a higher average density. You cannot conclude that every part of it is crowded, that it has a larger population, or that the same pattern applies to both districts internally.
- It can show that cars and visitors were present at the place and time photographed, and that a parking facility exists. It cannot show the annual visitor total, typical congestion, local employment effects or year-round environmental impact.
- A river can offer water, transport or amenity; low land may be exposed to flooding. Compare flood maps or records, elevation, defences, population, land use and river data.
- A valid design uses the same units and dates where possible—for example, elevation, slope and rainfall; then settlement density and road access. Explain the scale mismatch if comparing a national park with a whole region.
Revision points
- Know the four countries and distinguish the UK, Great Britain and Ireland.
- Describe a location from broad to precise, using seas, directions and named features.
- Read relief, climate and population maps by checking the legend, scale, date and units.
- Explain patterns through a chain of physical processes and human decisions, then acknowledge exceptions.
- Compare like with like: choose compatible scales, boundaries, periods and measures.
- Use named regions as examples, not as stereotypes. Eryri, East Anglia, the Thames Valley and Belfast illustrate different combinations of relief, climate, settlement and economic change.
- For an extended answer, state the evidence, explain the process and consider another factor before reaching a conclusion.
Curriculum alignment
- Curriculum coverage IDs:
ks3.place-based-exemplars,ks3.human-physical-interaction - Related practice packs:
ks3_geography_uk_geography - Shared concept tags:
uk-geography,place,relief,settlement
Sources
- Curriculum/specification: Department for Education: National curriculum in England — Geography programmes of study
- Place-name and territory definitions: GOV.UK: Toponymic guidelines for map and other editors — United Kingdom
- Climate patterns: Met Office: UK regional climates
- Rainfall and orographic enhancement: Met Office: How much does it rain in the UK?
- Relief and geology: British Geological Survey: Relief
- UK geological regions: British Geological Survey: Regional geological summaries
- Settlement classification: Office for National Statistics: 2021 Rural Urban Classification
- Use the period, geographical unit and method stated by each source. Climate normals and classifications are time-bound datasets; consult current figures for local investigations.