 FoxChild@Learn
12. Settlements, land use and urban change
Curriculum status: Required core content.
This guide follows the England Key Stage 3 Geography programme of study. It explains why settlements are located where they are, how their functions and land uses vary, how towns and cities change, and how urban places connect with their rural surroundings. Bishop Auckland in County Durham is used as an illustrative example of a market town shaped by religious power, trade, coal and railways, then by industrial decline and heritage-led regeneration. It is not a required national case study.
A settlement is more than a collection of buildings. It is a place where people live, work, travel, exchange goods, use services and make decisions about land. Its pattern reflects physical setting and human choices over time. A river crossing or a sheltered harbour may help explain an early location, while a motorway, factory closure, new school, conservation rule or housing programme may help explain later change.
The word “urban” can describe a statistical category, a built-up pattern or a place with particular functions. Those meanings do not always share a boundary. In the 2021 Census, the Office for National Statistics used built-up areas based on mapped developed land; in other datasets, a local authority, a commuting region or a national urban definition may be used. Always identify the area and measure before comparing settlements.
Required knowledge
- Describe rural, urban and intermediate settlement patterns, while recognising that categories form a connected continuum.
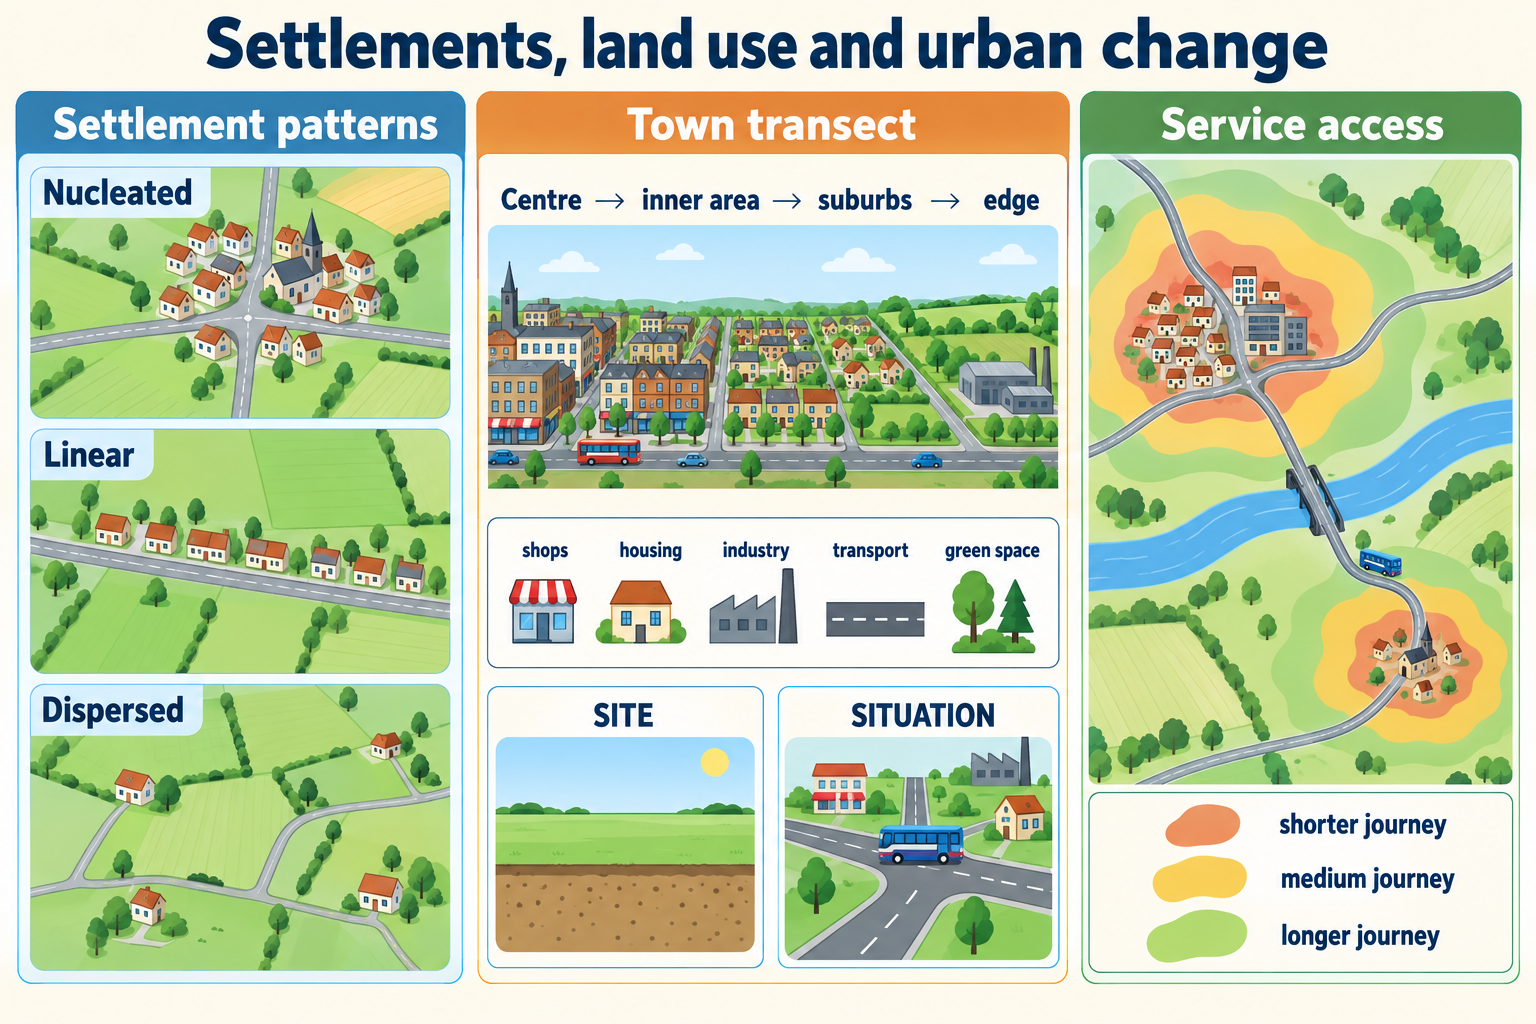
- Explain the difference between site, the physical location of a settlement, and situation, its connections and position relative to other places.
- Explain how water, relief, climate, geology, resources, defensibility, routes, trade, services and employment can influence a settlement's location and growth.
- Describe settlement functions and compare villages, market towns, larger towns, cities and conurbations using evidence rather than a perfect ranking ladder.
- Recognise common land-use patterns and explain why housing, industry, retail, offices, transport, public services and green space can cluster in different locations.
- Describe how transport routes, new employment, changing technology, population, planning, land values and investment can alter urban and rural land use.
- Explain that models of city structure are simplified tools and that real settlements have different histories and mixed-use areas.
- Explain how a settlement interacts with its rural hinterland and natural systems through food, water, energy, employment, waste, recreation and travel.
- Interpret maps, aerial photographs, population data and field observations from different dates; distinguish direct evidence from a proposed explanation.
- Consider how regeneration and development affect different residents, businesses, landowners and visitors in different ways.
Key vocabulary
| Term | Meaning |
|---|---|
| settlement | A place where people live, work and carry out activities, from a single hamlet to a large city. |
| site | The physical characteristics of the exact location where a settlement is built. |
| situation | A settlement's position in relation to other places, routes, resources and connections. |
| relief | The height and shape of the land. |
| drainage | The movement of water from an area through streams, rivers and groundwater. |
| accessibility | How easily people and goods can reach a place by available routes and modes. |
| function | The main role or activity associated with a settlement or part of one. |
| service | A facility or activity that meets needs, such as a school, shop, clinic or bank. |
| settlement pattern | The arrangement of settlements across an area, for example clustered, linear or dispersed. |
| linear settlement | Buildings arranged mainly along a route, valley, coast or other narrow feature. |
| nucleated settlement | A group of buildings clustered around a centre such as a square or crossroads. |
| dispersed settlement | Buildings spread across a wider area rather than grouped in one compact centre. |
| settlement hierarchy | A model that groups settlements by size, service range or influence. |
| sphere of influence | The area from which a settlement draws users, customers or workers for a stated function. |
| threshold population | The minimum number of customers needed to support a service or business. |
| range | The maximum distance many people are willing or able to travel to use a service. |
| land use | The activity or purpose for which land is used. |
| land-use zone | An area in which a particular land use is common, although other uses may be present. |
| central business district (CBD) | A traditional central area with many shops, offices and services; its mix varies between settlements. |
| inner city | A broad term for areas near a centre, often shaped by older housing, industry and transport; conditions vary. |
| suburb | A mainly residential or mixed-use area on or near the edge of a larger settlement. |
| rural–urban fringe | A transition zone where built-up land and countryside meet and uses can compete. |
| greenfield site | Land that has not previously been developed in an urban use, often open land at a settlement edge. |
| brownfield site | Land previously developed or used for an urban purpose that may be reused or redeveloped. |
| urbanisation | An increase in the proportion of a population living in areas classified as urban. |
| urban growth | An increase in the number of residents or the built-up area within a defined urban boundary. |
| urban sprawl | Outward expansion of built-up land, often at relatively low density. |
| infill development | Building on small gaps or underused land within an existing built-up area. |
| regeneration | Coordinated change intended to improve the physical, economic, social or environmental condition of a place. |
| re-use | Giving a building or site a new function while retaining some of its existing structure or character. |
| gentrification | A process in which investment and higher-income households change a neighbourhood, sometimes displacing existing residents. |
| commuting | Regular travel between home and work or education. |
| rural hinterland | Rural places connected to and served by a nearby town or city. |
| accessibility | Ease of reaching a location; it depends on routes, cost, mobility, time and service availability. |
| conurbation | A large continuous built-up area formed as neighbouring settlements expand and join. |
| green infrastructure | Connected natural and semi-natural features such as parks, trees, waterways and paths. |
How the geography works
Settlement geography links location, function and change. A site's relief, soil, water supply and exposure can influence what is practical to build. Its situation—its links to routes, markets, nearby settlements and resources—can influence trade and movement. These conditions interact with technology, employment, planning and residents' decisions. The first site advantage does not determine a place's whole future: new transport or economic change can alter its role.
Land uses compete for space. Housing, shops, workplaces, roads, schools, parks and utilities all need land and connections. Their locations reflect land costs, access, environmental constraints and planning choices. A map may reveal a pattern, but the pattern alone does not show who made the decision, whose needs were prioritised or what will happen next.
1. Settlement patterns and types
Rural, urban and the settlements between
Rural settlements include hamlets, villages, small towns and dispersed farms. Urban settlements include towns and cities of different sizes and functions. Between them are suburbs, peri-urban districts, market towns linked to cities and settlements whose daily services or employment connect them to several places. Rural and urban are useful categories, but they do not divide every place neatly into two kinds.
Settlement pattern describes the arrangement of places across a region. A clustered pattern may occur around a market square, river crossing, harbour or resource. A linear pattern may follow a road, valley, coast or railway. A dispersed pattern can be associated with isolated farms, large holdings or challenging terrain. Patterns can mix: a village may have a compact centre and separate farms around it, while a new suburb may extend in a corridor along a road.
Use a map to describe where settlements are, then explain the pattern with evidence. Do not assume a line of buildings follows a river just because the two appear close on a small-scale map. Compare a larger-scale map, relief, route and field evidence. A settlement may follow a ridge road rather than a valley, or a historic railway may shape the street pattern after the railway itself has closed.
Reading settlement form across a landscape
The shape of a settlement can preserve evidence of the landscape and decisions that formed it. A compact village may cluster near a church, green, market place, bridge or spring. A linear settlement may stretch along a road, valley floor, canal or coast, where movement or level ground concentrates building. A dispersed pattern may contain farms, hamlets and isolated houses spread across a productive or historically divided landscape. These patterns are clues, not proof: compare the map with relief, water, route history and land-use evidence before proposing a cause.
At a larger scale, describe a settlement's morphology: its street pattern, building blocks, open spaces and relationship to natural features. Streets may radiate from a market centre, run in a grid created during planned expansion, or curve around topography. Modern developments can use cul-de-sacs and distributor roads to limit through-traffic; this may make local streets quieter while lengthening walking routes to shops or bus stops. An old route can survive as a narrow street even after its original function has disappeared. Historic maps help distinguish inherited form from recent additions.
Settlement shape is also influenced by boundaries. Rivers, steep slopes, railway lines, motorways, parks and protected land can contain growth or channel it along particular corridors. A settlement may therefore expand as a finger following a road rather than as a complete ring. The same barrier can create different effects: a river crossing may connect neighbourhoods at one bridge but make trips much longer where there is no crossing. Check whether the map shows a physical barrier, a legal boundary or simply a line drawn for statistical reporting.
Use precise description before explanation. “The houses are arranged in a narrow band beside the B-road and widen around the historic centre” is more useful than “the settlement is linear.” Then ask whether the pattern matches a route, slope, river terrace or land boundary. A second map date can show if the band has grown, if separate clusters have joined, or if a bypass has changed the centre's through-traffic. Aerial photographs may reveal recent housing estates, but their date and image scale determine what can be identified.
Settlement size and hierarchy
A settlement hierarchy groups places by size, services or influence. A simple model might show a hamlet, village, small town, larger town and city. Larger places often offer a wider choice of specialist services because they draw on more customers. A small settlement may have a primary school and local shop, while a larger centre may support hospitals, colleges, department stores or courts.
The hierarchy is a model, not a perfect ladder. A small settlement can attract visitors to a unique university, port, festival or historic site. A larger town may lack a particular service that is available in a neighbouring centre. Administrative population totals may differ from the area served by a school, hospital or shopping centre. Use a named function and its catchment rather than deciding that one settlement is “higher” in every respect.
Two geographical ideas help explain why a service is found in one place:
- The threshold is the minimum customer population or level of demand a service needs to remain viable.
- The range is the distance people are willing or able to travel to use it.
A corner shop can have a low threshold and a short range: many residents can use it, but it does not need to attract people from far away. A specialist hospital may require a larger population to support its staff and equipment, and patients may travel much farther. These are useful models. Actual service locations also depend on budgets, transport, policy, technology and the choices of businesses or public bodies.
Service catchments and uneven access
A catchment is the area from which a service draws users. It is not necessarily a neat circle around a building. A river, hill, motorway, railway crossing, bus route or local-authority boundary can shape where people travel. Two households the same straight-line distance from a school may face different journey times if one has a direct bus and the other needs to change vehicles. A catchment can also vary by time: a shop may mainly serve nearby residents during the day and commuters near a station at peak hours.
Service range and threshold help make a prediction, but access requires more than distance. Consider opening hours, price, appointment availability, disability access, language, digital access, safety and whether a person can travel independently. A settlement with a nearby hospital may still lack access to a particular treatment; another resident may reach the service by public transport while someone else depends on a car. “Near” on a map is therefore not the same as “easy to use.”
To investigate a catchment, choose one service and record a clear definition of access. A school study could map pupils' anonymised travel origins by broad zones, while a town-centre survey might record which bus routes bring visitors. Do not collect names, exact home addresses or personal health details. A simple route-time map, timetable check or set of carefully designed interviews can show how access varies. State the limits: a short survey at one entrance or one time of day may miss users who arrive by other routes.
Different services make different location choices. A small convenience shop benefits from nearby customers and frequent visits. A large supermarket needs a broad catchment, suitable road access and enough land for a building and parking; this can make it easier to reach by car than on foot. A school, health centre or library may be planned to meet a public need even when it is not the most profitable location. Public transport, land price, planning policy and the availability of existing buildings shape the final site.
These patterns can produce unequal service access. If a bus route is reduced, people without cars may lose practical access even though the shop, college or clinic remains open. A service closure can make a settlement's dependence on another centre greater, with effects on travel cost and time. The geographic question is not simply which place has the most services; it is who can reach which service, by what means, at what time and with what cost. Compare groups and routes while protecting the privacy of people who provide evidence.
Settlement functions
A settlement may have several functions at once:
- Residential: people live there, even if they travel elsewhere for work.
- Market or retail: shops and markets sell goods to local and visiting customers.
- Industrial or logistics: factories, workshops, depots or distribution centres provide employment and move materials.
- Administrative: councils, courts, government offices or civic institutions serve a wider area.
- Transport: roads, stations, ports or airports connect people and goods.
- Education and healthcare: schools, colleges and hospitals meet needs across different catchments.
- Tourism and recreation: heritage, scenery, events or leisure attract visitors.
- Religious or cultural: buildings, institutions and events serve particular communities or wider regions.
Functions can change. A town founded around a religious estate may later become an important market, railway or industrial centre. A coastal settlement can shift from fishing or shipping towards tourism. A former industrial district may gain housing, offices, education or arts uses. A place may also lose functions when a factory closes, a station is removed or services consolidate elsewhere.
2. Site, situation and location choices
Site: the physical location
Site describes the characteristics of the land on which buildings stand. In the past, water supply and defence were important for many settlements. People could favour a river terrace above a floodplain, a sheltered bay, a crossing point, a spring, fertile soils, a gentle slope or ground with useful resources. Steep slopes, unstable ground, exposure, flood risk or limited water may make some sites more difficult or costly to use.
These are possibilities, not a universal checklist. A river crossing could support movement and trade but also expose a settlement to floods. A high point could help with defence or visibility but be difficult to supply. Fertile land may support food production but be lost if settlement expands across it. The value of a site depends on the technology and needs of people at the time.
Modern engineering changes what is possible but not without cost. Foundations, drainage, tunnels, retaining walls, water treatment and flood barriers can enable construction on sites that were once difficult. They can shift risk or alter ecosystems. A place may be technically buildable but poorly connected, expensive to insure or unsuitable under planning rules.
Situation: connections and position
Situation is a settlement's location relative to other places and routes. A site might be good for a crossing, while its situation makes it a useful meeting point between different regions. A town at a route junction may connect farmers, manufacturers and customers. A port may serve a large hinterland if road and rail networks link it to inland places.
Situation changes as transport changes. A settlement next to a canal may grow when freight uses the canal, then lose that advantage when rail or road transport becomes more important. A new motorway junction can improve access to a city but may bypass a nearby town. A rail station can widen access to employment, education and services; the benefit depends on frequency, cost, walking connections and who can use it.
Do not confuse proximity with accessibility. Two places may be close on a map but separated by a river, steep terrain, a railway barrier or an infrequent bus. A more distant city may be easier to reach by express train than a nearby town on a circuitous route. Travel-time maps, public-transport timetables and field observation add evidence to straight-line distance.
Why settlements began where they did
Settlement origins often combine several influences. A route through a gap in hills, a bridge or ford, a navigable river, a harbour or a spring can attract movement and exchange. A defensible site may have had importance in a period of conflict. A religious institution or estate can create a centre for work and services. Mineral resources can support extraction, processing and related transport.
An origin explanation should match the settlement's history. A market square might indicate an early role in trade, but a photograph of a square alone cannot tell when the market began or why that place was selected. Historical maps, archaeological evidence, local records and reliable place histories help test the explanation.
Location can shape later land use
Land that is flat, accessible and close to a market may attract several uses. As transport improves, locations that once sat at the edge of a town may become central. Former industrial land can be reused for housing or offices when manufacturing moves, while distribution centres may seek space near a ring road. A new school, hospital or station can become an anchor for services around it.
Change may also be constrained. A river, railway cutting, steep slope, conservation area or protected habitat can limit development or channel it along a narrow corridor. Such constraints may protect valued landscapes but also affect the cost and location of housing. A good account explains both opportunities and limits.
3. Land use within settlements
Why land uses cluster
Some land uses benefit from being close together. Shops, banks, cafés and public services can share a central location where many people pass. Offices may locate near stations or other employers. Housing can cluster around local schools, parks and shops. Industry and freight may seek larger sites with road or rail connections and separation from homes.
However, many places contain mixed land use. A town centre may have flats over shops, a school beside housing, small workshops near a market or a park beside a road. A zoning map simplifies a more complex landscape. It identifies a dominant activity or planning category, not every activity that takes place in each building.
A town-centre pattern
The centre often has high accessibility because routes meet there and services can reach many people. This may raise land values and encourage uses that need customer access or visibility. Retail, civic buildings, offices, markets, leisure and transport interchanges can cluster. The exact mix depends on the town's size, transport, history and economic role.
Some centres change when shopping habits, work, housing or transport change. Online retail, large out-of-town stores, office working and redevelopment may affect pedestrian numbers and demand for premises. Empty shops can signal pressure but do not explain its cause alone. Compare vacancy evidence over time, business mix, rents, building condition and access.
Town centres can adapt by adding housing, health facilities, cultural venues or workspace alongside shops. This may bring residents and activity at different times of day, but it can also raise costs or remove affordable premises. A proposal should be evaluated through its likely effects on residents, existing businesses, access, heritage and public space.
Suburbs and the edge of a settlement
Suburbs often contain housing, schools, local shopping and open spaces, with connections to a larger centre. They vary in density, age and design. Some developed around older villages absorbed by a city; others were built as planned estates or as private developments along new transport routes.
The rural–urban fringe is a changing zone where urban and rural land uses meet. Housing estates, retail parks, allotments, farms, sports grounds, business parks, roads, parks and protected habitats can sit near each other. Land may be relatively available at the edge, but development can fragment habitats, increase car travel or place pressure on roads and drainage.
Greenfield development uses land that has not previously been developed in an urban use. Brownfield development reuses land that was previously developed or used for an urban function. Neither label tells us on its own whether a project is sustainable. A brownfield site may have contamination, ecological value or poor connections; a greenfield site may be well served by public transport but remove productive soil. Examine the actual location and alternatives.
Simple models of urban structure
Urban geographers have created models to explain broad patterns. A concentric-zone model imagines rings around a central business district; a sector model imagines wedges along transport routes; a multiple-nuclei model imagines several centres for employment and services. These diagrams help students ask where land uses cluster and how transport or land value may influence them.
Do not treat a model as an exact map. Many models were based on particular cities and periods. Modern cities have multiple centres, historic districts, parks, planned estates, airports, industrial corridors and mixed-use areas. Physical barriers, local policy, cultural history and economic change produce exceptions. A model should be tested against a real map and used to explain selected patterns rather than to label every neighbourhood.
4. How settlements grow and change
Population and housing
Population change can create demand for housing, schools, health care, transport and utilities. Households become smaller or larger; people move for study, work, family, safety or housing; births and deaths alter the population structure. Different kinds of housing are needed by students, families, older people, people with disabilities and households on different incomes.
Housing pressure does not result from population numbers alone. The supply, type, location and affordability of homes matter. A settlement may have empty properties and still lack suitable housing if they are in the wrong place, require major repair, are unaffordable or do not match household needs. Compare dwelling completions, tenure, vacancy, cost and access before explaining shortage.
Development can use infill within the built-up area, convert existing buildings, redevelop brownfield land or expand onto greenfield land. Infill can make better use of serviced locations but may reduce small open spaces. Re-use can preserve historic structures but require adaptation. Edge expansion can provide larger housing sites but extend travel distances and infrastructure. No option is impact-free; consider design and connections.
Transport and accessibility
Transport links can extend a settlement's reach and change land values. Rail, roads, buses, walking and cycling networks influence which places are practical for work and services. A new station can make a town more accessible to a larger labour market. A bypass may reduce traffic in the centre yet redirect spending or business. A road may help a distribution centre but add noise and barriers for nearby residents.
Transport accessibility is not evenly shared. A household with a car has different options from a person who cannot drive, cannot afford fares or lives far from frequent buses. Children, older residents and people with mobility needs may experience route design differently. A map of routes should be paired with service frequency, fares, travel time, crossings and the locations of homes or services.
Economic change and land-use change
When an industry grows, settlements may gain jobs, housing and services. Processing sites and workers' housing can appear close to a resource or route. When an industry declines, industrial land may become vacant; residents may travel farther for work; and shops can lose customers. New sectors can emerge, but a new job may need different skills or be located elsewhere.
Economic change can leave visible evidence: workshops, railway sidings, warehouses, workers' housing, reused factories and empty shop units. A building can retain its shape after its function changes. Compare old and new maps, street names, building dates, employment data and business directories. An old railway route converted into a road or path is a clue to change, not proof on its own of exactly when or why the railway closed.
Regeneration and who benefits
Regeneration coordinates physical, economic, social or environmental change. It may repair historic buildings, improve public spaces, support businesses, create housing, provide training or attract visitors. A successful project can make a place more accessible and increase local activity. It also needs a clear question: successful for whom, by what measure, and over what period?
Benefits and costs may be uneven. A restored square can make a centre more attractive, but construction can disrupt traders. New visitor spending can support cafés and museums, while seasonal jobs may be low-paid or insecure. Rising demand can improve property values for some owners and increase rents for others. Residents may gain new facilities yet feel that familiar services are being replaced.
Gentrification is not simply any improvement. It describes neighbourhood change involving investment and an increase in higher-income households or property values, which may displace people or businesses with fewer resources. A careful study uses housing and rent data, tenure, business change and residents' perspectives. It does not label every renovated building as gentrification.
Planning and competing priorities
Planning decisions shape where housing, shops, workplaces, roads and public spaces may be built or changed. Plans may identify settlement boundaries, town-centre areas, sites for homes or industry, transport investments and protected places. Residents, landowners, businesses, councils, developers and environmental groups may disagree because they value different outcomes.
A planning proposal can be assessed with questions such as:
- What need is it intended to meet?
- Where is the site, and how accessible is it?
- Which land uses or communities would change?
- What physical risks or environmental assets are present?
- How would people reach work, school, shops and services?
- Who pays for roads, drainage, buses, utilities and public space?
- Who receives benefits, and who may face costs or disruption?
- What evidence could show whether the project worked later?
A plan is a proposal or framework, not evidence that the development has happened. Check the date, status and area covered. Local planning policies can be revised, and a government framework can change. For a classroom example, describe the principles and identify the current adopted plan only if you have checked its publication date.
5. Settlements and their rural surroundings
The rural hinterland
A town or city relies on connections beyond its built-up edge. Rural places may provide food, water, timber, energy, recreation, minerals or land for infrastructure. They may also contain commuters who work in a nearby town, and residents who travel to urban hospitals, colleges and shops. A city can send jobs, visitors, investment, treated water, waste and pollution in return.
The relationship is not simply that the city takes resources from the countryside. Farmers may sell into urban markets; rural residents use urban services; city residents visit rural landscapes; and urban demand can support rural jobs. However, competition can occur over water, land, housing, roads, energy projects and habitat. Explain a specific flow and identify who controls or benefits from it.
Food often travels through supply chains involving processors, warehouses, shops and transport. The food consumed in a settlement may come from farms hundreds or thousands of kilometres away. Urban land may also contain allotments, community gardens or peri-urban farms. A local food map cannot show the full supply chain without additional evidence.
Water, energy and environmental systems
Settlements need reliable clean water for homes, schools and work. Supply may come from local rivers, reservoirs, aquifers or transfers between regions. Roads and buildings can cover soil, change runoff and add pollutants to drainage. Wastewater treatment returns water to rivers or the sea under regulated conditions, while leaks, drought and infrastructure capacity can affect supply.
Energy systems connect settlements to generating stations and networks. Electricity can be produced far from the places that use it. Energy infrastructure can provide jobs or reduce emissions, but pylons, wind turbines, solar arrays, substations or extraction sites also occupy land and may affect landscapes, habitats or communities. Evaluate each site in its wider network rather than assuming urban or rural locations are inherently better.
Green infrastructure inside settlements includes parks, street trees, riverside paths, gardens, ponds and connected habitats. It can support recreation, shade, biodiversity and water management. Its benefits depend on location, maintenance and access. A large park may be difficult to reach for some residents; small connected green spaces can provide more local access. Trees can cool streets but need suitable species, water, soil and long-term care.
The urban–rural fringe as a fieldwork setting
The edge of a settlement is useful for studying change because land uses often sit side by side. A student can map buildings, gardens, roads, agricultural land, hedges, water, parks and construction. Repeat the survey at another edge or date to compare the process. Take care to use public paths, respect private land, follow school safety guidance and avoid entering construction sites or traffic areas.
Do not assume that every field at the edge will become housing. Land may be protected, unsuitable, needed for food production or poorly connected. A development can be proposed and later changed or rejected. Look for dated plans and decisions before claiming that urban expansion is certain.
Place example
Bishop Auckland: location, function and change
Bishop Auckland is a market town in County Durham, around 18 kilometres south-west of Durham. Historic England describes its early settlement as developing beside the bishops' residence and a triangular market place. Its location on a plateau overlooking the Weardale valley, its connections to the surrounding landscape and the influence of the Bishops of Durham helped shape the town's early role. This provides a way to connect site, situation, authority and function using a named place.
The town's situation changed when railways arrived. Historic England reports that the first railway reached Bishop Auckland in 1842. Several lines followed, and by the end of the nineteenth century the town was an important transport hub. Railways carried coal and other freight as well as passengers, and encouraged related industries. The tracks, bridges, cuttings, workers' housing and street patterns altered both the town and the nearby landscape.
This change shows why situation is not fixed. A market town connected to regional roads and a bishop's estate became a railway and industrial centre. The coalfield supported mining, while rail connections moved materials to other places. The railway did not simply pass through a finished town: its arrival created new routes, jobs, workshops, yards, housing and links that changed the function and urban form.
Industry later declined. Historic England notes that former railway routes, industrial housing street patterns and buildings still reveal the earlier period, even where the original work has gone. The present-day settlement is not a blank slate: roads, buildings, land ownership and heritage features constrain or guide reuse. Reading an old map alongside the modern street plan can reveal how a past function remains visible.
From 2018 to 2023, Bishop Auckland had a Heritage Action Zone involving Historic England and local partners. Its stated aims included addressing decline in town-centre vitality and the condition of historic buildings, and supporting local quality of life. Activities included historical research, building work, public realm projects, skills and community engagement. Historic England describes efforts to diversify the centre towards a visitor economy. This is evidence of a regeneration approach, not proof that every resident has benefited equally or that the town's economic challenges have ended.
How to study the town at several scales
At town-centre scale, locate the market place, civic and heritage buildings, shops, visitor facilities and transport links. Record which buildings contain mixed uses, which appear vacant, and where pedestrians gather. Use a consistent route and time if comparing footfall. A one-hour observation on a market day cannot represent the whole week.
At neighbourhood scale, compare central streets with residential areas and former railway or industrial corridors. Look for housing age, street layout, building materials, open space, transport access and land uses. These observations describe visible features; they do not reveal the residents' incomes, identities or personal experience. Use census, housing and interview evidence when those questions matter.
At regional scale, map the town's connection to Durham and other nearby settlements. The distance to a city centre matters less than routes, travel times, service frequency and employment links. A local railway, main road or bus network can connect the town to opportunities and draw visitors, but access is not the same for every household.
Evaluate regeneration fairly
A regeneration assessment could compare the condition and use of buildings, number and type of businesses, access to services, visitor activity, employment, housing costs, resident feedback and quality of public space before and after a project. Use the same indicators and dates where possible. A new attraction may raise visitor counts but say little about wages or access to a GP.
Consider more than one stakeholder. A shop owner might value footfall and repairs, a renter may prioritise affordable housing, a visitor may value heritage interpretation, a young person may need transport and training, and a conservation group may prioritise the historic fabric. These perspectives can conflict without any one of them representing all residents.
The town offers a transferable lesson: settlement functions are layered. Religious power, a market, railway transport, coal, public services, tourism and heritage can each influence land use at different times. Do not assume that every British town follows this exact sequence. Use the case as evidence for how location and decisions interact, then test explanations in the place set by your teacher.
Maps, data and evidence
Read a settlement map
Begin with the map title, date, scale, north arrow and key. Identify the built-up area and the surrounding landscape. Trace rivers, contours, roads, railways, footpaths, parks, industrial sites, public services and housing. Describe a pattern with direction and named features before suggesting why it may exist.
On a topographic map, buildings or built-up areas may be shaded; individual symbols may identify schools, places of worship, stations, hospitals or other landmarks. Contours can show whether settlement follows a valley floor, bench, river terrace or gentler slope. A map gives a selected view at a scale and time. Some small buildings, informal land uses or recent changes may not appear.
Compare old and new maps
- Check that the maps show the same area and similar scales.
- Record each map's date and source.
- Identify stable features, such as a market square, church, river or main road.
- Mark what has been added, removed, extended or given a new function.
- Look for a possible process: railway construction, housing expansion, industrial decline, road building or regeneration.
- Find a second source to check the explanation.
If the built-up edge moves outward, that supports a description of physical expansion. It does not automatically prove that a particular policy caused it. Planning applications, transport changes, housing records and local economic history can test the cause.
Aerial photographs and satellite images
Aerial photographs show building form, street layout, open space and land use from above. A satellite image can help compare built surfaces across a wider area or several dates. Check image date, resolution, season and cloud cover. A car park and a roof may look similar in some images; field verification or map data can help distinguish them.
Do not infer the function of a building from its shape alone. A large shed may be a warehouse, sports hall, factory or agricultural building. Use labels, business records, planning documents or a field visit to check. Likewise, a green area could be a park, playing field, private garden, allotment or agricultural field; ground evidence matters.
Census and built-up-area evidence
The ONS describes built-up areas (BUAs) as geographies based on the physical built environment using Ordnance Survey topographic data. The 2021 Census analysis identified 7,018 built-up areas in England and Wales and reported that 56,366,690 people—94.6 per cent of the population—lived in them. BUAs covered 11.0 per cent of England and 4.4 per cent of Wales. These are dated 2021 statistics using that dataset's boundaries and definition.
A built-up area is not simply every building footprint added together. Its mapped geography can include related gardens and open spaces; the ONS notes that the boundary system is designed to recognise developed settlements for statistical analysis, not to measure every square metre physically covered by buildings. The 2021 geography changed from the 2011 method, so the ONS warns that the two sets are not directly comparable.
This dataset also handles London differently: the ONS explained that its method did not identify individual London settlements in the same way and instead used London borough boundaries in much of the analysis. This illustrates a central skill: check the boundary and method before treating a “city population” as an agreed total.
Fieldwork land-use survey
A simple land-use survey can help compare a town centre, suburban street and rural edge. Choose a question first, such as: “How does the range of land uses change with distance from the town centre?” Then choose safe public observation points and a consistent method.
One possible method is to record the dominant ground-floor use at every second building along a measured route. Categories could include retail, food, housing, office, public service, leisure, transport, vacant or mixed use. Define the categories before collecting data. If a building has flats above a shop, record the ground-floor use and note the mixed use separately rather than forcing it into one category.
Sampling every second doorway is systematic and easy to repeat, but it may miss a small use between observation points. A longer route may include more buildings but take more time. Record the route, spacing, date, time, weather and any access limits. Avoid photographing people without permission and do not enter private property.
Present results with a land-use map, tally chart or bar graph. A bar graph suits categories; a map shows where each use occurs. Compare the centre and edge using the same categories and sample rules. Explain the pattern cautiously: a high retail count could reflect the route chosen or the time of day, not only the town's whole economy.
Evidence quality checklist
For any settlement claim, ask:
- What exact place and boundary are being described?
- What date does the evidence represent?
- Does the source show a count, rate, land-use class, interview or observation?
- Were the categories and sampling method consistent?
- Is the evidence local enough for the claim?
- Does it describe a pattern, suggest a cause or test a cause?
- What other group or area might be missing?
- Could a different explanation fit the same observation?
Worked town-centre-to-edge traverse
Imagine a fieldwork group follows a safe, publicly accessible route from a market square to a newer housing edge. Before setting out, the group marks its start and finish, chooses a walking direction and agrees how to classify land use. Every second ground-floor unit is recorded as retail, food, housing, office, public service, leisure, transport-related, vacant or mixed. At fixed points, the group notes building height, frontage, street width, traffic, pedestrian crossings, open space and visible transport links. The method is consistent enough for another group to repeat, but it is still a sample of one route on one date.
Suppose the centre has many small shopfronts, civic buildings and upper-floor flats; a corridor farther out has offices and larger stores near a bus station; the edge has recent housing, a school, a local park and a supermarket beside a distributor road. The observation can support a description of changing land use and access. It does not by itself show that all central residents work nearby or that every new household uses a car. Add a route map, dated planning information, public-transport timetables and careful interviews to test those explanations.
The group can compare category counts with a bar chart and map the locations with colour symbols. It should show the total number of observations in each zone and keep the categories identical. If there are few buildings in the edge zone, a large percentage can be caused by only a small number of observations. Report counts and proportions together, and do not compare a percentage from a short transect with a town-wide total as if their samples were equivalent.
For a conclusion, make a claim, quote a pattern and explain how strongly it answers the question. “Retail was more common in the first two zones, where the route passed the market square, while the final zone contained mostly housing” is supported by the observations. “The town centre is declining” is a much broader claim and needs dated vacancy data, business change and a clear boundary. A transect can suggest a follow-up question; it cannot represent every street or prove the cause of change.
Evaluation improves the investigation. A route chosen for convenience may avoid an industrial estate or a new retail park. Recording at lunchtime may miss evening activity. Some mixed-use buildings may be classified differently by observers. Improve reliability with a shared category guide, a second observer checking a sample and a repeat at another time. Improve representativeness by adding a second route, while still explaining why the chosen routes cover the question. Record unavoidable gaps rather than quietly treating them as zero.
Common misconception
- “Site and situation mean the same thing.” Site refers to the physical location; situation describes connections and relative position.
- “A settlement is rural or urban with no in-between.” Towns, suburbs, villages and city regions are connected along a continuum.
- “A larger settlement always has more of every service.” Service distribution depends on function, policy, transport and local history.
- “A settlement hierarchy is a perfect ladder.” It is a model that can be tested; specialised functions create exceptions.
- “A central business district contains only shops.” Centres often contain housing, civic uses, entertainment, transport and mixed-use buildings.
- “Every city has the same ring pattern.” Urban models simplify selected places and periods; actual forms vary.
- “A new road always helps a nearby settlement.” It can improve access, bypass the centre, increase traffic or change land values; examine the specific route and users.
- “Brownfield means an empty, harmless site.” A site can contain ecological value, contamination, active use or heritage, and needs investigation.
- “Greenfield development is automatically wrong, or brownfield development is automatically right.” Compare access, land quality, hazards, housing need and environmental effects at the actual site.
- “Regeneration benefits everyone equally.” Different residents and businesses can gain or lose in different ways.
- “A renovated street proves that residents are wealthier.” Building appearance alone cannot establish household income or housing security.
- “A town-centre vacancy map explains decline.” It shows where units were vacant at a date; more evidence is needed to explain why.
- “Rural places are disconnected from cities.” Work, food, water, education, recreation and transport create rural–urban connections.
- “One census boundary can be used forever.” Definitions and boundaries change; methods must be checked before comparison.
Self-check
- What is a settlement, and name two activities that connect its residents to other places.
- Explain the difference between site and situation using one example of each.
- Give two physical influences that could shape a settlement's initial site.
- Give two ways a settlement's situation might change over time.
- What does a settlement hierarchy attempt to compare?
- How do threshold and range help explain where services are located?
- Name three functions a settlement could have at the same time.
- Why might a small town contain a specialised service?
- What is the difference between a built-up area and an administrative boundary?
- Why should urban and rural be treated as categories within a continuum?
- Describe one difference between greenfield and brownfield land.
- Why do neither of those labels decide whether a proposed development is sustainable?
- Give one useful idea from an urban land-use model and one limitation.
- Name three processes that might change land use in a town.
- How can a new rail station improve accessibility, and who may still face barriers?
- Why can an out-of-town store affect a town centre differently from a local shop?
- What is regeneration, and why is “successful for whom?” a useful question?
- How might a heritage project support jobs while also creating trade-offs?
- Give two flows between a city and its rural hinterland.
- Why can aerial photographs fail to identify a building's exact function?
- In the ONS 2021 built-up-area evidence, what share of England and Wales residents lived in BUAs, and why must you state the date and definition?
- Why does the ONS warn against directly comparing its 2021 BUAs with 2011?
- How could a systematic sample help a land-use survey, and what might it miss?
- Does a map showing town growth prove a new road caused that growth? Explain.
- Give two kinds of evidence that could test whether a regeneration project improved access to services.
Answers and reasoning
- A settlement is a place where people live and carry out activities. Work, education, shopping, transport, services and family networks are examples of connections.
- Site describes the physical characteristics of the location; situation describes its position relative to routes, other settlements or resources.
- A river terrace and gentle slope could influence a site; other examples include a spring, sheltered harbour or defensible ridge.
- New transport links, a change in trade routes, resource depletion, industry, planning or neighbouring urban growth can alter its situation.
- It groups settlements by factors such as population, function, services or influence. It is a model rather than a perfect ranking.
- Threshold is the demand needed to support a service; range is the distance people will travel to reach it.
- Market, residential, administrative, education, transport, industrial and tourism functions can overlap.
- It might serve a wider rural hinterland, contain a unique institution or draw visitors for a specialised activity.
- A built-up area uses a mapped developed-settlement geography; an administrative area follows a government boundary. Their boundaries may not match.
- Settlements vary in density, form, function and connection. Suburbs and small towns often combine characteristics.
- Greenfield has not previously been developed in an urban use; brownfield has previously been developed or used for an urban purpose.
- Actual conditions matter: access, soil, contamination, habitat, transport and housing need differ by location.
- A model may suggest land uses cluster near routes or a centre; it cannot represent every city or its history.
- Industrial change, housing growth, new transport, planning, retail change, regeneration or population change.
- It can reduce travel time or connect people to a wider labour market. Cost, service frequency, distance to the station, mobility and timetable can remain barriers.
- It can draw customers and jobs away from the centre, while a local shop may support nearby residents and street activity. Effects require evidence.
- Regeneration is coordinated improvement or change. Benefits can vary among tenants, owners, businesses, workers, visitors and public services.
- Repairs and attractions may support construction, hospitality or visitor jobs; trade-offs can include public cost, temporary disruption, affordability or uneven benefits.
- Food, water, energy, workers, waste, visitors, transport, investment or recreation move between urban and rural places.
- Similar roofs or footprints can host different activities; dates, resolution and viewpoint also limit what can be seen.
- The ONS reported 94.6 per cent in the 2021 dataset. The definition and year matter because both population and mapped settlement boundaries can change.
- The ONS changed the BUA geography and methodology, so a difference could reflect mapping rules as well as real settlement change.
- Systematic sampling gives a consistent, repeatable route; it may miss uses between sample points or areas outside the selected route.
- No. It shows a pattern or change, but planning, employment, population, housing and other evidence are needed to test cause.
- Compare travel times, service locations, opening hours, before-and-after user surveys, population access by age or mobility, and public transport frequency.
Revision points
For a settlement-location question, name the place and separate site from situation. Explain how a physical feature or relative connection mattered at a stated time; do not treat location as destiny.
For land use, describe what is where, at what scale and date. Explain why clusters may have formed, then check maps, planning records, local history or field observations. A city model can guide a question, but real settlements often contain mixed uses and exceptions.
For change, trace a sequence: transport, employment or population changes; land uses or building functions respond; effects differ across people and places. Regeneration should be evaluated with more than one measure and stakeholder viewpoint.
For a rural–urban interaction, name the flow—such as water, food, commuters, energy or visitors—and state who uses it, how it moves and what effects it may have. Include benefits, pressures and evidence limits.
When using maps or census data, identify the boundary, date and method. Counts show scale, rates allow comparisons, and fieldwork shows sampled local conditions. A pattern is not automatically a cause; state what additional evidence would test your explanation.
Curriculum alignment
- Curriculum coverage IDs: ks3.human.population-urbanisation, ks3.human.settlement-land-use, ks3.human-physical-interaction
- Related practice packs: ks3_geography_settlements
- Shared concept tags: settlements, land-use, urbanisation, place
Sources
- Curriculum: Department for Education: England Geography programme of study
- Settlement definitions and Census 2021 built-up areas: Office for National Statistics: Towns and cities, characteristics of built-up areas, England and Wales
- Built-up-area population and household data: Office for National Statistics: Towns and cities dataset, Census 2021
- England and Wales rural–urban classification: Office for National Statistics: 2021 Rural Urban Classification
- Bishop Auckland's historic site and market-town growth: Historic England: Bishop Auckland, the growth of a historic market town
- Railway effects, industrial change and reuse: Historic England: Transforming a historic market town
- Bishop Auckland's Heritage Action Zone, 2018–2023: Historic England: Heritage Action Zones
- Current planning policy for England: GOV.UK: National Planning Policy Framework
- Check dates, boundaries and adopted local plans before reusing case-study facts or describing current proposals.