 FoxChild@Learn
1. World locations and connected places
Curriculum status: Required core content.
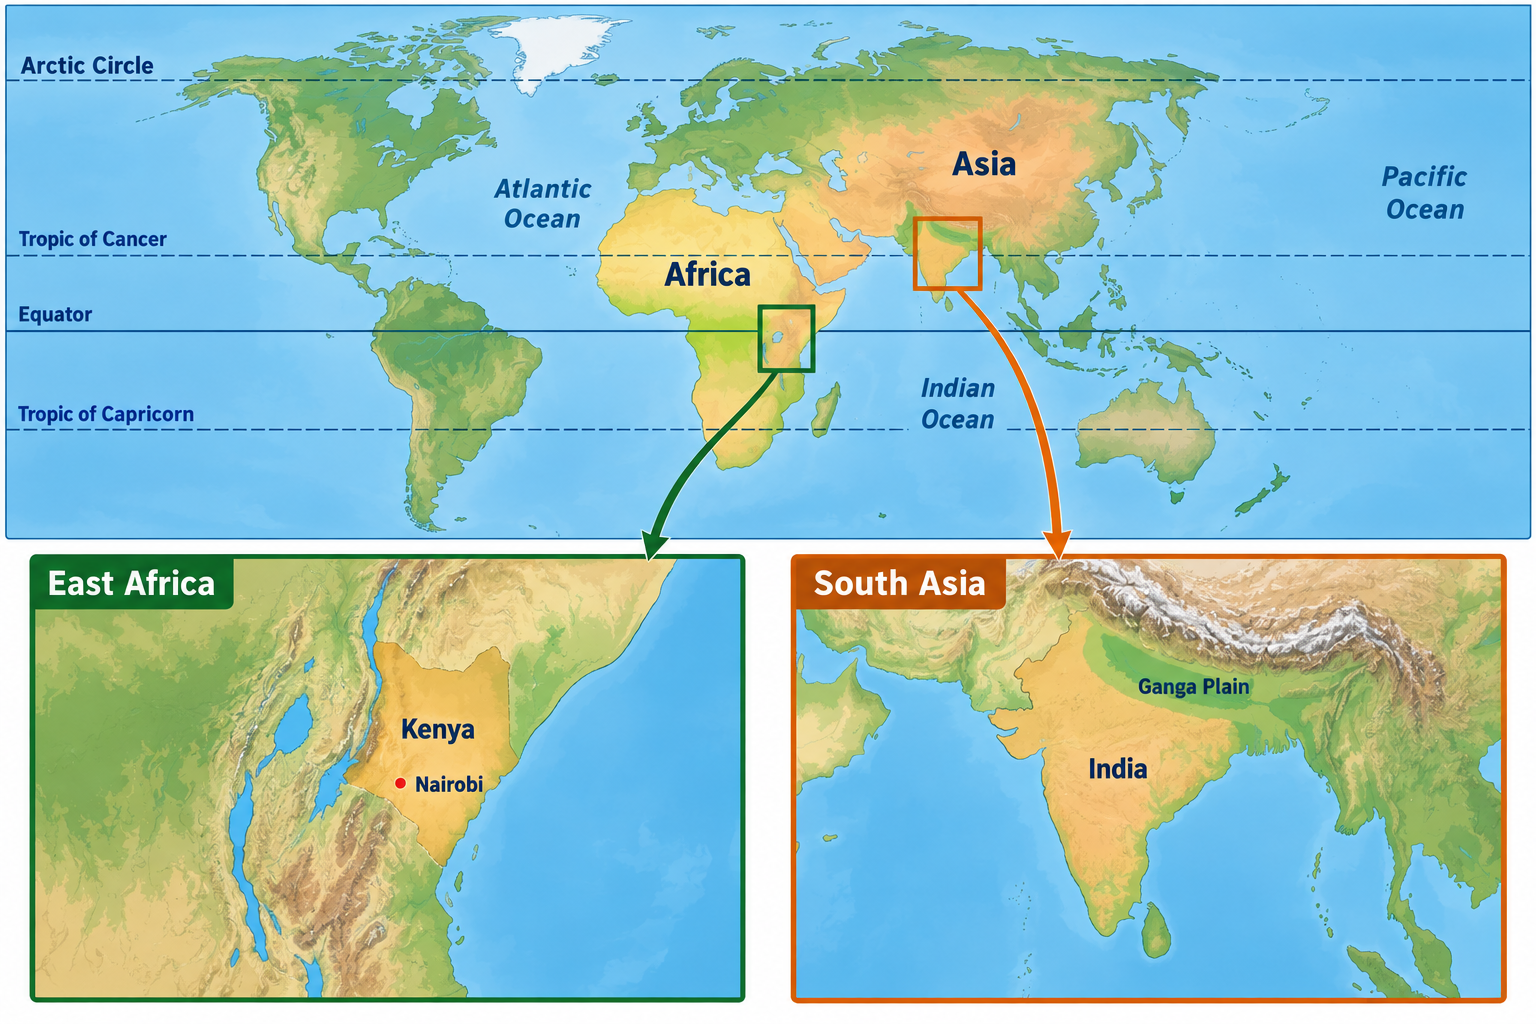
Illustrative place pair: East Africa, using Kenya as a country example, and South Asia, using the Ganga plain in India as a regional example. The England programme requires pupils to study the geography of a region in Africa and a region in Asia; it does not prescribe these two examples. Use them as a teaching route, and substitute the places your school has chosen when needed.
Required knowledge
By the end of this guide, you should be able to:
- locate Africa, Russia, Asia, China, India and the Middle East on a world map;
- use latitude, longitude, hemispheres, scale, direction and map evidence to describe location;
- recognise major environmental regions, including hot deserts and polar regions;
- explain why a continent or country contains many different physical and human environments;
- compare one region in Africa and one region in Asia using matching categories and evidence;
- describe connections between places, including movement, trade, communication and environmental links;
- separate what a map shows from what you infer from it.
The guide moves from the whole world to a region, a country and a local site. This change of scale is important: a statement that is useful for a continent can be too general to describe a city, mountain valley or neighbourhood.
How the geography works
Place, location and scale
Geography asks where things are, what places are like, how places are connected and why their patterns change. A place can be a named location, such as Nairobi, or an area people recognise and study, such as East Africa. Places have physical characteristics, including relief, climate, water, soils and vegetation. They also have human characteristics, including settlement, population, languages, work, transport, buildings and political boundaries.
A place is not defined by one feature. A high mountain range may influence temperature, water supply, travel and land use, but it does not determine every decision people make. People adapt to environments, change them, move through them and connect them to other places. The same physical feature can create both opportunities and challenges. A river may support water supply, farming, transport and electricity, while also creating flood risk or a need to share water across a basin.
A useful first question is: At what scale am I describing this place?
| Scale | Example | Useful questions |
|---|---|---|
| Global | Earth or a world region | Which hemisphere? Which ocean or continent? What broad climate or connection matters? |
| Continental | Africa or Asia | Which subregion? What major physical or human patterns vary across it? |
| Regional | East Africa or South Asia | Which countries and landforms are included in this study area? What makes this region distinctive? |
| National | Kenya or India | Where are its borders, major regions, cities, transport routes and physical features? |
| Local | A town, neighbourhood, river valley or school site | What is visible on the ground? How do people use the area? What field evidence could test a claim? |
Scale changes the detail that is useful. “Kenya is in East Africa” is a continental-scale location. “Nairobi is in Kenya’s central highlands” narrows the scale. “The school is east of Nairobi’s central business district” is more local and needs a more detailed map. A place description should name its scale so that readers know how broad the claim is.
Geographers also distinguish absolute location and relative location. Absolute location uses a reference system such as latitude and longitude, a grid reference or a named administrative unit. Relative location explains where a place lies in relation to another place: for example, a coastal town may be north of a river mouth and connected to an inland city by a road. Absolute location helps identify a place precisely. Relative location helps explain access, distance, neighbours and connections.
Location is not a complete explanation. If a settlement lies beside a river, the river might provide water and transport, but the location alone does not explain when the settlement formed, who lives there now or how the river is managed. Those questions need historical, social, economic and environmental evidence as well.
2. The world reference grid
The Earth is close to a sphere, so maps use an imaginary grid to describe positions. A globe represents the overall shape of Earth more accurately than a flat map, but it is less convenient for looking at a large area in detail. A flat map must alter some combination of area, shape, direction or distance. Every map therefore has a purpose and limitations.
Latitude measures how far north or south a place is from the Equator. Lines of latitude run east–west around the globe. The Equator is at zero degrees. The Northern and Southern Hemispheres are on opposite sides of it. The Tropic of Cancer and Tropic of Capricorn mark the outer limits of the tropics. The Arctic and Antarctic Circles mark the approximate limits of areas that can experience at least one full day or night without the Sun rising or setting on a particular date.
Longitude measures how far east or west a place is from the Prime Meridian, which passes through Greenwich in London. Lines of longitude run from pole to pole. The Prime Meridian is at zero degrees; the opposite meridian is about 180 degrees away. Latitude and longitude together provide a coordinate for a location. Coordinates are written with latitude first, then longitude, and identify an approximate point rather than the size or character of the place around it.
An approximate coordinate can answer “where is it?”, but the format matters. A value without N or S, or E or W, is incomplete because it could refer to more than one position. Degrees may be divided into minutes and seconds, or written as decimals. Different precision gives different levels of detail. Coordinates rounded to whole degrees are useful for locating a large region; they are not accurate enough to locate a street.
The Equator receives more direct sunlight on average across the year than high latitudes, but latitude does not determine local weather by itself. Altitude, distance from the sea, ocean currents, winds, relief and seasonal circulation all matter. This is why a high mountain near the Equator can have snow and ice, and why nearby places at similar latitude can have different rainfall.
Longitude is also related to time. Earth rotates, so places at different longitudes experience local noon at different times. Standard time zones are political and practical arrangements rather than perfectly straight slices of the globe. Some countries use more than one time zone, and boundaries may follow national borders. When using a map or time-zone chart, check its date and legend.
A good location description often combines two or three references:
- name the continent and region;
- identify the country or nearby countries;
- add a direction, latitude band, coastline, river or other landmark;
- use coordinates or a grid reference if the question needs precision;
- state the scale and source of your map.
For example: “Nairobi is in Kenya in East Africa, close to the Equator and inland from the Indian Ocean coast.” This gives a region, country, broad latitude and relative relationship. A detailed atlas map would be needed for an exact coordinate or route distance.
3. Continents and regions are useful models
A continent is a very large land area conventionally separated from other land areas. The boundaries between continents are partly physical and partly conventional. Europe and Asia form one continuous landmass, Eurasia, but are usually taught as separate continents. Russia extends across both Europe and Asia, so describing it as wholly European or wholly Asian is inaccurate. Its largest cities and historic political centre are in its western part, while a very large area stretches across northern Asia.
Regions are areas grouped because they share one or more characteristics. A region might be defined by physical features, climate, a river basin, language, economy, political boundaries or a combination. Different maps can divide the same continent into different regions because the map-maker is asking a different question. “East Africa” can describe a broad set of countries, an organisation’s membership or a physical subregion. Always check what a source means by the region name.
Regional boundaries are not always visible on the ground. A river basin boundary follows higher ground and the direction water flows. A political boundary is agreed or contested by governments and represented on a map. A language or culture region may cross a national border. A climate region changes gradually and may not have a single sharp edge. These different boundaries should not be confused.
A political map is useful for countries, borders, capitals and administrative divisions. A physical map shows features such as mountains, plains and rivers. A thematic map is designed to show one subject, such as rainfall, population density or transport. A topographic map shows the shape and height of the land as well as human features. A map may combine these kinds, but its title and legend tell you what evidence it contains.
Continents and oceans as a locator framework
The familiar seven-continent model names Africa, Antarctica, Asia, Europe, North America, South America and Australia/Oceania. Some education systems use a different model, for example joining Europe and Asia as Eurasia. Ocean names and their boundaries also vary slightly between mapping conventions. In this guide, use the names shown in your school atlas and be consistent when comparing maps.
The continent names provide a starting point, not a full answer. “Asia” covers an enormous range of environments and societies. It contains Arctic coastline, high mountains, broad river plains, tropical islands, dry interiors, densely settled cities and sparsely populated areas. “Africa” also contains major mountains, highlands, deserts, tropical forests, savannas, river basins, large cities and coastal regions. A single climate or way of life cannot describe either continent.
Use the following location ladder when you meet an unfamiliar place:
- Continent: Which large land area?
- Region: Which recognised subregion or physical area?
- Country: Which political territory?
- State, province or district: Which internal division, if relevant?
- Settlement or physical feature: Which city, mountain, river, coast or landscape?
- Site: Which particular neighbourhood, fieldwork site or point on a map?
Not every question needs every step. A world map question may only need the continent and region. A case-study explanation may need the country, city or river basin and the exact part of it being discussed. A local fieldwork report may need a grid reference and site description.
4. Africa: a continent of regions and contrasts
Africa lies across the Equator and extends into both the Northern and Southern Hemispheres. The Atlantic Ocean lies to its west, the Indian Ocean to its east and southeast, and the Mediterranean Sea to the north. The Red Sea and the narrow land connection around the Suez region separate much of Africa from Asia. Madagascar is a large island off the southeast coast. The Equator crosses central parts of the continent; the Tropics of Cancer and Capricorn cross its northern and southern parts.
A world map can make Africa appear narrower or wider depending on the projection. On the widely used Mercator projection, areas near the poles are enlarged, so countries near the Equator appear smaller in comparison. A fair comparison of country area should use an equal-area map or a reliable data table, not only visual size on a projection that changes area.
Africa’s broad regional groupings commonly include North Africa, West Africa, Central Africa, East Africa and Southern Africa. Some sources treat the Horn of Africa or the Sahel as separate subregions; others include them within broader zones. The Sahel is a transition region south of the Sahara, not a single country. The Horn of Africa refers to the eastern protruding part of the continent and nearby areas. These labels help organise study but do not describe uniform environments.
The continent contains a wide range of landforms. Large deserts include the Sahara in the north and the Namib and Kalahari drylands in the south. The Sahel borders the southern Sahara and is an area where rainfall and vegetation vary. Equatorial parts of Central Africa include humid forest, especially around the Congo Basin. East Africa includes high plateaus, volcanic landscapes, the East African Rift System and large lakes. The Atlas Mountains lie in the northwest; the Ethiopian Highlands rise in the east; mountains and plateaus occur in several other regions. The Nile, Congo, Niger and Zambezi are among the continent’s major river systems.
Climate also varies. The equatorial belt is generally hot and wet, but rainfall is seasonal and local patterns differ. Tropical savanna areas tend to have wetter and drier seasons. The Sahara and other arid zones receive little and often unreliable rainfall. Mediterranean-type climates occur in some northern and southern coastal areas. Elevation changes temperature and rainfall, so highlands can be cooler and wetter than nearby lowlands. Ocean currents, prevailing winds and relief affect local conditions too.
Water availability is not just a matter of annual rainfall. A place may receive seasonal rain in a short period, so storage and drainage matter. Some communities use rivers, reservoirs, groundwater, rainwater harvesting or water delivered through pipes or tankers. Access can depend on infrastructure, affordability, water quality, governance and household location. A map of average rainfall does not show every household’s access to safe water.
Africa’s population is diverse and unevenly distributed. Settlement patterns reflect a combination of water, soils, relief, disease environments, transport, employment, trade, history and political decisions. Cities such as Cairo, Lagos, Kinshasa, Nairobi, Addis Ababa, Johannesburg and Cape Town are large urban centres, but they differ in location, history, functions and connections. They are not representative of every settlement or community on the continent. Some cities are coastal ports, some are inland capitals, and some grew around transport or resource routes.
The continent includes many countries, languages, religions, livelihoods and forms of local knowledge. National borders do not neatly separate all language or cultural groups. People move between rural areas and cities, between countries and across continents. Family, education, trade, employment, conflict, climate stress and other factors may influence movement. It is inaccurate to explain all migration with one cause or to treat every country as having the same development challenges.
A locational sample of African countries and cities
This is a study list, not a complete list of countries or cities.
| Region for this guide | Country examples to locate | City examples to locate | Useful physical map features |
|---|---|---|---|
| North Africa | Egypt, Morocco, Algeria | Cairo, Rabat, Algiers | Sahara, Atlas Mountains, Mediterranean coast, Nile |
| West Africa | Nigeria, Ghana, Senegal | Abuja and Lagos, Accra, Dakar | Gulf of Guinea, Niger River, Sahel to the north |
| Central Africa | Democratic Republic of the Congo, Cameroon | Kinshasa, Yaoundé | Congo Basin, Congo River, equatorial forest |
| East Africa | Kenya, Ethiopia, Tanzania, Uganda | Nairobi, Addis Ababa, Dodoma and Dar es Salaam, Kampala | Rift Valley, highlands, Lake Victoria, Indian Ocean coast |
| Southern Africa | South Africa, Namibia, Botswana, Zambia | Pretoria and Johannesburg, Windhoek, Gaborone, Lusaka | Southern African plateau, Kalahari region, Zambezi, Atlantic and Indian Ocean coasts |
Capital-city arrangements can be complicated. South Africa has more than one capital function; Tanzania’s official capital is Dodoma, while Dar es Salaam remains a major port and commercial centre. Some cities have more than one common name or a name that changes over time. Always use a current atlas or official source when a question depends on the exact administrative capital.
A first comparison of African regions
Compare North Africa and East Africa without turning them into opposites. Both contain urban and rural places, coastal and inland environments, and substantial variation between subregions. The Sahara strongly influences the physical geography of North Africa, while the East African Rift System and highlands help shape parts of East Africa. However, the two regions are internally diverse. Coastal North Africa has Mediterranean influences; the Nile Valley is a distinct river corridor; the Horn has drylands and highlands; equatorial parts of East Africa can be wet. A careful comparison names the actual sites and evidence.
5. Asia, Russia and changing regional boundaries
Asia is the largest continent under the common seven-continent model. It extends from the Arctic in the north to tropical islands near the Equator. It borders Europe to the west, the Pacific Ocean to the east, the Indian Ocean to the south and the Arctic Ocean to the north. The Ural Mountains and nearby features are often used as part of the conventional boundary between Europe and Asia, but no ocean separates the continents along most of this line.
For learning, Asia is often divided into North Asia, Central Asia, East Asia, South Asia, Southeast Asia and West Asia. The Middle East overlaps with parts of West Asia and sometimes neighbouring areas of North Africa. Regional definitions differ among atlases and organisations. They should be treated as tools for explaining patterns, not as natural boxes with one universally agreed boundary.
The scale of Asia creates major differences in climate and landform. Northern Asia includes extensive high-latitude land, permafrost environments and cold winters. Central Asian interiors are far from the sea and include dry basins, grasslands and mountains. East Asia includes major river plains, uplands, islands and dense urban-industrial corridors. South Asia includes the Himalayan mountain arc, large river plains, plateaus, deserts, tropical coasts and island environments. Southeast Asia includes mainland peninsulas and many islands around warm seas, with mountains, volcanoes and river deltas. West Asia contains deserts, plateaus, mountains and important river basins.
These are broad patterns. Each region contains places that do not match a simple summary. A mountain barrier can create wet and dry sides; a high plateau can be cool even at a lower latitude; an island can have different rainfall on its windward and leeward sides. A large country such as China or India contains multiple climates, landforms, languages, cities and economic regions. One national average cannot describe all of them.
Russia is transcontinental. A small part lies west of the conventional Europe–Asia boundary, while most of its land stretches across North Asia. Moscow and St Petersburg are major western cities; other large cities are spread across the country. Long distances, climate, relief, transport routes and resource locations influence connections between regions. Russia’s large size means that people should avoid using a city in one part of the country to describe the whole country.
A locational sample of Asian countries and cities
| Subregion used in this guide | Country examples to locate | City examples to locate | Features to compare |
|---|---|---|---|
| North Asia | Russia | Moscow, St Petersburg, Novosibirsk, Vladivostok | Arctic coastline, taiga, long distances, major rail and river routes |
| East Asia | China, Japan, Mongolia | Beijing and Shanghai, Tokyo, Ulaanbaatar | River plains, mountain and upland areas, islands, dry interiors and Pacific coasts |
| South Asia | India, Pakistan, Bangladesh, Nepal, Sri Lanka | New Delhi, Mumbai and Kolkata; Islamabad and Karachi; Dhaka; Kathmandu; Colombo | Himalayas, Ganga–Brahmaputra plain, Indus basin, plateau, monsoon and deltas |
| Central Asia | Kazakhstan, Uzbekistan, Kyrgyzstan | Astana, Tashkent, Bishkek | Inland location, mountains, basins, steppe and desert environments |
| Southeast Asia | Thailand, Vietnam, Indonesia, Philippines | Bangkok, Hanoi and Ho Chi Minh City, Jakarta, Manila | Mainland rivers, deltas, islands, tropical climates, volcanoes and coastal exposure |
| West Asia | Saudi Arabia, Iraq, Iran, Türkiye | Riyadh, Baghdad, Tehran, Ankara and Istanbul | Arid environments, mountains, river basins, plateaus and links between regions |
City examples are not all national capitals. New Delhi is India’s capital; Mumbai is a major port and financial centre; Kolkata is a major city in eastern India. Beijing is China’s capital and Shanghai is a major coastal city. Tokyo is Japan’s capital. Karachi is a major port in Pakistan and Islamabad is its capital. City functions can change, so a map may need to be checked before describing a city as the “largest” or “most important”.
6. The Middle East and West Asia
The term Middle East is used widely, but its edges vary by source and purpose. Some maps use it for countries of West Asia; others include Egypt or extend towards North Africa. West Asia is a geographic subregion label used in some international classifications. Neither label describes a single climate, culture or political situation.
On a world map, locate the eastern Mediterranean, Anatolia, the Arabian Peninsula, the Red Sea, the Persian Gulf, the Caspian Sea and the rivers Tigris and Euphrates. These features help explain routes, water systems, settlement and connections. The region links Africa, Asia and Europe through land routes, seas, ports and air travel. The Suez Canal is a major human-made connection between the Mediterranean Sea and the Red Sea. It shortens some sea journeys between Europe and Asia compared with travelling around southern Africa.
The physical environments vary. The Arabian Peninsula includes extensive arid landscapes, but also mountain ranges, coastal settlements and areas where water is supplied through groundwater, desalination or transfers. The eastern Mediterranean includes coastal plains and mountains. The Iranian Plateau is elevated and has mountain margins and interior basins. The Tigris–Euphrates river system connects upland source areas with lower plains and the Persian Gulf. Water flow and water management cross political borders, so maps of national territory alone do not show the whole river system.
Cities such as Riyadh, Tehran, Baghdad, Ankara, Istanbul, Amman, Beirut and Cairo occupy different physical and political settings. They have different histories, climates, economies and connections. A map showing a city’s position cannot tell you its social conditions or the experience of every resident. Use a second source such as a population, climate, transport or land-use map to answer a more specific question.
The Middle East is a region of many languages, religions, histories and communities. Conflict and cooperation both shape some regional connections, but conflict should not be used as a single explanation for the region. People also study it through water management, urban change, energy, trade, migration, tourism, agriculture and cultural heritage. Choose the theme that matches the question and support it with evidence.
7. Environmental regions: climate, relief and vegetation
An environmental region is an area sharing selected physical characteristics. A biome is a large ecological region associated with climate, vegetation and animal life. These categories help us compare places, but their boundaries are approximate and they do not always match a political border. Human activity can also change vegetation and water use.
Latitude affects the average angle and duration of incoming sunlight. Near the Equator, the Sun is high in the sky through much of the year. As latitude increases, the Sun’s angle and day length change more seasonally. This contributes to broad climate patterns, but other factors modify them. Distance from the sea affects how quickly temperature changes; oceans often heat and cool more slowly than land. Prevailing winds can bring moist or dry air. Mountains may force air to rise, cool and lose moisture on one side, leaving drier conditions on the other. Ocean currents affect coastal temperatures.
Hot deserts are not only “places with sand”. They are areas where water supply is low relative to potential evaporation for long periods. Some are rocky or gravelly, and deserts can be hot or cold. Vegetation is adapted to limited or seasonal water. Settlements may be concentrated around rivers, oases, wells, coasts or routes. Climate diagrams should be read carefully: an average annual rainfall can conceal variation from year to year and within a region.
Polar regions are high-latitude areas around the Arctic and Antarctic. They include ice sheets, sea ice, tundra and other cold environments. The Arctic surrounds the North Pole and includes parts of several countries; Antarctica is a continent around the South Pole. They are not identical environments. The Arctic includes ocean and inhabited lands, while Antarctica is a largely ice-covered continent with no permanent resident population in the ordinary sense. Permafrost occurs in many cold areas, including parts of northern Asia, but it is not the same as a glacier or an ice sheet.
High mountains create environmental zones over short horizontal distances. As elevation rises, temperature generally decreases; aspect and moisture also influence vegetation. A map showing a mountain range does not directly show the local climate at every elevation. A profile, elevation data or climate observations would be needed.
Climate regions and biomes are patterns, not promises. A climate map may show the dominant regional pattern, but local factors produce variation. A region classified as savanna may contain woodland, farms, towns, wetlands and protected areas. A temperate city can include parks, irrigated gardens and built surfaces that have their own microclimates.
Reading a climate graph
A climate graph normally combines monthly temperature and precipitation. Before interpreting it:
- read the title and identify the place;
- check which axis belongs to temperature and which to precipitation;
- note the units and scale;
- compare the wettest and driest months;
- identify the warmest and coolest months;
- describe seasonal patterns before explaining them;
- compare it with a second place only if both graphs use the same units and a suitable time period.
A graph can show a pattern, but it cannot by itself explain why the pattern occurs. To explain it, combine the location with information about latitude, relief, winds, distance from the sea and seasonal rainfall. If a graph represents a long-term average, do not treat it as a forecast for every year.
Place example: East Africa and Kenya
East Africa is a broad regional label. Kenya is one country in the region; it shares land borders with Ethiopia, Somalia, South Sudan, Tanzania and Uganda, and it has an Indian Ocean coastline. The official capital is Nairobi. Mombasa is a major coastal port, while Kisumu lies near Lake Victoria. Locate these places before describing how they connect.
Kenya’s relief varies from the low coastal strip to inland plateaus and highlands. The central highlands include Mount Kenya and ranges such as the Aberdares. The East African Rift System crosses the country. The Rift is a large zone of crustal stretching and faulting, with escarpments, volcanoes, lakes and hot springs in different locations. West of the Rift, land descends towards Lake Victoria and the Nyanza region. Northern and northeastern areas include drier lowlands. These physical regions influence water, farming, transport and settlement, but they do not determine one fixed way of life.
The coast faces the Indian Ocean and includes beaches, reefs, creeks and coastal settlements. Coastal temperatures and humidity are influenced by the sea. Inland areas can be higher and cooler. Rainfall is seasonal and varies between regions and years. The timing and reliability of rain matter to farming and water supply. Rain-fed crops may face risk when rainfall starts late, ends early or arrives in intense bursts. Irrigation and storage can help some producers, but they require water, infrastructure, energy and management.
The highlands and Rift landscapes contain environmental contrasts over relatively short distances. Elevation, soil, rainfall and temperature help explain where particular crops or livestock are suitable. Farming systems vary by location and market access. A map of agricultural zones can show broad patterns, but not every farm uses the same crop or technique. Household decisions may reflect land size, water, prices, transport, skills, labour, policy and access to markets.
Nairobi grew in an inland highland location along important transport routes and became the national capital and a major economic centre. Its elevation gives it a different climate from the low-lying coast. It connects to other Kenyan cities and rural regions through roads, rail, air travel, communications and supply chains. This can create jobs and services, but also congestion, unequal access to housing and pressure on land, water and waste systems. These are urban issues found in many cities, though the causes and responses differ from place to place.
Mombasa’s coastal position supports port activity, tourism, fishing, services and links across the Indian Ocean. Coastal location creates opportunities but also exposure to coastal hazards and environmental pressures. Port activity connects producers and consumers in multiple countries. Cargo may travel by ship, rail and road; each mode has different costs and environmental effects. A map that shows the port but not its hinterland gives an incomplete picture of its role.
Lake Victoria, shared by Kenya, Uganda and Tanzania, is part of a larger lake and river system. It supports fishing, transport, water use and livelihoods, and it is connected to downstream drainage. Because the water body crosses national borders, management involves more than one government and many local communities. Water quality, fisheries, urban growth, farming and wetlands interact. A country border map and a physical drainage-basin map answer different questions here.
Kenya’s position links it to the East African Community and to routes across the Indian Ocean. Regional trade and movement connect ports, inland towns, farms and neighbouring countries. The benefits and costs of those connections are not distributed equally. A port may support employment and trade while transport corridors alter land use or displace some residents. Assessing a connection means asking who benefits, who bears costs and at what scale.
A useful East Africa comparison might contrast the Kenyan highlands and the northern drylands. Both are within one country, but their relief and water conditions differ. The highlands can support particular types of farming and dense settlement; arid and semi-arid areas may rely more on mobile pastoralism, livestock trade and water points. These are general patterns, not a rule about every person. Drought, markets, land rights, conflict, transport and public services can affect households differently. Local evidence is needed before making a specific claim.
Example: explain why a place is located where it is
Question: Explain why Nairobi and Mombasa have different functions.
Planning notes:
- Identify their relative locations: Nairobi is inland and elevated; Mombasa is on the Indian Ocean coast.
- Add physical context: highland setting versus coastal setting.
- Add human factors: capital and administrative functions, transport routes, port access, services and historical development.
- Link factors rather than list them: a coastal harbour supports maritime trade, while inland transport routes and government institutions help explain Nairobi’s role.
- Avoid saying location is the only cause. Both cities have changed over time through investment, policy, migration and economic activity.
Model paragraph: Nairobi and Mombasa have different functions partly because they occupy contrasting locations. Nairobi is inland in the central highlands and is Kenya’s capital, so government, services and transport connections support its role as an administrative and economic centre. Mombasa lies on the coast and is a major port, connecting the country to shipping routes across the Indian Ocean. Physical position creates different opportunities, while infrastructure and human decisions develop those opportunities. Neither function is explained by location alone.
Place example: South Asia and the Ganga plain in India
South Asia includes India and neighbouring countries such as Pakistan, Bangladesh, Nepal, Bhutan, Sri Lanka and the Maldives. The boundaries of “South Asia” vary slightly among sources, so use the boundary shown in the map or course you are studying. India is the largest country in the region by area, but it is only one part of South Asia. It should not be treated as a substitute for every neighbouring country.
India has several major physical regions. The Himalayas form a high mountain arc in the north. South of them lie extensive plains associated with the Indus, Ganga and Brahmaputra river systems. The Thar Desert lies in the northwest. The Peninsular Plateau occupies much of southern India and is bordered by coastal plains and hill ranges, including the Western and Eastern Ghats. India also includes islands and long coastlines along the Arabian Sea, Bay of Bengal and Indian Ocean. Different government and school sources divide these features into a different number of physiographic regions; the named features matter more than memorising one classification scheme.
The Ganga plain is a regional example within northern India. It is a broad, low-lying plain formed in part from river sediments carried from mountain and upland areas. The Ganga and its tributaries connect settlements and agricultural areas across several states. The river’s wider basin also extends beyond India. The plain contains urban, rural, industrial, agricultural and floodplain environments, so “the Ganga plain” is not one identical landscape.
The Himalayas influence the river system by providing high relief and, in some areas, snow and glacier melt, while monsoon rainfall also contributes to river flow. The Ganga has many tributaries. River conditions vary by season and along the course. Sediment carried downstream can build and reshape floodplains and deltas. Flooding can bring water and fertile sediment but can also damage homes, crops, roads and services. The impacts depend on the location, timing, exposure, infrastructure, warnings and preparedness.
Monsoon circulation is a major seasonal influence across South Asia. Seasonal winds bring much of the annual rainfall to many areas, but timing and amount vary from west to east, with elevation and distance from the sea also important. Rainfall may be intense in some places and limited in others. A monsoon is not simply a rainstorm; it is a seasonal wind and rainfall pattern. Climate graphs and rainfall maps need to be read by month and by location.
The plains support agriculture and dense settlement in many areas because relief is relatively low and river systems provide water and fertile alluvium. However, agriculture depends on more than natural conditions. Farmers may use irrigation, canals, tube wells, machinery, seeds, fertilisers, labour and market networks. The benefits and environmental costs vary. Groundwater use may support production but can lower water tables if extraction exceeds recharge. Flood protection may lower risk in one location while shifting water or sediment elsewhere.
Delhi, India’s national capital, lies in the north of the country near the Ganga-Yamuna region. Kolkata lies farther east near the lower Ganga and the Bay of Bengal region. These cities have different histories, transport roles and economies. Delhi is an inland capital and major service centre; Kolkata is an eastern metropolitan port and commercial centre. A city’s position relative to rivers, ports, roads, railways and other cities helps explain its connections, but human decisions have also shaped its growth.
The Indian Ocean, Arabian Sea and Bay of Bengal connect South Asia to East Africa, West Asia, Southeast Asia and beyond. Ports and sea routes carry goods, while air and digital networks link businesses, families and institutions. Coastal trade and migration have a long history. A map of shipping routes shows movement corridors; it does not show which groups control trade or how income is distributed.
South Asia contains many languages, religious traditions, cuisines, climates and political histories. Such differences exist within countries as well as between them. National borders influence government, services and trade, but physical regions such as river basins and mountain systems cross borders. Understanding a place therefore requires choosing a scale that fits the question.
Example: explain how physical and human geography interact in the Ganga plain
Question: Explain how the Ganga plain’s physical geography influences human activity, and how human activity can change the river environment.
Planning notes:
- Physical setting: low relief in much of the plain, river channels and tributaries, alluvial deposits, seasonal monsoon rainfall, flood risk.
- Human use: settlement, farming, transport, water supply, industry and religious or cultural use.
- Human change: dams and barrages, embankments, irrigation, groundwater extraction, urban drainage and pollution controls.
- Variation: upstream and downstream places, rural and urban areas, and different household access.
- Evaluation: benefits and costs depend on where and when water is available and on how it is managed.
Model paragraph: The low relief and river sediments of the Ganga plain support farming and settlement in many areas, while monsoon rainfall and tributaries supply water seasonally. People have built irrigation systems, embankments and urban water infrastructure to manage that resource. These changes can support crops and reduce some flood impacts, but they can also alter the river’s flow, sediment movement and wetlands. Flood risk remains uneven: a raised embankment may protect one settlement while changing water levels or drainage nearby. Physical geography shapes opportunities, and human choices change how those opportunities and risks are distributed.
10. Comparing the two illustrative regions
A comparison is strongest when the categories match. Do not compare one region’s rainfall with another region’s population and then claim a relationship without evidence. Choose a common theme, such as relief, water, farming, settlement or transport, and compare how it works in both places.
| Theme | East Africa example: Kenya | South Asia example: Ganga plain in India | Comparison question |
|---|---|---|---|
| Relief | Central highlands, Rift Valley, western plateau, dry northern lowlands and coastal plains | Himalayan margin, broad alluvial plain, plateau regions farther south and eastern delta connections | How does relief affect travel, settlement and water flow? |
| Water | Seasonal rainfall, Rift lakes, Lake Victoria, rivers, reservoirs and groundwater | Monsoon rainfall, Ganga tributaries, groundwater, canals and river infrastructure | How do seasonality and management affect access and risk? |
| Settlement | Nairobi inland; Mombasa on the coast; settlements around lakes, highlands and routes | Large cities and rural settlements across a broad plain and river network | Which physical and transport features help explain city locations? |
| Economic activity | Farming, livestock, port services, tourism, public services and trade vary by region | Farming, industry, services, transport and trade vary across the plain and cities | How do location and connections shape opportunities? |
| Environmental change | Land-use change, water demand, urban growth and conservation pressures | Floodplain modification, groundwater use, pollution and urban growth | Which human changes affect natural systems? |
| Scale | A national example contains major regional contrasts | A regional example crosses states and connects to a basin beyond the region | How does the chosen boundary affect the explanation? |
A comparison should include similarities as well as differences. Both regions contain cities, rural settlements, transport routes, agricultural areas and varied water environments. Both are influenced by their physical geography and by connections to other regions. The type and scale of variation differ. Kenya’s coast-to-highland relief contrasts across a relatively compact national area; the Ganga plain stretches across a much larger, densely settled river landscape. This statement is a starting hypothesis. A detailed answer should support each point with a map, climate graph, land-use map or other evidence.
Avoid simplistic development labels. A country’s income category can be useful when a specific indicator and date are given, but it does not describe every household or place. Two cities in the same country can have different access to services, housing, employment and transport. If you compare Kenya and India using a development measure, name the measure, date, source and what it cannot tell you.
11. Connections between places
Places are connected through movement and flows. People travel for work, education, health care, trade, family, tourism and safety. Goods move from producers to consumers through supply chains that may include farms, factories, warehouses, ports and shops. Information moves through communications networks. Money and investment link households, businesses, governments and financial organisations. Water, air pollution, sediment, wildlife and climate processes connect locations through natural systems.
A connection has a source, a route and a destination. Ask what moves, who moves it, why the route exists and what evidence shows the connection. A port may connect a region to international markets, but the route only works if roads, railways, ships, customs systems and buyers are available. A river links upstream and downstream settlements through water and sediment; people upstream can affect quantity or quality downstream.
Connectivity can create uneven effects. A new road may reduce travel time to a market for some communities but also increase traffic, noise or pressure on land. A city may attract workers and services while making housing expensive. A dam may provide electricity and water but alter local land use and river flow. A fair explanation identifies stakeholders and asks where benefits and costs occur.
Some links are visible on a map, such as a road or railway. Others require different data, such as passenger flows, internet access, trade values or pollution levels. A transport map cannot show travel affordability. A trade map may show total exports but not the wages of individual workers. Use the source that fits the question.
Networks and accessibility
A network is made of nodes and links. A port, city, airport or railway station can be a node. A road, route, flight or communication connection can be a link. Accessibility describes how easily people and goods can reach places or services. Straight-line distance alone is not enough. Mountains, rivers, congestion, road quality, cost, safety, border controls and service frequency influence actual access.
A settlement may be close to a hospital on a map but far away by road. A coastal area may be near an international shipping route but have limited port infrastructure. A town beside a major highway may be well connected to a large city, but local residents may not benefit if they cannot afford transport. A good explanation distinguishes geographical proximity from practical accessibility.
Flows and feedback
A flow can change a place, and the changed place can affect later flows. For example:
- A road connects an inland town to a port.
- Some producers can reach markets more quickly.
- More trade may support warehouses and services along the route.
- Increased traffic may create congestion, air pollution or demand for new land.
- Authorities or businesses may change the route, transport mode or land-use plan.
This is a feedback process. The first connection influences economic activity, and the resulting activity changes the transport network and landscape. Such a model simplifies reality. It should be tested against actual evidence and should not imply that growth always benefits everyone.
Scale and interdependence
Interdependence means places affect one another because they share systems, resources, labour, markets or decisions. A local factory may depend on materials from other countries and sell products to distant consumers. A city’s water supply may depend on a river basin beyond its boundary. A change in rainfall in a source region can affect downstream users. A global climate process influences local risks, while local land-use choices can affect water runoff or carbon storage.
Use more than one scale when an issue crosses boundaries:
- local: which neighbourhood, river reach or farm is affected?
- regional: which river basin, transport corridor or climate zone?
- national: what policies, services or markets apply?
- global: which trade, migration or climate systems connect the place?
A global explanation without local detail can miss who is affected. A local explanation without wider context can miss why resources, prices or weather patterns change. The right answer links scales rather than choosing only one.
Maps, data and evidence
Reading maps critically
Maps are models that select and simplify information. Before using one, check:
- Title: What question or theme is the map designed to show?
- Date: When were the boundaries or data collected?
- Scale: What area is included and how much detail is possible?
- Legend: What do colours, lines, symbols and shading mean?
- Projection: Does the map change area, direction, shape or distance?
- Source: Who produced it and what definitions did they use?
- Missing data: Which places, groups or features are not shown?
- Boundary choice: Does the region match the question you are asking?
A choropleth map shades areas by a value. It can show broad patterns, but large areas may dominate the visual impression. A proportional-symbol map sizes a symbol to represent a value; symbols can overlap or hide smaller places. A dot map can show distribution but does not necessarily represent exact counts unless the legend explains the dot value. A flow map shows movement along routes, but the width of a line must be interpreted using the legend.
Map comparison checklist
When comparing two maps, make sure:
- they show the same theme or a clearly related theme;
- their dates and scales are suitable;
- units and classifications match;
- you describe the broad pattern first;
- you identify exceptions or local variation;
- you do not claim cause from pattern alone;
- you name evidence that could test your explanation.
If one map shows rainfall and another shows settlement, an overlap may suggest a relationship. It does not prove that rainfall caused the settlement pattern. Roads, jobs, conflict, land rights, historical choices and services may also influence where people live. A second source can help test competing explanations.
Using scale and distance
A scale bar links a map distance to ground distance. Measure with a ruler or a strip of paper, then convert using the scale. Keep units consistent. If a scale bar shows that a short map segment represents a stated number of kilometres, multiply the measured map length by the correct ratio. A common error is mixing centimetres and kilometres without conversion.
Straight-line distance is different from route distance. A mountain range or river may make a road detour. Travel time also depends on speed, road conditions, traffic, border checks and stops. When the question asks which place is “closer”, ask whether it means map distance, route distance or travel time.
Choropleth and population-density data
Population density is calculated by dividing population by area. A high average density does not mean every part of the area is crowded. A low average density does not mean nobody lives there. Density maps may shade administrative areas that contain both dense cities and sparsely settled land. The size and shape of administrative units influence the pattern shown.
Always check whether a figure refers to total population, density, growth, urban share or another measure. These indicators answer different questions. A city’s population estimate may use a city boundary, metropolitan region or urban agglomeration. Two sources can disagree because their definitions differ, not necessarily because one is wrong. Record the source, date and geographic unit before comparing.
13. A worked method for comparing two places
Use this method when asked to compare a region in Africa with a region in Asia.
Step 1: Define the places
Name the region, country and chosen sites. In this guide, the illustrative pair is Kenya in East Africa and the Ganga plain in northern India. Do not silently switch from one country to an entire continent halfway through an answer.
Step 2: Choose comparable themes
Select two or three themes, such as relief, water, settlement or transport. Use the same theme for both places. For example, compare how relief affects settlement in both locations.
Step 3: Find matched evidence
Use a physical map for relief and drainage, a climate graph for seasonal temperature and rainfall, a population map for settlement pattern, or a transport map for connectivity. Use comparable dates and units where possible.
Step 4: Describe pattern before explaining it
State what the evidence shows: where higher ground is, where a city lies, which months are wetter or where roads connect. Keep description separate from explanation so the reader can follow the reasoning.
Step 5: Explain interaction
Link physical conditions to human activity, then add human decisions and connections. For example, low relief can make some routes easier to build, but infrastructure investment and political decisions determine whether a route is constructed.
Step 6: Compare and qualify
Use “both”, “whereas”, “in contrast” and “however” to show similarities and differences. Qualify broad claims: “in the mapped sites” or “in this example” is more accurate than claiming that the whole country is the same.
Worked planning table
| Question | Evidence needed | Possible explanation | Caution |
|---|---|---|---|
| Why is a city located here? | Physical map, road/rail map, land-use or historical source | Relief, water, route access, administrative role, employment and investment may interact | A present-day map cannot by itself show why a city first developed |
| How does rainfall affect farming? | Monthly rainfall graph, crop or land-use map, water-resource data | Seasonal water can affect planting, harvesting and irrigation needs | Annual averages hide variation; crop choice and technology also matter |
| How does a river connect places? | River-basin map, settlement map, transport map | Water, sediment, movement and decisions link upstream and downstream users | National borders do not equal basin boundaries |
| How does a port connect a region? | Port map, trade or route data, road/rail map | Ports can connect hinterlands to shipping and markets | Total trade does not show who receives income or bears costs |
| Why do two regions differ? | Matched maps and measures | Different relief, climate, history, infrastructure and decisions may combine | One difference does not prove a single cause |
Model comparison paragraph
The Kenyan highlands and the Ganga plain both support important settlements and farming, but their physical settings differ. The Kenyan example includes elevated central areas separated by the Rift Valley, while much of the Ganga plain is low-lying and shaped by river sediment. Relief and water influence routes, farming and flood risk in both regions. However, rainfall seasonality, drainage patterns and the scale of the plains differ, so the same management strategy may not work in both. To explain a specific outcome, compare a named site using maps and dated evidence rather than generalising from the country as a whole.
14. Fieldwork and map activities
These activities use maps and accessible secondary data. If you collect field data, follow your teacher’s instructions, safety plan and privacy rules.
Activity A: Build a world locator map
On a blank world map:
- mark the Equator, Prime Meridian, Tropics of Cancer and Capricorn, and Arctic and Antarctic Circles;
- label Africa, Europe, Asia, Russia’s transcontinental position, North America, South America, Antarctica and Australia/Oceania according to your atlas;
- label the Atlantic, Indian, Pacific, Arctic and Southern oceans;
- add the countries and cities in the guide’s location tables;
- use a physical atlas to add the Sahara, Congo Basin, East African Rift, Himalayas, Ganga plain, Deccan Plateau and Arabian Peninsula;
- create a legend that distinguishes political boundaries, physical features and cities;
- write one sentence describing what the map makes easy to see and one limitation.
Do not use one colour for every type of feature. A clear legend helps a reader distinguish places and features quickly.
Activity B: Compare distance and accessibility
Choose one inland city and one coastal city, such as Nairobi and Mombasa. Use an atlas to estimate their straight-line distance and identify a likely transport route. Then compare:
- straight-line distance;
- approximate route distance;
- physical barriers or corridors;
- modes of transport shown;
- information missing from the map, such as cost, congestion or travel time.
Do not claim that a route is fastest just because it looks shorter. A timetable or journey-time source would be needed.
Activity C: Read a climate pair
Choose a highland location and a coastal location. Find climate graphs from the same source and time period. Describe the seasonal patterns, then explain possible roles of altitude, latitude, relief, winds and distance from the sea. Add a final sentence naming one other factor that could explain a difference. Do not infer the climate of a whole country from two stations.
Activity D: Compare a river basin with a political map
Overlay or compare a river-basin map with a country-boundary map. Identify where the river crosses administrative boundaries, where large settlements sit and which users may depend on it. Discuss how the basin perspective differs from the national perspective. A river-basin map helps identify upstream and downstream relationships; it does not show all legal rights or water-quality conditions.
Activity E: Test a claim using two maps
Claim: “All large settlements are located beside rivers.”
Use a settlement map and a river map for one region. Find evidence that supports or challenges the claim. Consider coastlines, roads, ports, trade, topography, history and services as alternative influences. State whether the claim is always true, often true in your selected area or too simple. A claim needs evidence and a defined study area.
Common misconception
“Africa is a country”
Africa is a continent containing many countries and regions. Countries have different governments, histories, economies, languages and environments. A country profile cannot automatically describe its neighbours.
“Asia is one climate zone”
Asia extends across a very wide range of latitudes, elevations and distances from the sea. It includes tropical islands, monsoon regions, dry interiors, cold northern environments and high mountain systems. A climate map shows broad patterns and local variation.
“The Middle East has one fixed boundary”
The term is used differently across sources. Check the map’s definition and explain what area you mean.
“Russia is entirely in Europe”
Russia crosses the conventional Europe–Asia boundary. A map should show its full extent or clearly state which part is being studied.
“A country’s average describes every resident”
National averages can hide differences by region, age, income, rural or urban location and access to services. Use a local or regional measure if the question asks about variation.
“The place with the most rain always has the most water access”
Water access also depends on storage, infrastructure, water quality, affordability, seasonal timing, demand and management. Rainfall and access are related but are not the same measure.
“Physical geography determines culture”
Physical conditions can influence choices and opportunities, but people respond in different ways. Culture is shaped by history, language, institutions, migration, beliefs, technology and many other influences. Avoid explaining a whole society using one landform or climate factor.
“A map proves a cause”
A map can show distribution or pattern. It does not automatically prove why the pattern exists. Use additional evidence, consider other explanations and distinguish correlation from causation.
“A political border is also a physical-region boundary”
A country line is defined politically. A mountain range, climate zone or river basin has a different boundary. They can overlap but are not identical.
“More connections always mean everyone benefits”
A new route can create opportunities and costs. The effects depend on who can use it, who owns infrastructure, where jobs are located, what land is changed and how pollution or risk is managed.
Self-check and retrieval practice
Try the questions without looking back. Then use the answers to check understanding. A correct answer should use a location, a process or evidence, not just repeat a key term.
Quick recall
- What does latitude measure?
- What does longitude measure?
- Which ocean lies east of Africa?
- Name two physical features in East Africa.
- What makes Russia transcontinental?
- Name one major river system in South Asia.
- Why should you read a map legend?
- Give one reason why a region boundary might vary between sources.
- What is the difference between a physical map and a political map?
- Name one reason that rainfall and water access may show different patterns.
Explain
- How can altitude influence temperature?
- Why might a coastal place have a different temperature range from an inland place?
- Why can a river connect places on both sides of a country border?
- Explain one reason why Nairobi and Mombasa have different functions.
- How can a transport corridor change a place over time?
- Why might two maps of the same topic use different regional boundaries?
- Why is a country’s population average not enough to describe every region?
- How can a map show an association without proving a cause?
- Explain how a river can create both opportunities and risks.
- Give one way a map projection can affect visual comparison.
Compare and apply
- Give one similarity and one difference between the Kenyan highlands and the Ganga plain.
- A climate graph shows a wet season and a dry season. What extra information would help explain that pattern?
- A port map shows many routes leaving one city. What can you infer, and what can you not infer?
- A shaded map shows a high average population density for a large district. Why might some parts of that district still be sparsely settled?
- How could you compare access to a river in a rural area and a city?
- Why should you identify the exact location before using a case study?
- How might a high mountain range influence routes and rainfall?
- A world map makes one high-latitude country look very large. What should you check before comparing its area with a country near the Equator?
- What is one advantage and one limitation of studying a country instead of a river basin?
- How would you investigate whether a road improved access to jobs?
Suggested answers
- Latitude is angular distance north or south of the Equator.
- Longitude is angular distance east or west of the Prime Meridian.
- The Indian Ocean lies east of Africa.
- Examples include the Great Rift Valley, Mount Kenya, Lake Victoria, the central highlands and the Indian Ocean coast.
- Russia extends across the conventional boundary between Europe and Asia.
- Examples include the Ganga, Indus and Brahmaputra river systems.
- The legend explains what the map’s symbols, colours and lines represent.
- Regions may be defined for different purposes, and some transitions are gradual rather than sharp.
- A physical map emphasises natural features; a political map emphasises countries and administrative boundaries.
- Storage, pipes, wells, water quality, price, demand or seasonal timing can affect access.
- Temperature generally decreases with elevation, though local conditions vary.
- Water heats and cools more slowly than land, so coastal temperatures may vary less, depending on winds and currents.
- Water flows through a basin that can cross national borders, linking users upstream and downstream.
- Nairobi is an inland capital and service centre; Mombasa’s coastal port location supports maritime links.
- It may change travel time, land use, trade and investment, while also affecting displacement, noise or pollution.
- Sources may be mapping cultural, political, physical or administrative regions for different purposes.
- The average combines places and households that may differ greatly.
- It shows two patterns occur together, but other causes may explain them; additional evidence is needed.
- A river can supply water, transport and fertile sediment, but it can also flood and require management.
- Some projections enlarge areas or distort shape and distance. 21–30. Answers will vary. Support each answer with a named feature, comparable evidence and a clear explanation.
17. Longer written practice
Practice 1: Describe a location
Question: Describe the location of Kenya in Africa and the location of Nairobi within Kenya.
A strong answer moves from broad to detailed scale. It identifies the continent and region, names neighbouring countries or the ocean, and then describes Nairobi’s inland position in the central highlands. A precise map reference can be added if the question supplies a map and requires one.
Practice 2: Explain a pattern
Question: Explain why the environments of Asia vary so widely.
A strong answer links the continent’s large north–south extent, latitude, elevation, relief, distance from the sea, winds and ocean influence. It uses contrasting examples such as the cold north, high mountains, dry interiors, monsoon-affected regions and tropical islands. It avoids suggesting that each broad zone is uniform.
Practice 3: Compare places
Question: Compare the role of water in the Kenyan highlands and the Ganga plain.
A strong answer states a similarity and a difference, then explains them. Both locations depend on water for households and economic activity. Their water systems differ in scale and seasonality: Kenya’s highland, lake and Rift settings include varied local catchments, while the Ganga plain is linked to a major river network and seasonal monsoon rainfall. A detailed answer should use a climate or river map, name the chosen sites and explain access and management.
Practice 4: Evaluate a connection
Question: A new road is proposed between an inland town and a port. How might the road change the region?
A balanced answer considers travel time, market access, jobs and port connections, then weighs possible land conversion, displacement, traffic, pollution, cost and uneven access. It identifies stakeholders and explains how impacts differ by location. It states what further evidence is needed, such as route maps, traffic counts, environmental assessment, travel costs and consultation.
Self-assessment checklist
Before submitting a place comparison, check:
- Have I named both study places and their scale?
- Are my comparison categories matched?
- Did I use a map, graph or other evidence?
- Did I describe the pattern before giving a cause?
- Did I explain at least one physical–human interaction?
- Did I identify a connection or decision where relevant?
- Did I avoid generalising from one city or country to a whole continent?
- Did I mention a limitation or alternative explanation?
- Are my statistics dated and sourced if I used any?
Revision points
- Locate each study place from continent to region, country and site before explaining it.
- Use matched maps and data; state each source’s scale, date and definition.
- Describe patterns before proposing causes, and use more than one factor in explanations.
- Link physical processes with settlement, livelihoods, transport and decisions.
- Compare named regions without generalising from one city or country to a whole continent.
- Check whether a claim is supported, what evidence is missing and who experiences the outcome.
Key vocabulary
| Word | Meaning |
|---|---|
| absolute location | a position described by a reference system such as coordinates or a grid |
| accessibility | how easily people can reach a place, service or opportunity |
| alluvium | sediment deposited by flowing water |
| altitude | height above sea level |
| biome | large ecological region associated with climate and characteristic vegetation |
| choropleth map | map that shades areas according to a data value |
| climate | long-term pattern of weather, usually measured over many years |
| coordinate | numerical location within a reference grid |
| delta | depositional landform at a river mouth, where sediment builds outward |
| desert | environment with very low or unreliable water supply relative to evaporation |
| Equator | imaginary line at zero degrees latitude around Earth’s middle |
| flow map | map showing movement along routes |
| geographical information system (GIS) | digital system for storing, mapping and analysing location-based information |
| hemisphere | half of Earth, such as the Northern or Southern Hemisphere |
| hinterland | area served by or connected to a port, city or other centre |
| latitude | angular distance north or south of the Equator |
| longitude | angular distance east or west of the Prime Meridian |
| monsoon | seasonal wind circulation associated with a marked seasonal rainfall pattern |
| network | nodes and links through which people, goods, information or resources move |
| place | location understood through its physical and human characteristics and connections |
| political boundary | line marking the extent of a political or administrative unit |
| projection | mathematical method for representing Earth’s curved surface on a flat map |
| relative location | position described in relation to other places or features |
| region | area grouped according to selected shared characteristics |
| scale | relationship between a map distance and ground distance, or the level of detail from local to global |
| spatial pattern | arrangement or distribution of features across an area |
| thematic map | map designed to show a particular topic or dataset |
| time zone | area using a standard time arrangement |
| Tropic of Cancer | line of latitude north of the Equator marking the northern tropical limit |
| Tropic of Capricorn | line of latitude south of the Equator marking the southern tropical limit |
| transcontinental | extending across more than one continent |
| tributary | smaller river or stream flowing into a larger river |
| urbanisation | increase in the share or number of people living in urban areas |
| watershed | high ground that separates neighbouring drainage basins |
Curriculum alignment
- England KS3 programme outcomes:
ks3.locational-knowledge,ks3.place-knowledge - Related practice pack:
ks3_geography_regional_studies - Shared concepts for later cross-curriculum comparison:
locational-knowledge,place,africa,asia
19. Sources and further study
- England Key Stage 3 Geography programme of study: Department for Education
- India government reference on major physical regions: National Portal of India — Physical Features
- India’s Ganga basin physiography: National Mission for Clean Ganga
- Kenya’s physical regions and natural resources: National Land Commission — Kenya Country Natural Resource Atlas
- Kenya country context and regional location: East African Community — About Kenya
- Use the atlas, map or dataset chosen by your teacher for the exact political boundary, climate figure, population statistic or route. Verify the date and geographic definition before quoting numbers.
The Kenya–Ganga comparison in this chapter is an illustrative teaching pair, not a required DfE case-study choice. It is one way to practise the programme’s requirement to study a region in Africa and a region in Asia. Replace it with your school’s selected regions if they differ.
Illustrative locator; check an up-to-date atlas for exact political boundaries and coordinates.