 FoxChild@Learn
8. Rivers and river landscapes
Curriculum status: Required core content.
This guide follows the England Key Stage 3 Geography programme of study. It explains how rivers erode, transport and deposit material, how river channels and valleys change downstream, and why people face different levels of flood risk. The River Eden in Cumbria is an illustrative UK catchment used to connect processes with land use and flood management; schools choose their own detailed case studies.
How to use this chapter
Rivers are part of the water cycle, but this chapter focuses on what happens after water reaches a channel: how flow moves sediment, how valley shape changes, how landforms develop and how floods affect people. For a complete explanation, connect a process to the shape it creates and to evidence in a map, photograph, field measurement or hydrograph.
Use this sequence:
- Rain and groundwater supply a channel with water.
- Gravity moves water downhill.
- Flow erodes the bed and banks, carries sediment and sometimes deposits it.
- These processes form and change channel and valley landforms.
- Floods occur when river flow exceeds the channel's capacity or reaches places people use.
- People manage the risk through a combination of planning, warning, storage, engineering and work with natural processes.
A river landscape is dynamic. A bend migrates; sediment bars shift; a flood can deposit silt or scour a bank; a bridge or embankment changes flow locally. Maps and field observations are snapshots of a system that continues to change.
Required knowledge
You should be able to:
- Explain how hydraulic action, abrasion, attrition and solution erode river channels.
- Describe traction, saltation, suspension and solution as river-transport processes.
- Explain why deposition occurs when a river loses energy or carrying capacity.
- Describe how channel and valley features tend to change downstream, while recognising local variation.
- Explain how waterfalls, gorges, meanders, oxbow lakes, floodplains and levees form.
- Read a river long profile, cross-section, map, photograph and storm hydrograph.
- Explain how rainfall, geology, relief, soils, vegetation and land use influence river response and flood risk.
- Distinguish a flood hazard from flood risk and consider exposure and vulnerability.
- Compare hard engineering, planning, warnings and natural flood management.
- Use the River Eden as an illustrative catchment and explain why flood-management effects can vary between places and may be transferred downstream.
- Use safe fieldwork methods to collect evidence about channel width, depth, velocity, gradient and sediment.
Key vocabulary
| Term | Meaning |
|---|---|
| Channel | The route occupied by a river, including its bed and banks. |
| Valley | The lower land through which a river and its tributaries flow. |
| Discharge | The volume of water passing a point in a channel per unit of time, often measured in cubic metres per second. |
| Hydraulic action | Erosion caused by the force of moving water, including air compressed in cracks and water pressure against bed or bank. |
| Abrasion, corrasion | Wearing away of bed and banks by sediment carried by the river. |
| Attrition | Collisions between transported particles that make them smaller and rounder. |
| Solution, corrosion | Dissolving of soluble minerals in water. |
| Traction | Rolling or dragging of larger particles along the bed. |
| Saltation | Bouncing movement of small stones or coarse sand along the bed. |
| Suspension | Fine sediment carried within the flowing water. |
| Solution load | Dissolved minerals carried in water. |
| Competence | The largest particle size a river can transport at a particular time. |
| Capacity | The total quantity of sediment a river can carry. |
| Deposition | Material being dropped when a river loses the energy or capacity to carry it. |
| Gradient | The steepness of a river channel or valley. |
| Long profile | Side-view graph showing a river's height and distance from source to mouth. |
| Cross-section | Side-on profile across a river channel or valley. |
| Interlocking spurs | Alternating ridges around which a river winds in an upland valley. |
| Waterfall | A sudden vertical or steep drop in a river's course. |
| Plunge pool | A deep basin scoured at the foot of a waterfall. |
| Gorge | A narrow, steep-sided valley, sometimes formed as a waterfall retreats. |
| Meander | A bend in a river channel that can migrate across a floodplain. |
| River cliff | The steeper outer bank of a meander where erosion is stronger. |
| Slip-off slope, point bar | A gentler deposit on the inside of a meander bend. |
| Oxbow lake | A curved lake left when a river cuts through a meander neck and abandons the bend. |
| Floodplain | Flat land beside a river, built partly by river deposition and regularly or occasionally flooded. |
| Levee | A raised natural ridge beside a channel, built from sediment deposited during floods. |
| Hydrograph | Graph showing river discharge over time, sometimes with rainfall on the same graph. |
| Peak discharge | The highest discharge recorded during a storm response. |
| Lag time | Time between a rainfall peak and a discharge peak, as defined for the data. |
| Flood hazard | The possibility of a flood occurring and its physical characteristics. |
| Flood risk | Potential harm to people, property, livelihoods and ecosystems from flooding. |
| Exposure | People, buildings, infrastructure or activities located where a flood could reach them. |
| Vulnerability | How likely exposed people or systems are to be harmed and how well they can respond or recover. |
| Natural flood management | Measures that protect or restore natural processes to slow or store water across a catchment. |
How the geography works
1. A river as a moving system
A river is water flowing through a channel. It receives water from rain, snowmelt, springs, groundwater and tributaries. Its flow responds to weather and to what happens across the drainage basin. The previous hydrology chapter explains those stores and pathways; here, pay particular attention to how water's energy changes as it moves downstream.
Gravity pulls water down a slope. A steep channel often has a high gradient, but gradient is only one control on energy. Discharge, channel shape, roughness, obstacles, sediment size and water depth all affect how a river flows. A steep stream may have low discharge and large boulders; a lower river may be wider, deeper and carry a much greater volume of water.
A channel has a bed and banks. The bed is the bottom surface over which water flows. The banks confine the channel up to the level at which water spills onto surrounding land. The channel can change through erosion, transport and deposition. During high flow, water may reach parts of the floodplain that are normally dry.
Discharge
Discharge is the volume of water passing a point in a given time. A simple estimate is:
Discharge = cross-sectional area of flow × average velocity
If a channel is 4 metres wide on average, 0.5 metres deep on average and the water's average speed is 0.8 metres per second, a simplified estimate is:
4 × 0.5 × 0.8 = 1.6 cubic metres per second.
Real measurements need care. Channel depth varies from bank to bank, velocity varies across the channel, and a surface float may move faster than the water close to the bed. A calculation is an estimate based on chosen measurement points and method.
Discharge often increases downstream because tributaries add water and the drainage basin area becomes larger. This is a general tendency, not an unbreakable rule. Abstraction, evaporation, infiltration, dams, diversions, drought, geology and local tributary patterns can change flow. A measurement must be tied to its place and time.
The downstream sequence
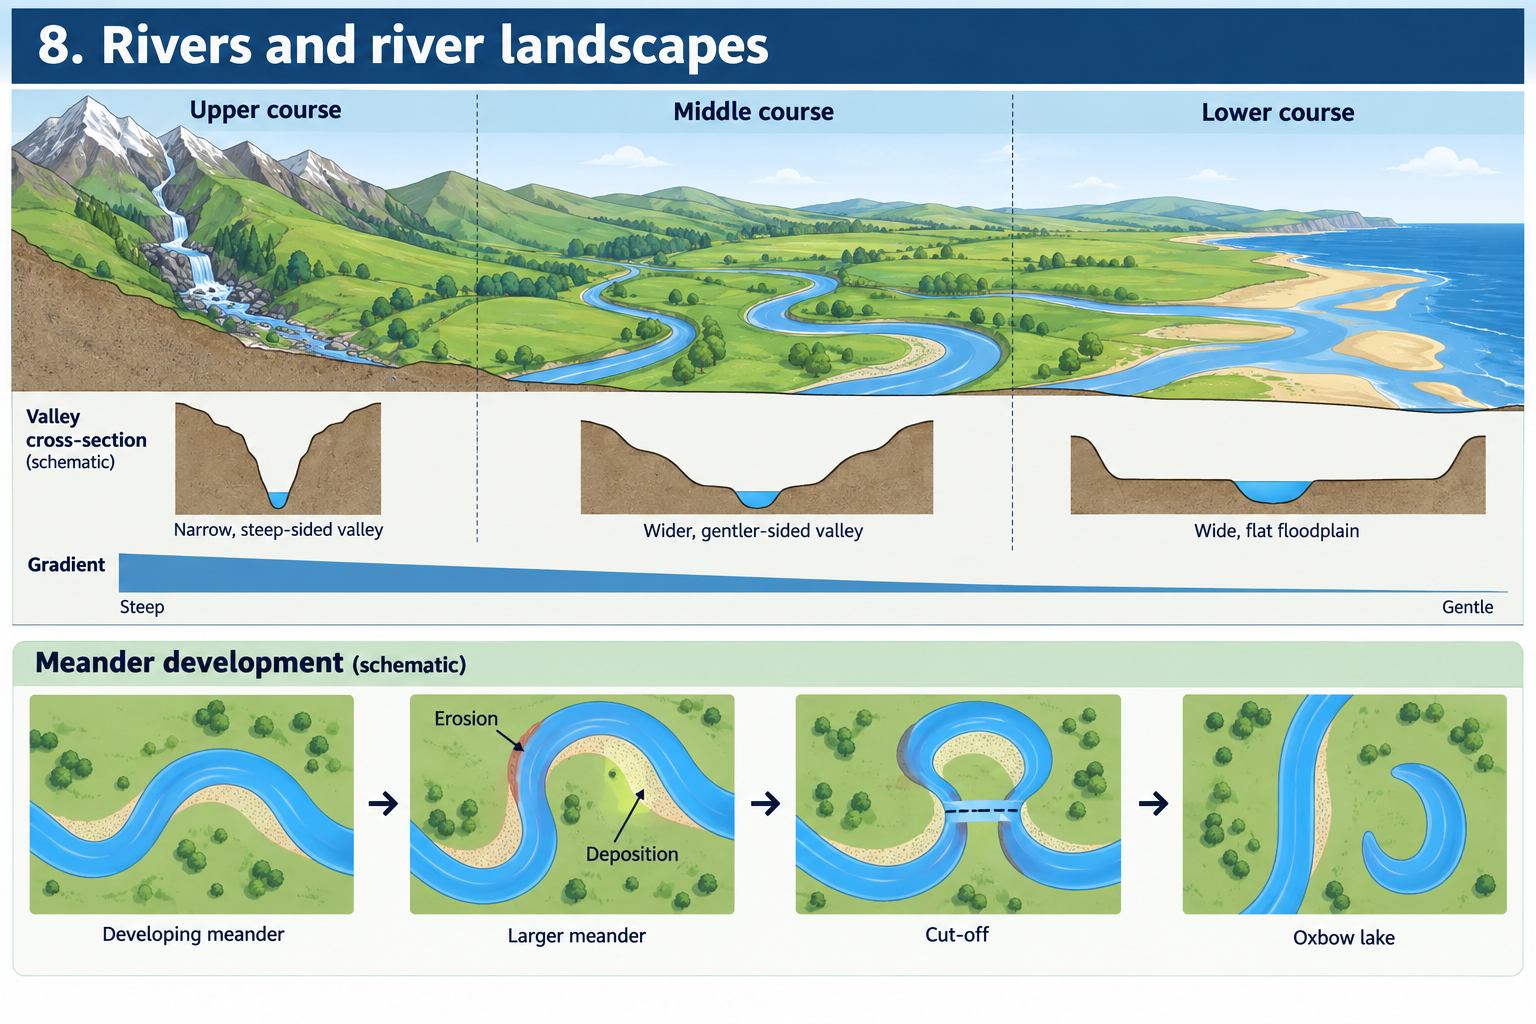
A river is often described using upper, middle and lower courses. These are useful sections for comparing gradient, valley shape, channel size and dominant landforms. The transitions are gradual, not sharp boundaries; each river is different.
In the upper course, a river is close to its source in upland terrain. The channel is commonly narrower and shallower; gradient is often steep. The water may flow over coarse, angular material. Vertical erosion can cut down into a valley, and the valley may be narrow with steep sides. Interlocking spurs, rapids, waterfalls and gorges can occur.
In the middle course, the river has usually received more tributaries. Discharge and channel size commonly increase. Gradient is often gentler than upstream. Lateral erosion and deposition help form meanders and a wider valley. The valley floor begins to broaden.
In the lower course, the river is nearer its mouth. It may be wide and deep, with large discharge. The gradient is usually gentle, and the floodplain can be broad. Meanders, floodplains, levees and depositional features may be prominent. Some rivers enter an estuary or delta, but those coastal landforms are explored further in the coasts chapter.
These patterns are useful as a framework. Resistant rock can produce rapids or a local steep section far downstream. A reservoir can alter discharge. Human construction can narrow, straighten or deepen a channel. A river does not have to match every textbook diagram.
2. River erosion
Erosion is the wearing away and removal of material from the bed or banks. Flowing water can erode directly and can use transported sediment as tools. Four processes are commonly taught.
Hydraulic action
Moving water presses against the bed and banks. Water can enter cracks; air trapped in the cracks may be compressed as water surges into them. Repeated pressure can loosen material. Hydraulic action may be stronger when flow is faster or deeper, but rock structure and existing cracks matter.
Water also erodes loose sediment. A high flow can lift or move material that a low flow cannot. The force can undercut a bank or shift a bed load. When describing hydraulic action, make clear that the force of the water itself is doing the work.
Abrasion
Abrasion occurs when sediment carried by the river scrapes against the bed or banks. Sand, pebbles and stones can grind surfaces, enlarge potholes or wear a bank. The sediment acts as a tool for erosion. The river's load can come from earlier erosion upstream, bank collapse or sediment supplied from slopes and tributaries.
Abrasion can be powerful, but its effect depends on the amount and size of sediment, flow speed, contact with the bed and rock resistance. A clear-water flow may have less abrasive material than a sediment-rich flood.
Attrition
Attrition occurs when transported particles collide with one another. Repeated impacts can break larger fragments into smaller pieces and smooth their edges. A particle may become rounder as it travels, but not every river load follows a simple progression: fresh material can enter downstream, and some resistant rocks change less quickly than others.
Attrition acts on the sediment, not directly on the river bed. The smaller and rounder particles may later be transported differently from larger angular fragments.
Solution
Some minerals dissolve in water. This chemical erosion is called solution or corrosion. Its importance depends on the mineral composition of the rock, water chemistry, acidity, temperature and contact time. Limestone and other soluble rocks can be particularly affected. Dissolved material is transported invisibly in the water.
Vertical and lateral erosion
Vertical erosion cuts downward into the bed and can deepen a valley. Lateral erosion wears sideways into the banks and can widen a channel or valley. Both processes can happen at once. Their relative importance changes with gradient, flow, sediment, valley shape and geology.
In upland areas, a steep slope can encourage vertical incision. But vertical erosion does not happen only in the upper course, and lateral erosion does not occur only downstream. A river adjusts locally to its energy, sediment supply and channel conditions.
3. River transport and deposition
A river transports a load of sediment. The load includes material picked up from its bed and banks and material supplied by tributaries and slopes. Four transport processes are used to describe how load moves.
- Traction: large stones roll, slide or are dragged along the bed.
- Saltation: smaller pebbles or coarse sand bounce along the bed.
- Suspension: fine particles are carried within the water.
- Solution: dissolved minerals are carried in the water and cannot be seen as separate grains.
A particle can switch between modes. A pebble may roll at high flow and rest when the river slows. Fine sediment can settle and later be lifted again. The river's capacity and competence increase when it has more energy, but sediment size and shape matter.
Competence is the largest particle size a river can move at a particular time. Capacity is the total quantity of material it can carry. A flood may move larger particles than a low flow, and it may carry more total sediment. A deep, fast flow may transport more than a shallow slow one, but local channel roughness and obstacles change the pattern.
Why deposition happens
A river deposits sediment when it can no longer carry some or all of its load. This may happen when flow slows, discharge decreases, the channel becomes shallower, the river spreads over a floodplain, or it enters a lake or sea. Larger and heavier particles usually settle first; fine sediment may remain suspended longer.
Deposition does not only happen at a river mouth. It can occur on the inside of a meander, behind a boulder, where a tributary enters a wider channel, across a floodplain during a flood or where a river spreads into shallow braided channels. The place and particle size depend on flow and sediment supply.
Erosion, transport and deposition are linked. Material eroded upstream may be transported and deposited downstream. Deposited sediment can later be re-eroded. A river landscape is continually adjusted, and one storm can shift material that accumulated over a long period.
Sorting and river load
As particles travel, collisions may make them smaller through attrition. Water can also sort load by size as its speed changes. When water slows, larger particles tend to be dropped first; finer particles can travel farther. This is a useful model rather than an exact rule for every grain because density, shape, turbulence and channel obstructions matter.
A river does not carry all sediment at every flow. During low flow, some coarse material remains still. During floods, higher energy can entrain and move material that is normally stable. This is why a river may look calm most days but still reshape its channel during a few high-flow events.
4. River long profiles and valleys
A long profile shows height along the river from source to mouth. The upper course usually has a steep gradient, which becomes gentler downstream. The graph often appears concave: the gradient decreases as distance increases. Local steps, lakes, dams and resistant rocks can interrupt this broad shape.
A long profile is different from a cross-section. A long profile follows the river from upstream to downstream. A cross-section cuts across the channel or valley at one location. Read titles and axes before interpreting either graph.
V-shaped valleys and interlocking spurs
In an upland valley, a river can erode vertically into its bed. Weathering and mass movement loosen material on the valley sides; gravity carries it toward the channel, where the river may transport it. Together, downward incision and slope movement can form a narrow valley with steep sides and a V-shaped cross-section.
A river winds around ridges of more resistant or higher land instead of cutting straight through them. These ridges appear to overlap in map view and are called interlocking spurs. In an upland photograph, one spur may hide the next, making the river route seem to alternate from side to side.
A V-shaped valley is a simplified form. Rock resistance, old glacial landforms, slope failures and human modification can make real valleys asymmetrical or irregular. A V-shaped profile supports a fluvial explanation but should be considered with other evidence.
5. Waterfalls and gorges
A waterfall forms where water descends a steep step or drop in a channel. One common formation sequence begins where resistant rock overlies less resistant rock. The softer rock is eroded more quickly, creating a step. Water falls over the edge and strikes the base, helping deepen a plunge pool. Hydraulic action and abrasion can undercut the softer rock beneath the harder cap rock.
The hard rock may become unsupported and collapse. Blocks fall into the plunge pool and are broken up or carried away. Repeated undercutting and collapse can make the waterfall retreat upstream. A narrow, steep-sided gorge may remain behind it.
This is a model for one type of waterfall. Waterfalls can also form where a river crosses a fault, resistant intrusion, landslide, or sudden change in valley level. Geology and local setting matter. Do not assume every waterfall has the same cap-rock structure.
Reading a waterfall diagram
A labelled sequence should show:
- A harder layer over a softer layer.
- Faster erosion of the softer bed.
- A developing step and plunge pool.
- Undercutting of the hard rock.
- Collapse of an overhang.
- Upstream retreat and a gorge left behind.
Arrows should distinguish water flow from the direction the waterfall retreats. The waterfall retreats upstream over time, but the water continues downstream.
6. Meanders, oxbow lakes and floodplains
A meander is a bend in a river. In a winding channel, flow is generally faster along the outside of a bend and slower along the inside. The faster flow can erode the outer bank, creating a river cliff. Slower flow on the inner bank encourages deposition, building a slip-off slope or point bar.
The pattern of faster outer-bank flow and slower inner-bank flow helps the bend grow and migrate across the valley floor. The channel may erode sideways as well as downstream. The exact flow is three-dimensional and varies with channel shape, depth, roughness and discharge; a simple diagram shows the general pattern.
How an oxbow lake forms
Meanders can grow until the outside bends approach one another at a narrow neck. During high flow or over time, the river may cut through the neck and take a shorter route. Deposition can seal the ends of the abandoned bend. The former loop is separated from the main channel and becomes an oxbow lake.
The usual sequence is:
- Erosion on outer banks enlarges a bend.
- Deposition builds inner-bank slip-off slopes.
- The meander neck narrows.
- High flow or continued erosion cuts a straighter channel across the neck.
- Sediment blocks the old entrances.
- The abandoned bend remains as an oxbow lake, which may later fill with fine sediment and vegetation.
Aerial photographs and maps can show a curved abandoned channel. The lake may eventually become a wetland or dry depression. Human drainage, farming and development can alter what remains visible.
Floodplains
A floodplain is relatively flat land beside a river. Rivers can build floodplains over time through lateral channel migration and the deposition of sediment during floods. When water spills over the banks, it spreads out and slows. Coarser material may settle near the channel and finer silt farther away. Repeated floods can leave layers of alluvium and create fertile soils.
Floodplains provide space for water during high flows. They can support farming, wetlands, settlements, roads and wildlife, but placing buildings or infrastructure in a floodplain increases exposure to flooding. Fertile soil and flat land make floodplains attractive for people, while their location beside a river creates a hazard. A floodplain is both a valuable landscape and a place where flood risk must be managed.
Natural levees
During a flood, water carrying sediment spills from a channel onto the floodplain. As it slows, the heaviest sediment can settle close to the banks and build slightly raised ridges called natural levees. Finer material can travel farther across the floodplain. Repeated floods may build these ridges over time.
Natural levees are not the same as engineered embankments. Both can be raised ridges beside a river, but natural levees form from flood deposition while engineered levees are constructed by people. A map or diagram should make clear which type is being described.
7. River change downstream
The river's channel often changes downstream in several connected ways:
- Discharge commonly increases as tributaries add water and the drainage basin grows.
- Channel width and depth often increase to carry more water.
- Valley gradient commonly becomes gentler.
- The bed load often becomes smaller and more rounded, although new sediment can enter at any point.
- Vertical erosion may become less dominant relative to lateral erosion.
- Meanders, floodplains and depositional features become more common on broader valley floors.
These are general patterns rather than fixed rules. A reservoir may trap sediment and alter flow. A tributary can introduce coarse material. A city can constrain the channel. Bedrock may create a local steep section. Floods can move large sediment downstream in a short time.
Why does a river become larger downstream?
As a river travels, it gathers water from tributaries and runoff across a larger drainage area. This generally increases discharge. More water can provide more energy for transport and channel adjustment. However, some water is lost through infiltration, evaporation or abstraction; reservoirs and transfers alter the natural flow. Use “often” or “typically” when describing general downstream patterns.
Sediment downstream
Particles may become smaller and rounder because of attrition and sorting. This tendency is not identical in every river. Fresh sediment can enter downstream from collapsing banks, tributaries, landslides or human activities. Some rock types are more resistant than others. A pebble sample from a few locations can suggest a pattern but cannot describe every particle in a whole river.
If comparing sediment, measure the longest axis using the same method at each site. Record the number of particles and where they were collected. Do not compare a handful of large visible boulders at one site with a sample of fine sediment at another and assume they represent the full bed.
8. Floods and flood risk
A flood occurs when water covers land that is normally dry. Rivers naturally rise and overflow their banks; the hazard becomes a risk when water can harm people, property, services, transport, livelihoods or ecosystems.
Flood risk depends on both the chance and characteristics of a flood and the people or assets exposed and vulnerable to it. A remote floodplain can flood with little harm to people. A densely settled town beside a river can experience major consequences even if floods are less frequent. Warning, building design, evacuation routes, insurance, health, age and income affect vulnerability.
Physical factors
- Rainfall amount and intensity: heavy or long-lasting rain adds water quickly.
- Antecedent conditions: saturated ground has less capacity to store additional rain.
- Snowmelt: rapid melting can add water to channels.
- Relief: steep slopes can route runoff quickly toward channels.
- Geology and soil: impermeable rock or compacted soil can limit infiltration.
- Catchment size and shape: influence the timing and coordination of flow from tributaries.
- Vegetation: interception and soil structure may slow some water, though effects vary.
- River channel and floodplain: a narrow or obstructed channel may spill sooner; available floodplain storage can affect the flow pattern.
- Tides and river levels: high sea or estuary levels may slow river discharge near the mouth.
The same rainfall can have different effects in two catchments because of differences in wetness, geology, relief, land cover, channel shape and drainage. No single factor explains every flood.
Human factors
Urban roofs and roads are often impermeable and can route runoff rapidly through drains. Development on floodplains places more people and property in exposed locations. Removing vegetation or compacting soil can change infiltration and runoff. Bridges, culverts and embankments can narrow or obstruct flow if poorly designed or blocked. Reservoir operations and water abstractions can alter river flow.
Human factors can also reduce risk. Forecasts and warnings give people time to act. Floodplain zoning can limit new development in high-risk areas. SuDS such as permeable surfaces, swales and ponds can slow and store some surface runoff. Flood-resistant design and community response plans can reduce harm.
Storm hydrographs
A storm hydrograph shows how river discharge responds over time, often alongside rainfall. The rising limb shows discharge increasing; peak discharge is the highest flow; the falling limb shows discharge decreasing toward normal levels. Lag time is the delay between rainfall peak and discharge peak, according to the graph's definition.
A short lag, steep rising limb and high peak can indicate a rapid catchment response. A long lag and gentler rising limb suggest a slower response. These patterns can relate to intense rain, wet ground, steep relief, impermeable surfaces, drainage networks or limited storage. The hydrograph does not identify which factor caused the pattern without catchment evidence.
Read both axes and units. Check whether rainfall is shown as intensity or total amount, how long the graph covers and where discharge was measured. Peak flow depends on storm and catchment conditions. Do not compare two hydrographs without checking their time scales, rainfall and basin sizes.
9. Managing flood risk
Flood management can reduce the chance that water reaches people, reduce the consequences when it does, or help communities recover. There is no single method that removes all flood risk. Strategies can combine engineered structures, catchment measures, planning, forecasting and property-level resilience.
Hard engineering
Flood walls and embankments raise barriers beside a channel. They can protect a particular stretch of a town, road or business area. They need design and maintenance, can be overtopped or breached, and may leave people relying on protection. By confining water, they may speed flow or shift risk downstream if not planned across the catchment.
Channel straightening shortens the river route and can move water through an area faster. It may reduce flooding locally but can increase flow speed downstream, damage habitats and reduce natural channel diversity. It also requires ongoing maintenance.
Channel deepening or widening increases the channel's capacity in some locations. Sediment can build up again; excavation can affect habitats; faster flow may transfer water to another community.
Dams and reservoirs can store water upstream and release it later. They can reduce some flood peaks while also supplying water or recreation. Their benefits depend on capacity, operating rules and available storage before a storm. Construction can inundate land, displace people or change downstream flows and habitats.
Flood relief channels divert water away from a vulnerable location. They can lower flow through a town but require land, design and maintenance; effects elsewhere need assessment.
Hard engineering is visible and can provide strong local protection, but it can be expensive and does not make flooding impossible. Defences are designed to manage specified events; water can exceed their design or damage them.
Planning and preparation
Flood forecasting and warnings use rainfall, river-level measurements and models to give people time to move possessions, close roads or evacuate. Warnings do not stop a flood; people need reliable messages, understood routes and time to act.
Floodplain zoning limits development in areas where water is more likely to spread. It can protect future residents and keep space for water, but land-use rules may affect property owners and local development choices.
Property-level resilience includes flood doors, raised electrical fittings, non-return valves, water-resistant materials and plans for moving important items. It can reduce damage and aid recovery but cannot protect every building from deep or fast-moving water.
Community plans and insurance can improve preparation and recovery. Access to insurance and savings varies, so two households exposed to a similar flood may have very different ability to recover.
Natural flood management
Natural flood management works with natural processes to slow, store or route water. Examples include:
- Restoring a river's connection with its floodplain.
- Re-meandering a channel that has been straightened.
- Restoring wetlands or peatlands that store water.
- Planting trees and hedges in suitable locations.
- Improving soil structure and reducing compaction.
- Creating leaky barriers in small streams.
- Making offline storage areas that hold floodwater temporarily.
- Using sustainable drainage in towns, such as swales, ponds and permeable paving.
These measures can provide wider benefits, including habitat, water quality and recreation. Their flood effect depends on location, catchment size, design, storage capacity and storm size. They may reduce or delay some peaks but cannot be assumed to prevent every flood. Several measures across a catchment may be more useful than one small feature, and maintenance still matters.
The Environment Agency's evidence on river and floodplain management explains that restoring river processes can reconnect channels to floodplains, slow some flows and store water. It also notes that the effect on flood risk depends on the river reach, catchment size and local conditions. Natural flood management should therefore be evaluated with evidence, not described as a guaranteed solution.
Compare options across the catchment
A flood wall may protect homes in one town. An upstream wetland may store water and provide habitat, but use land that could otherwise be farmed. A warning system may reduce harm without changing the channel. Zoning can prevent future exposure but cannot remove existing buildings. The strongest plan considers:
- Which places and people receive protection.
- Whether risk is shifted downstream or to another group.
- How large a flood the option is designed to manage.
- Construction and maintenance costs.
- Habitat, landscape and water-quality effects.
- How the option works with other measures.
- How well residents can access warnings and recover.
Place example: 10. The River Eden, Cumbria
The River Eden catchment in Cumbria is an illustrative example of how physical processes and human choices connect. The catchment spans high uplands and lower valleys. The Eden and Esk Management Catchment includes fells near the Lake District and the Pennines, with upland and lowland areas and substantial agricultural land in the Eden Valley. This variety means conditions differ between headwaters, tributaries and lower reaches.
Upland slopes can supply water quickly during prolonged or intense rain. Tributaries join the main river, increasing discharge downstream. Lower areas include broader valley floors and floodplains where water can spread. Communities, roads, farms and habitats occupy different parts of the catchment and experience different benefits and risks.
Storm Desmond in December 2015 caused severe flooding across Cumbria. The Environment Agency and partners described a catchment approach that considers river systems from source to sea. Responses included repairing flood defences and infrastructure, exploring upstream measures such as tree planting and flood-storage basins, and working with landowners and communities. The example demonstrates that flood management can combine traditional engineering with land management and local planning.
The River Eden catchment flood management plan is a long-term planning document, and later plans and projects can update actions. Use the Environment Agency's current material for present decisions and treat older plans as evidence of how catchment thinking developed. The key geographical idea is that an action upstream can affect water moving downstream, and a plan for one town may need to be considered with its wider catchment.
What the Eden example helps explain
- Relief and rainfall: upland areas can contribute water rapidly during wet conditions.
- Tributaries: smaller channels join the main river and change discharge.
- Valley shape: narrower upper valleys contrast with wider lower floodplains.
- Land use: agriculture, settlements, roads and habitats all interact with the river.
- Flood risk: communities differ in exposure and vulnerability.
- Management: defences, storage, land management, warnings and planning can be combined.
- Scale: local action must be considered in relation to the wider catchment.
A named catchment does not replace explanation. If you mention the Eden, say which process or management choice it illustrates. Do not attach a general claim to the river without checking a current source and local evidence.
Maps, data and evidence
11. Maps, data and fieldwork
Long profiles and maps
A long profile compares river height with distance from source or another fixed starting point. It can show the general steep upper course and gentler lower course. A map can show tributaries, contour spacing, meanders, floodplain width and settlement. Contours close together indicate steep slopes; widely spaced contours indicate gentle relief.
Maps use scale and symbols. Use the legend to distinguish river, floodplain, reservoir, settlement and contour features. Check map date because channels and built environments change. A map may not show seasonal flow or a recent channel modification.
Channel cross-sections
A cross-section across a channel shows width, depth and shape. Measure width at the water surface or bankfull edge consistently, and record the method. Depth measurements should be taken at regular intervals from a fixed bank. A cross-section can show whether a channel is shallow and broad or deep and narrow at one location.
One cross-section is not a full description of a river. Channel shape changes around bends, bridges and tributary junctions. Repeat at comparable sites and record any local structures.
Safe fieldwork methods
River fieldwork must be planned with a teacher and follow local safety guidance. Students should not enter deep, fast or unsafe water or approach unstable banks. Many measurements can be made from a safe bank or a bridge with supervision.
Possible methods include:
- Measure channel width using a tape or marked distance across a safe section.
- Measure depth at regular intervals using a graduated pole from a safe position.
- Estimate surface velocity with a float over a measured distance, repeating trials. A float measures surface movement and may not equal average channel velocity.
- Estimate discharge from cross-sectional area multiplied by average velocity, recording the assumptions.
- Measure gradient using a clinometer or map contours over a stated distance.
- Measure sediment size with a ruler at several sites using the same sampling method.
- Sketch landforms and note bank material, vegetation, structures and evidence of deposition.
- Photograph a site from a recorded viewpoint and direction, using a scale where appropriate.
Repeated measures are more reliable than one reading. Record units, date, weather, recent rainfall, site position, method and any limitations. Never collect sediment from private or protected land without permission.
Sediment measurements
If investigating downstream changes in bed load, select a consistent method. For example, measure the longest axis of a fixed number of particles chosen using the same sampling approach at each site. Record whether particles are rounded or angular and the rock types if they can be identified. Averages can hide variation, so note the range as well.
A smaller average particle size downstream may fit attrition and sorting, but fresh material from tributaries or collapsing banks can change the pattern. The results support an interpretation; they do not prove a single process on their own.
Applied enquiry: comparing three reaches
The following values are hypothetical teaching data, designed to practise interpretation. They do not describe measured sites on the River Eden. Imagine that a class compares three safe reaches after a period of similar weather, using the same method at each location.
| Reach | Mean width | Mean depth | Mean velocity | Estimated discharge | Median sampled particle size |
|---|---|---|---|---|---|
| Upper | 3.0 m | 0.25 m | 0.45 m/s | 0.34 m³/s | 65 mm |
| Middle | 10.0 m | 0.60 m | 0.55 m/s | 3.30 m³/s | 24 mm |
| Lower | 24.0 m | 1.50 m | 0.35 m/s | 12.60 m³/s | 8 mm |
The discharge values use the simplified relationship width × mean depth × mean velocity. For the upper reach, 3.0 × 0.25 × 0.45 gives about 0.34 cubic metres per second. This approach treats the channel as if its depth and velocity were uniform, which they are not. A more careful survey would divide the cross-section into smaller sections, estimate the area and velocity of each, then add the partial discharges. The table is suitable for a classroom calculation, not for flood forecasting.
What patterns can the data support?
The sample shows a general increase in channel dimensions and estimated discharge downstream. Although mean velocity is lower at the lower reach than at the middle reach, discharge is higher because the lower channel is much wider and deeper. This helps show why “the river gets faster downstream” is an unreliable summary: a river can carry more water through a larger channel without having a higher average velocity at every site.
Median particle size also decreases in this hypothetical sample. Attrition and sorting could contribute, but the data alone cannot prove that they caused the pattern. Each site may receive different sediment from tributaries, banks or land use; particle shape and rock type also affect resistance. A stronger investigation records sample size, range, shape, rock type, site position and collection method, then considers alternative explanations.
Questions and model interpretations
- Which reach has the largest estimated discharge? The lower reach, at about 12.60 m³/s. Its larger cross-sectional area outweighs the lower estimated mean velocity.
- Does the table show velocity increasing steadily downstream? No. It is highest in the middle reach and lower in the lower reach. Three sites cannot establish a universal pattern.
- What might explain the smaller median particles downstream? Attrition and sorting may make transported particles smaller, but tributary inputs and local geology could alter the sample.
- Name two improvements to the discharge estimate. Take depth measurements at regular intervals, measure velocity at several positions and depths, repeat trials, and report uncertainty and recent rainfall.
In a field report, separate observation (“the lower sample had a smaller median size”) from interpretation (“attrition may contribute”) and from conclusion (“the pattern is consistent with downstream sorting in these sampled reaches”). This keeps the strength of the claim in line with the evidence.
Interpreting hydrographs and flood maps
A hydrograph describes change through time. A flood-risk map describes a place under specified assumptions or historical evidence. Check whether a map shows river flooding, surface-water flooding, groundwater flooding or more than one source. Read its title, legend, scale, date and any likelihood categories.
A flood-risk map does not mean that every property within a coloured area will flood in every event. Nor does an area outside a mapped zone have zero risk. Mapping has a scale and method; local drainage, defences, blocked culverts and future conditions can change outcomes.
Common misconception: 12. Frequent errors
A river only erodes. Rivers also transport and deposit sediment. Deposition happens where a river loses the energy or capacity to carry some of its load.
Waterfall water cuts the gorge downstream. The waterfall retreats upstream as erosion and collapse continue, leaving a gorge behind it. Water still flows downstream.
A river is fastest everywhere on the outside of every bend. The common model has faster flow near the outer bank and slower flow near the inner bank, but real velocity patterns vary with channel shape, depth and obstacles.
Every river gets deeper and wider at every point downstream. These are general tendencies. Bedrock, tributaries, dams, abstractions and human structures create local differences.
A floodplain is unused land. Floodplains can support farming, homes, businesses, transport, habitats and recreation. The issue is how these uses interact with floodwater and risk.
Building a higher flood wall removes flood risk. A wall can lower risk locally but may be overtopped or fail, and it can affect water levels or flow elsewhere.
Tree planting stops floods. Vegetation can change interception, infiltration, roughness and storage in some places, but effects depend on location, soil, rainfall and catchment scale. It cannot prevent every flood.
A flood is automatically a disaster. Harm depends on the event, exposed people and property, warnings, vulnerability and ability to recover.
A single hydrograph identifies the cause of a flood peak. It shows the timing and magnitude of discharge at a point. Catchment evidence is needed to explain why the response occurred.
Self-check: 13. Questions
Answer from memory first. For longer questions, explain the process and connect it to evidence.
- What does river discharge measure?
- How is discharge estimated from channel area and velocity?
- How do hydraulic action and abrasion differ?
- What happens during attrition?
- How does solution differ from the other river-erosion processes?
- Compare traction and saltation.
- What is the difference between competence and capacity?
- Why might a river deposit sediment?
- What does a long profile show?
- Why are valleys often V-shaped in the upper course?
- What are interlocking spurs?
- Describe a sequence that can form a waterfall over bands of different rock resistance.
- How can a gorge be left behind a retreating waterfall?
- Where does erosion tend to occur around a meander bend?
- What is a slip-off slope?
- How does an oxbow lake form?
- How can a floodplain form and why might its soil be fertile?
- What is the difference between a natural levee and an engineered embankment?
- Why can discharge commonly increase downstream?
- Name two reasons a river's downstream pattern may be interrupted.
- Give three physical factors that may increase flood response.
- How can urban land use alter runoff?
- What is the difference between a flood hazard and flood risk?
- What do peak discharge and lag time show on a storm hydrograph?
- Give one benefit and one limitation of a flood wall.
- Give one benefit and one limitation of floodplain restoration.
- How can flood warnings reduce harm without changing river flow?
- Why should flood management be planned at catchment scale?
- What can a river fieldworker learn from sediment size and shape?
- How does the River Eden example connect physical geography with human choices?
Suggested responses
- It measures the volume of water passing a point in the channel per unit of time.
- Estimate the channel's flowing cross-sectional area and multiply by average velocity.
- Hydraulic action is force from water acting on bed or banks; abrasion is sediment carried by water scraping those surfaces.
- Transported particles collide, breaking into smaller and often rounder fragments.
- Solution dissolves soluble minerals; the other named processes move or collide with physical material.
- Traction rolls or drags larger particles along the bed; saltation bounces smaller stones or coarse sand.
- Competence is the largest particle size transported; capacity is the total quantity of load.
- The river may slow, become shallower, spread out, lose discharge or enter a lake or sea and lose carrying ability.
- It shows river height against distance along the river from source toward mouth.
- Vertical erosion cuts down while weathering and slope movement add material from steep valley sides.
- Alternating valley-side ridges around which a river winds in an upland valley.
- Softer rock erodes faster, making a step; water deepens a plunge pool and undercuts the hard cap, which can collapse and leave a retreating waterfall.
- The waterfall moves upstream through undercutting and collapse, leaving a narrow steep-sided valley.
- Faster flow generally erodes the outer bank, making a river cliff; slower inner flow encourages deposition.
- A gentler inside-bank deposit, also called a point bar.
- Erosion enlarges a bend until the neck is narrow; the river cuts through, sediment seals the old entrances and the abandoned loop remains.
- Overbank floods deposit alluvium across the valley floor. Fine nutrient-rich sediment can make soils fertile.
- A natural levee forms from flood deposition near the bank; an engineered embankment is built by people.
- Tributaries add water as drainage area grows, though abstractions, reservoirs, infiltration and evaporation can alter the pattern.
- A dam or reservoir can alter flow; resistant rock or a tributary can create a local change. Other examples include abstraction and channel modification.
- Intense or prolonged rainfall, saturated soil, steep relief, impermeable rock or snowmelt.
- Roofs and roads limit infiltration and drains can route runoff quickly to a channel.
- Hazard describes the possible flood event; risk concerns likely harm to people, property or ecosystems, depending on exposure and vulnerability.
- Peak discharge is the highest measured flow; lag time is the delay between rainfall peak and discharge peak as defined on the graph.
- A wall can protect a chosen area; it can be costly, be overtopped or shift effects elsewhere.
- Restoration can reconnect a river and floodplain, slow some flows and support habitat; its flood effect is site-specific and it cannot prevent every flood.
- Warnings give people time to evacuate, move valuables, close roads or prepare, reducing exposure or harm.
- Water moves between upstream and downstream areas; a local action can alter flood timing and risk elsewhere in the basin.
- Size and roundness can suggest transport and abrasion, but new sediment may enter and a small sample does not represent the whole river.
- The Eden catchment includes upland and lowland areas, tributaries, farms, settlements and floodplains. Flood management combines decisions about defences, land, storage, warnings and community needs.
14. Practice tasks
Task A: Explain a waterfall and gorge
Write a paragraph explaining how a waterfall can retreat upstream and leave a gorge. Include differences in rock resistance, erosion at the base and collapse.
Model response: If a river crosses a hard layer above softer rock, the softer rock may erode more quickly and create a step. Water falling over the step can scour a plunge pool through hydraulic action and abrasion. The pool undercuts the softer rock beneath the hard cap. Unsupported hard rock can break off and fall. Repeated undercutting and collapse move the waterfall upstream, leaving a narrow gorge behind it. The process may differ where a waterfall forms at a fault or another sudden change in valley level.
Task B: Explain meander migration
A student observes a steep outer bank and a shallow deposit on the inside of a bend. Explain how the bend may change over time.
Model response: Flow is generally faster along the outside of the bend, where it can erode the bank and form a river cliff. Slower water on the inner bend deposits sediment to make a slip-off slope. Erosion on the outside and deposition on the inside can make the meander migrate sideways and become more pronounced. Flow varies locally, so the explanation should be checked against channel shape and evidence.
Task C: Read a hydrograph
A storm hydrograph has a steep rising limb and a short lag time. Give two possible explanations and identify one type of catchment evidence that could help distinguish them.
Model response: Intense rainfall may deliver water rapidly, or saturated ground, steep relief, impermeable surfaces and drains may create quick runoff. Rainfall records show storm intensity, while land-use, soil and geology maps help test catchment explanations. One graph alone cannot identify the cause.
Task D: Compare flood-management choices
A town beside the River Eden is considering a higher flood wall, upstream wetland restoration and improved flood warnings. Compare their effects and recommend how the town should decide.
Model response: A higher wall may protect properties along a defined reach but costs money and may be overtopped or affect water elsewhere. Wetland restoration can store some water and support habitats, but its flood effect depends on location and the size of the catchment and flood. Warnings do not change the river but can give people time to act. A town should compare modelled risk, who is protected, downstream effects, cost, maintenance, habitat and community response, then consider a combination rather than assume one measure removes all risk.
Task E: Evaluate a floodplain
A developer wants to build homes on a flat, fertile floodplain. Give reasons supporting the proposal, reasons against it and a balanced conclusion.
Model response: The site is flat and may be close to transport, jobs and services; building could support housing needs. However, the land may flood, and homes would add exposure and possible recovery costs. Development could also reduce space for floodwater and affect habitats. A decision should use current flood mapping, consider safer locations and design, protect routes for water and assess whether essential infrastructure and residents could be protected. The site should not be treated as risk-free just because it is currently dry.
Revision points: 15. Consolidation
- Link process → landform → evidence.
- Distinguish hydraulic action, abrasion, attrition and solution.
- Explain transport using traction, saltation, suspension and solution load.
- Use competence for largest particle and capacity for total load.
- Compare general upper, middle and lower course patterns without treating them as strict rules.
- Explain waterfalls, meanders, oxbow lakes, floodplains and levees as sequences.
- Read hydrographs with rainfall and catchment characteristics.
- Separate flood hazard from risk; include exposure and vulnerability.
- Compare engineering, warning, planning and natural flood management by place, people, cost and downstream effect.
- Treat the Eden as an illustrative catchment where upland runoff, tributaries, floodplains and people connect.
Curriculum alignment
- Curriculum coverage IDs:
ks3.physical.hydrology,ks3.physical.rivers,ks3.human-physical-interaction - Related practice packs:
ks3_geography_rivers - Shared concept tags:
rivers,fluvial-processes,flood-risk,landforms
Sources
- Curriculum/specification: Department for Education: England Geography programme of study
- River erosion and meanders: British Geological Survey: Erosion
- Natural flood management: Environment Agency and Defra: Natural flood management
- River and floodplain restoration evidence: Environment Agency: River and floodplain management
- Eden catchment context: Environment Agency: Eden and Esk Management Catchment
- Eden flood management example: Environment Agency and partners: Cumbria Flood Action Plan
- Natural flood management in Cumbria: Environment Agency: Using the power of nature to increase flood resilience
- Use current Environment Agency maps and local sources for present flood warnings, forecasts and risk boundaries. Flood plans and project details can change.