 FoxChild@Learn
10. Ecosystems, biomes and interdependence
Curriculum status: Required core content.
This guide follows the England Key Stage 3 Geography programme of study. It explains how living communities interact with climate, soils, water, relief and human activity, then connects local ecosystems to the world's broad biomes. Epping Forest in southeast England is used as an illustrative local example. It is not the only ecosystem schools may study.
An ecosystem is a connected, changing system. Sunlight supplies energy to most food webs, water and nutrients support growth, and organisms affect one another and their physical surroundings. People rely on ecosystem processes for food, materials, clean water, climate regulation, recreation and cultural meaning. These benefits depend on where an ecosystem is and how it is managed.
The guide links to a separate AQA GCSE rainforest chapter. Here, the rainforest is introduced as one biome for comparison; the detailed rainforest case material belongs in that later guide.
How to use this chapter
Think in three scales:
- Organism and habitat: what lives in a place, and what conditions does it need?
- Ecosystem: how do organisms, soil, water, air, energy and nutrients interact there?
- Biome and world pattern: how do climate, latitude, altitude and ocean or relief effects help explain broad patterns of vegetation and wildlife?
For each explanation, name the component that changes, state the mechanism, and trace a consequence. For example: if prolonged drought reduces pond water, the area of shallow habitat may shrink, aquatic plants may decline, and organisms that feed or shelter there may be affected. Other changes, such as groundwater, shade or pond depth, can alter the result, so check evidence before making a strong claim.
Required knowledge
You should be able to:
- Distinguish biotic and abiotic components and describe a local ecosystem as an interacting system.
- Explain how producers capture energy, how food chains connect into food webs and how decomposers return nutrients to the environment.
- Distinguish the one-way flow of energy from the cycling of matter.
- Explain how light, temperature, rainfall, water, soil, relief and disturbance influence organisms.
- Describe broad global biome patterns without treating their boundaries as exact lines.
- Compare terrestrial and aquatic ecosystems and explain how scale affects the patterns observed.
- Explain how biodiversity and ecosystem structure can affect resilience and the services people receive.
- Describe how a change to one component may have direct and indirect effects elsewhere in a food web or landscape.
- Use an example of a UK habitat and a named global biome to show connections between climate, organisms and human use.
- Interpret a climate graph, ecosystem diagram, map, field sample and time series with care.
- Recognise that ecosystem benefits can involve trade-offs and that benefits and costs are not shared equally.
- Support a conclusion with observations, a stated scale, and a note about uncertainty.
Key vocabulary
| Term | Meaning |
|---|---|
| Ecosystem | A community of organisms interacting with each other and with their physical environment. |
| Habitat | The place and conditions in which an organism lives. |
| Biotic | A living component, such as a plant, animal, fungus or microorganism. |
| Abiotic | A non-living physical or chemical condition, such as light, temperature, water or soil pH. |
| Organism | An individual living thing. |
| Population | Members of the same species living in a particular area at a particular time. |
| Community | Populations of different species living and interacting in an area. |
| Species | A group of organisms that can reproduce with one another in the usual biological definition. |
| Biodiversity | The variety of life, including differences among species, habitats and genes. |
| Producer | An organism, usually a plant or alga, that makes organic material using an energy source such as sunlight. |
| Consumer | An organism that gets energy and materials by eating other organisms or organic matter. |
| Decomposer | An organism, commonly a fungus or bacterium, that breaks down dead material and waste. |
| Detritivore | An organism that feeds on dead organic matter and breaks it into smaller pieces. |
| Food chain | A simplified sequence showing who eats whom and the direction energy is transferred. |
| Food web | A network joining many feeding relationships in an ecosystem. |
| Trophic level | A feeding position in a food chain or food web. |
| Herbivore | A consumer that eats plants or algae. |
| Carnivore | A consumer that eats animals. |
| Omnivore | A consumer that eats both plant and animal material. |
| Predator | An animal that hunts, kills and eats another animal. |
| Prey | An organism hunted and eaten by a predator. |
| Biomass | The mass of living biological material in a stated area, population or sample. |
| Nutrient | A substance an organism needs for growth and functioning. |
| Nutrient cycle | Movement and recycling of nutrients between organisms and the non-living environment. |
| Soil | A mixture of mineral particles, organic matter, water, air and organisms. |
| Leaf litter | Fallen leaves and other plant material on the ground surface. |
| Decomposition | Breakdown of dead organic matter into simpler substances. |
| Photosynthesis | The process by which plants, algae and some bacteria use light energy to make organic material from carbon dioxide and water. |
| Respiration | A set of processes in cells that release usable energy from organic molecules. |
| Adaptation | A feature or behaviour that helps an organism survive or reproduce in particular conditions. |
| Biome | A broad region with characteristic climate and large-scale vegetation and animal communities. |
| Vegetation | Plant cover in an area. |
| Climate | Long-term patterns and averages of weather, including seasonal differences. |
| Primary productivity | The rate at which producers create new organic material in an area. |
| Disturbance | An event or pressure that changes an ecosystem, such as drought, fire, pollution or land clearance. |
| Succession | A sequence of changes in the species and structure of a place over time. |
| Resilience | The capacity of a system or community to recover or reorganise after change. |
| Ecosystem service | A benefit people obtain from ecosystem processes, such as food, water regulation, habitat or recreation. |
| Provisioning service | A material product supplied by an ecosystem, such as food, timber or fresh water. |
| Regulating service | A process that influences environmental conditions, such as water filtration, erosion control or climate regulation. |
| Cultural service | A non-material benefit, such as recreation, education, identity or spiritual value. |
| Supporting process | An underlying process, such as soil formation, habitat provision or nutrient cycling, that helps ecosystems function. |
| Food security | Reliable access to sufficient, safe and nutritious food; it depends on more than the amount produced. |
| Invasive non-native species | A species introduced beyond its natural range that spreads and can cause harm to nature, people or the economy. |
| Habitat fragmentation | Breaking a larger habitat into smaller patches separated by areas that are harder for organisms to cross. |
| Quadrat | A square sampling frame used to record organisms or ground cover in a small area. |
| Transect | A line or belt along which observations are recorded to study change across a place. |
How the geography works
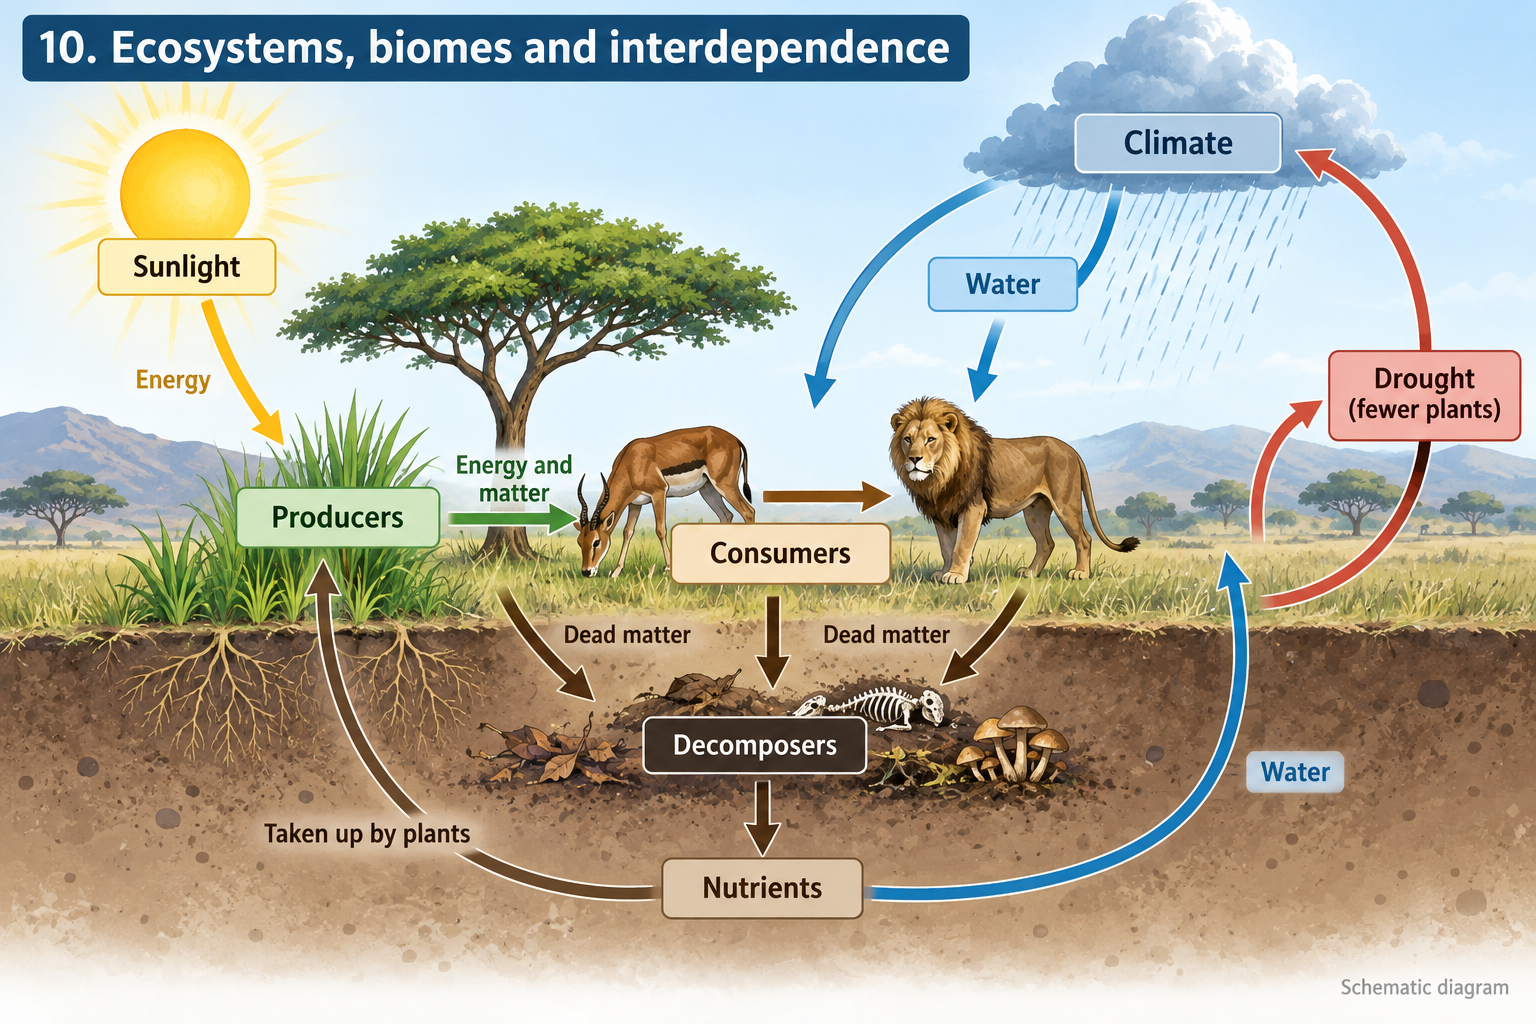
Most terrestrial food webs are powered by the Sun. Producers capture some incoming energy in organic material. Consumers gain matter and energy by feeding. Decomposers break down dead organisms and waste, returning nutrients to soil, water or the atmosphere. Energy moves through the web and some is transferred to the surroundings as heat; matter is reused in cycles.
Climate influences the amount and timing of heat and water available. Soils, geology, slope, shade, disturbance and human use influence which species can establish. Organisms also change their surroundings: roots hold soil, plants provide shade, fungi decompose wood, and animals move seeds or nutrients. Ecosystems are therefore open systems, with energy and materials entering and leaving.
1. Ecosystem, habitat and scale
What counts as an ecosystem?
A pond, woodland, dune, farm, estuary, coral reef or urban park can be studied as an ecosystem. There is no single natural boundary that must be used for every investigation. A class might define a pond edge, a woodland plot, a river catchment or a region containing connected habitats. The boundary should fit the question.
Within a chosen area, identify:
- Biotic components: plants, animals, fungi, algae, bacteria and other living organisms.
- Abiotic components: light, temperature, water, air, soil, rock, nutrients, slope and disturbance.
- Interactions: feeding, competition, decomposition, pollination, shade, water uptake, predation, shelter and movement.
- Flows and stores: energy, water, nutrients, organisms, sediment and human inputs or removals.
A habitat is where an organism lives; an ecosystem includes interactions among organisms and the physical setting. A tree trunk can provide a habitat for lichens and insects, while a woodland ecosystem includes the tree, its soil, rainfall, fungi, animals and human management.
Ecosystems are open and dynamic
A forest receives sunlight and rainfall, loses water through evaporation and transpiration, exchanges gases with the atmosphere, and can receive seeds, animals, pollution or nutrients from elsewhere. A pond can gain water from rain or a stream and lose it through evaporation, drainage or abstraction. Neither is a sealed container.
Conditions vary by hour, season and year. A woodland floor may be shaded in summer and brighter in early spring before leaves emerge. A pond can be warm and shallow at one edge and cool and deep at another. A drought year and a wet year can support different patterns. A field visit records conditions at one time; a long-term account needs repeated observations.
Scale changes the picture
At a small scale, a rotting log can be studied as a microhabitat for fungi, woodlice and beetles. At woodland scale, canopy cover, glades and paths affect light, movement and temperature. At landscape scale, woodland patches may be linked by hedges or separated by roads and farms. At global scale, climate bands help explain the distribution of broad biomes.
A pattern visible at one scale may not apply at another. A woodland quadrat can contain many plant species while the surrounding landscape has lost most of its original woodland. A biome map shows broad zones but cannot show every pond, valley, farm or habitat patch.
2. Living and non-living components
Biotic components
The biotic part includes individual organisms, populations and communities. A population is the members of one species in an area; a community includes different populations living and interacting there. Species do not all need each other in the same way. A flower may provide nectar to an insect, while the insect transfers pollen between flowers. A predator may reduce prey numbers, but that effect can change if the predator has another food source.
Biodiversity includes more than a species list. It can refer to variety within species, the number and balance of species, differences between habitats and genetic variation. The meaning of a biodiversity comparison depends on the measure used. Species richness counts the number of different species; abundance counts individuals; evenness describes how balanced the counts are. A small site with many common species may still lack rare habitat features.
Abiotic components
Physical conditions affect which species can survive and reproduce. Light is needed for photosynthesis, but its availability varies under a canopy. Temperature affects growth, activity and the length of the growing season. Water is essential, but too little or too much can create stress. Soil texture, depth, acidity and nutrient content influence roots and decomposition. Slope and aspect can affect drainage, sunlight and exposure to wind.
Some conditions vary together. A sunny south-facing slope may be warmer and drier than a shaded north-facing slope. A compacted path may absorb less water and support different plants from nearby soil. To explain a pattern, do not assume temperature alone is the cause. Check other factors and the scale of the observation.
Limiting factors and tolerance
An organism may be able to live across a range of conditions but grow best within a narrower range. A limiting factor is a condition that restricts growth or distribution. In a dry grassland, water availability may limit plant growth; under a dense forest canopy, light may limit ground plants; in an overgrazed patch, repeated browsing may limit seedlings.
Different species have different tolerances. A drought-tolerant plant can survive conditions that a moisture-loving plant cannot. Adaptations may be structural, physiological or behavioural. Thick leaves can reduce water loss; deep roots can reach soil moisture; some animals are active at night to avoid heat. These adaptations do not mean the species is invulnerable to all change.
3. Energy flows through food chains and webs
Producers and photosynthesis
Green plants, algae and some bacteria are producers because they make organic material using energy, usually from sunlight. Photosynthesis uses light, carbon dioxide and water to build sugars and release oxygen. These sugars can be used in growth and respiration or stored in plant tissue. A plant may be eaten, shed leaves or die; its material then enters consumers or decomposers.
Not all sunlight reaching an ecosystem is captured by plants. Some light is reflected, passes through leaves or arrives at a wavelength plants use less effectively. Temperature, water, nutrients, season and leaf area also affect growth. A rainforest may have high plant productivity because warmth and water are available for much of the year, but the forest floor can still receive limited light beneath a dense canopy.
Consumers and trophic levels
Primary consumers feed on producers. Secondary consumers feed on primary consumers; tertiary consumers may feed at higher levels. Omnivores can occupy more than one level because they eat different kinds of food. An organism may also change its feeding role at different life stages or seasons.
A food chain is a simplified path through a web. For example:
Oak leaves → caterpillar → blue tit → sparrowhawk
The arrows point from the food to the organism receiving the energy and matter. If an arrow is reversed, the diagram suggests the predator is eaten by the prey. Always explain the direction of arrows in a key.
Why a food web is more realistic
A food web joins chains that share organisms. A small woodland web could include tree seeds eaten by mice and birds, insects feeding on leaves, spiders feeding on insects, and owls or foxes using more than one prey species. Fungi and bacteria break down dead material, while earthworms and other detritivores fragment leaf litter.
A web shows alternative feeding links. If one prey becomes less common, a predator may feed on another species; the size of the effect depends on the predator's diet and the availability of alternatives. A complex web does not guarantee that every species is safe, but it can show why removing one organism may have more than one consequence.
Energy transfer is not recycling
Energy flows through food webs. Some energy captured by a plant is used in respiration; some plant material is not eaten; some food is not digested; consumers use energy for movement and body processes. A portion becomes biomass available to another trophic level. Much energy is ultimately transferred to the surroundings as heat.
Matter behaves differently. Carbon, water and mineral nutrients can move between organisms, soil, water and the atmosphere. A dead leaf can be decomposed, its nutrients can enter soil, and plants can absorb them again. Energy is not returned to the Sun by decomposers; the system needs a continuing energy input.
Do not treat a rule such as “ten per cent transfers” as a fixed measurement for every food web. The amount varies with organisms, food quality, temperature, activity and the way the data are measured. The useful general idea is that less usable energy is available at higher trophic levels, so food chains often have a limited number of steps.
Decomposers, detritivores and nutrients
Fungi and bacteria release enzymes that help break down dead material and waste. Detritivores, including some soil invertebrates, feed on fragments and make them smaller. Decomposition releases mineral nutrients into soil or water where producers may use them again.
Decomposition rates are affected by temperature, moisture, oxygen, the chemistry of the material and the decomposer community. In cold or waterlogged places, breakdown can be slow and organic matter may accumulate. In a warm, moist setting, decomposition can be rapid. Soil nutrients can still be scarce if plants absorb them quickly, heavy rain leaches soluble minerals or the soil has little stored organic matter.
4. Soil, water and nutrient cycling
Soil as a living store
Soil is made from mineral particles weathered from rock and organic matter from organisms. It contains pore spaces with air and water, roots, fungi and many small organisms. Soil stores water and nutrients, anchors plants and supports decomposition.
A simple woodland nutrient pathway is:
- Trees and ground plants absorb water and mineral nutrients.
- Plants build leaves, wood and roots.
- Leaves and dead wood enter litter stores.
- Fungi, bacteria and soil animals break the material down.
- Nutrients become available in soil water or soil particles.
- Roots take up some of those nutrients again.
The pathways differ by habitat. Rain can wash nutrients downward; runoff can move soil into streams; fire can release some nutrients into ash and the air; grazing animals move nutrients through the landscape in dung.
Water cycle links
Rainfall may be intercepted by leaves, reach the ground as throughfall, run off, infiltrate soil or move deeper as groundwater. Plants take up water and release some back to the atmosphere through transpiration. Shade and leaf litter can influence soil moisture and surface temperature.
A woodland can affect how water moves, but the result depends on species, soil, slope, drainage, ground compaction and the scale of planting. Trees planted in the wrong place can reduce water availability; a diverse, well-positioned woodland can support water quality and slow some runoff. Ecosystems provide context-dependent services, not guaranteed benefits everywhere.
Carbon cycle links
Plants absorb carbon dioxide during photosynthesis and store carbon in leaves, wood and roots. Dead material can transfer carbon to soil. Respiration and decomposition release some carbon dioxide back to the atmosphere. Fire can release stored carbon rapidly. If a forest is cleared and the wood or soil is burned or decomposed, some of its stored carbon returns to the atmosphere; the amount depends on what happens to the vegetation and soil.
Carbon storage can help regulate climate, but a forest is not a permanent or unlimited carbon store. Growth, harvest, fire, disease, soil disturbance and climate stress affect whether the ecosystem stores more carbon over time. A map of tree cover alone does not reveal the age, condition, species or carbon balance of the forest.
Nutrient availability
Plants need mineral nutrients such as nitrogen and phosphorus, but their availability differs by soil and ecosystem. Nutrients can be held in living biomass, litter, soil water and mineral particles. Fertiliser adds nutrients to farms, but excess nutrients can be carried into streams and lakes. This may increase algal growth; when algae die and decompose, oxygen in the water can fall and aquatic organisms can be harmed.
The pathway matters. To explain an effect, trace the source, route and receiver: fertiliser applied to a field; rain carries dissolved nutrients into a ditch; the ditch flows to a pond; extra nutrients change plant or algal growth. A single measurement of water colour cannot establish the cause; consider other evidence such as nutrient samples, rainfall, land use and flow.
5. Broad global biomes
What is a biome?
A biome is a broad geographic region associated with characteristic climate and large-scale vegetation. It can include many separate ecosystems that share some broad features but differ in species, soils, disturbance, land use and local climate. The tropical rainforest biome, for example, occurs in more than one continent; forests in the Amazon, Congo Basin and Southeast Asia are not identical.
Biome maps use a classification system. One map may divide grasslands into tropical savanna and temperate steppe; another may use fewer categories. Map boundaries show transitions and patterns, not walls that organisms cannot cross. Mountain slopes and coasts can contain different habitats within a region coloured as one biome.
Climate and world pattern
Latitude influences average solar energy received, while altitude changes temperature and exposure. Ocean currents, prevailing winds and relief alter rainfall and seasonal conditions. Equatorial regions are often warm throughout the year; subtropical high-pressure zones include many deserts; mid-latitude regions often have seasons; high latitudes are cold for long periods. These are broad patterns with important regional variation.
Rainfall amount and seasonality are as important as annual totals. A place receiving rain in one short season may support different plants from a place with similar rainfall spread across the year. Temperature affects evaporation and growing season. Soil, fire, grazing, storms and human land use help explain why vegetation is not determined by climate alone.
A broad comparison of terrestrial biomes
| Biome | Broad climate pattern | Typical vegetation pattern | Geographic illustration |
|---|---|---|---|
| Tropical rainforest | Warm through the year with high rainfall, though some forests have a drier season. | Dense, layered tree cover and high plant growth where water, heat and nutrients allow. | Amazon Basin, parts of central Africa and Southeast Asia. |
| Savanna and tropical grassland | Warm conditions with distinct wet and dry seasons. | Grasses with scattered trees or shrubs; fire and grazing can help shape the pattern. | Parts of eastern and southern Africa, South America and northern Australia. |
| Hot desert | Very low and irregular rainfall, with strong heat or temperature contrasts. | Sparse vegetation with water-conserving adaptations and large bare areas. | Sahara and parts of Arabia, Australia and the Atacama. |
| Temperate grassland | Seasonal temperatures and rainfall that may be too limited, variable or disturbed for continuous forest cover. | Grasses and herbs, often with fertile soils in some regions. | Prairies of North America and steppes of central Eurasia. |
| Temperate forest | Seasonal climate with sufficient moisture for tree growth. | Deciduous broadleaf, mixed or coniferous forest depending on climate and soil. | Parts of Europe, East Asia and eastern North America. |
| Boreal forest, or taiga | Long cold winters, short growing seasons and a strong seasonal contrast. | Large areas of coniferous forest, with bogs and open patches in many places. | Northern North America and Eurasia. |
| Tundra | Very cold climate, short growing season and often frozen subsoil. | Low-growing plants, mosses, lichens and shrubs; trees are limited. | Arctic regions of northern Canada, Greenland and Eurasia, plus high mountains. |
| Mediterranean-type woodland and shrubland | Hot, dry summers and mild, wetter winters. | Shrubs and trees adapted to drought and periodic fire. | Parts of the Mediterranean basin and similar climate regions elsewhere. |
These labels simplify a world of transitions. A high mountain can have vegetation zones that change with altitude, even though its latitude is constant. A coastal region can be cooler or wetter than an inland place at the same latitude. A savanna can contain woodland, grassland, riverine forest and wetlands within the same mapped biome.
Reading a biome map and climate graph together
A biome map shows spatial pattern; a climate graph shows temperature and precipitation through the year for a weather station or gridded location. To compare them:
- Locate each place using latitude, continent and nearby physical features.
- Read the precipitation axis and units; check if bars are monthly totals.
- Read the temperature axis and determine whether it shows mean, maximum or minimum.
- Identify wet and dry periods, seasonal temperature range and possible growing season.
- Compare those conditions with the broad vegetation pattern on the map.
- Note possible influences such as altitude, soil, fire, grazing, water access or land use.
A climate graph does not describe every part of a biome. A station may be in a city or valley, while the mapped ecosystem includes uplands and lowlands. Do not infer one local habitat from a broad map colour alone.
6. Terrestrial, freshwater and marine ecosystems
Terrestrial ecosystems
Terrestrial ecosystems occur on land and include woodland, grassland, desert, tundra, heathland and farmland. Water availability, soil, light, temperature and disturbance influence them. Even within a forest, the canopy, understory, leaf litter, deadwood, stream edges and glades form different habitats.
Plant structure influences the conditions below it. A dense canopy intercepts light and rainfall; gaps allow more light to reach seedlings and ground plants. Roots interact with soil, while leaf litter can slow surface water and provide material for decomposers. A woodland is a collection of connected microhabitats rather than a uniform block of trees.
Freshwater ecosystems
Ponds, lakes, rivers, streams, marshes and wetlands contain freshwater communities. Their ecology varies with flow, depth, light, temperature, oxygen, nutrients and connection to land. A shaded stream may be cool; a shallow pond can warm more quickly; a river's flow can transport sediment and organisms downstream.
Land use around a water body matters. Soil, fertiliser, road runoff, wastewater, livestock and tree cover may influence water quality and temperature. A wetland can store water and support wildlife, but drainage, pollution, invasive species or altered flow can change its function. A water sample is evidence from a place and time, not a complete description of the catchment.
Marine and coastal ecosystems
Marine ecosystems include rocky shores, sandy beaches, mudflats, saltmarshes, seagrass beds, kelp forests, coral reefs and open ocean. Light, depth, salinity, wave energy, temperature and nutrient supply help shape the organisms present. Tides expose and cover parts of a shore; storms can move sediment and disturb habitats.
Coasts connect marine and terrestrial systems. A saltmarsh may slow some waves, trap sediment and provide nursery habitat; its effects depend on its condition, width, water depth and wave setting. A sandy beach provides feeding and nesting areas for some species, while visitor pressure, erosion and coastal structures can alter that habitat. Coastal processes and management are explained further in the separate coasts guide.
7. Interdependence and change
Direct and indirect links
A direct link connects two components, such as a bee feeding on nectar. An indirect link happens through another component: fewer flowering plants may reduce pollinator food; fewer pollinators may reduce seed formation for some plants; less seed may affect animals that eat it.
When a change occurs, draw a causal chain:
Change → physical response → organism response → wider consequence
For instance, a longer dry period can lower soil moisture. Some seedlings may grow more slowly or die. Reduced plant cover can expose soil to erosion, which can carry sediment into a stream. The actual outcome varies by species, soil, roots, shade and later rainfall.
Predators, prey and population changes
If a predator declines, some prey populations may increase, but this depends on other predators, food supply, disease, competition and habitat. If a plant declines, herbivores may switch food or move; predators may follow or use other prey. Food webs help identify possible pathways but do not by themselves predict exact population sizes.
A population count is a snapshot or sampled estimate. Animals move and may be difficult to observe; plants can be dormant or hidden. Repeated surveys, consistent methods and a clear survey area improve interpretation. A change in a count may reflect detectability or season as well as a real population shift.
Adaptation and distribution
Species survive in conditions within their tolerance through features and behaviours. Desert plants may reduce water loss; arctic plants may grow close to the ground; woodland species may be adapted to shade, seasonal light or deadwood. Adaptations are linked to particular conditions and trade-offs. A species adapted to drought may grow slowly, while a fast-growing species may require more reliable water.
A species' range can shift if climate, habitat connections, food sources or land use change. Some organisms can move or adjust their behaviour; others are limited by barriers, slow reproduction or specialised habitat needs. A warmer average alone does not describe the full change: rainfall, extreme events, fire, pests, disease and human land use can also influence the ecosystem.
Succession, disturbance and recovery
After a disturbance, species and habitat structure can change over time. A bare surface may first be colonised by small plants; shrubs or trees may establish later if soil and conditions permit. This process is called succession. The sequence varies with soil, water, seed sources, grazing, climate and disturbance. It does not always lead to a single final forest condition.
Disturbances include drought, storm, fire, disease, grazing, flood, pollution, tree felling and construction. Some are part of long-standing ecosystem processes. The effect depends on intensity, frequency, timing and ecosystem condition. A small gap created by a fallen tree may increase woodland diversity; a severe repeated disturbance may prevent recovery.
Resistance describes how much a system changes during disturbance; resilience describes its capacity to recover or reorganise. Neither guarantees that the original ecosystem will return. If climate or land use changes, the new conditions may favour a different community.
Biodiversity, resilience and connectivity
Different species can perform related roles, but having more species does not automatically mean an ecosystem is resilient to every pressure. Some species are especially important to a particular process; others may have a unique habitat requirement. Diversity across habitats, structures and age classes can provide more options for species and may reduce the risk that a single pressure affects everything equally.
Habitat patches connected by hedges, streams, tree lines or stepping stones can make movement easier for some organisms. Roads, buildings, intensive land use and other barriers can isolate populations. A corridor can help movement but is not a substitute for a large, healthy habitat. Its value depends on which organisms use it and what the surrounding landscape is like.
8. People and ecosystem services
Ecosystems support livelihoods and wellbeing
People depend on natural systems in ways that can be obvious or less visible. Ecosystems can provide food, timber, fibre and freshwater. They can regulate water movement, soil stability, pollination, local climate and waste breakdown. They also provide recreation, education, cultural identity and a sense of place.
A service framework groups benefits to help people see how nature contributes to decisions. It does not mean every benefit can be given a simple price. A woodland may be managed for timber while also supporting wildlife, storing carbon, slowing some runoff, offering walking paths and holding cultural or historical importance. The benefits may be shared differently among owners, nearby residents and visitors.
Trade-offs and choices
Land may be used for food production, housing, transport, recreation, timber, energy or habitat. Increasing one use may reduce another, though well-planned management can sometimes provide several benefits together. A new road can improve access but fragment habitat. A tree-planting project can create shade and store carbon but may be unsuitable on species-rich open grassland. A wetland may store water and support birds but affect farming on land returned to flood storage.
To assess a decision, ask:
- Which service or resource is being increased?
- Which habitat, species, group or livelihood could be affected?
- At what spatial and time scale are benefits and costs measured?
- Who owns or manages the land?
- What evidence would reveal unintended effects?
- Could the plan be adjusted if monitoring shows harm?
A decision is geographical because it depends on location, scale, connections and different people's relationships with place.
Ecosystems and food security
Food security depends on the availability of food, people's access to it, how it is used and whether that access is stable over time. Ecosystems support agriculture through soil formation, nutrient cycling, water supply and pollination. Farming also changes ecosystems through land clearance, irrigation, grazing, pesticides and fertilisers.
There are choices between food production and habitat protection, but the relationship is not always a simple either-or. Soil conservation, diverse field margins, crop rotations, water management and agroforestry may support several functions. Each approach has costs, limits and place-specific results. Food production must be assessed with productivity, affordability, nutrition, worker conditions and environmental effects in view.
Ecosystem service classification
| Category | What it describes | Examples |
|---|---|---|
| Provisioning | Material products obtained from ecosystems. | Crops, fish, timber, fibre and fresh water. |
| Regulating | Ways ecosystems influence environmental conditions. | Water filtration, erosion reduction, shade, carbon storage and some flood attenuation. |
| Cultural | Non-material ways people benefit. | Recreation, learning, identity, landscape enjoyment and spiritual meaning. |
| Supporting processes | Ecological functions that underpin other benefits. | Soil formation, nutrient cycling, habitat and primary production. |
The categories overlap. A forest's soil may support tree growth, which supplies timber and habitat; its paths may support recreation. A strong description names the process and the beneficiaries rather than merely labelling the place as “valuable.”
9. Human pressures and ecosystem management
Common pressures
Ecosystems can be changed by land conversion, habitat fragmentation, pollution, climate change, overharvesting, altered water flows, invasive non-native species and pests or diseases. These pressures often interact. A fragmented habitat may make it harder for a population to recolonise after drought; warmer conditions may enable a pest to spread; pollution can be more harmful where a stream has little water.
Impacts vary in extent, duration and reversibility. A temporary disturbance may be followed by recovery if the ecosystem has suitable conditions and connected seed or species sources. A permanent land conversion removes the habitat unless it is later restored. Some pollution or soil changes persist after the visible pressure ends.
Management approaches
Management may protect habitats, restore degraded areas, connect patches, reduce pollution, control invasive species, change grazing or visitor access, manage fire, or monitor populations. The appropriate action depends on the pressure and desired outcome. A blanket rule can cause harm if it ignores local ecology. For example, stopping all disturbance might reduce a habitat that depends on occasional fire or grazing.
Protected status can limit some damaging activities and guide management, but it does not guarantee perfect condition. Habitats still experience climate pressures, invasive species and external pollution. Restoration can take time and may not recreate the original ecosystem exactly.
Monitoring and adaptive management
Monitoring tests whether a management action is working. A useful plan begins with a question and baseline: what is changing, where, how often, and for which species or physical condition? Repeat observations using a consistent method, compare with a reference area if appropriate, and record weather and land-use changes that could affect the result.
Adaptive management uses evidence to adjust decisions. If a path is damaging a sensitive ground habitat, managers might redirect visitors and then monitor vegetation. If a pond becomes overgrown, a restoration action may open part of the water while retaining refuge habitat. Monitoring should include unintended effects, not only the target species or service.
Place example: 10. Epping Forest, Essex and northeast London
Epping Forest is a local illustration of a habitat mosaic and long-term interaction between people and nature. It lies across Greater London and Essex and includes ancient semi-natural woodland, wood pasture, grassland, heathland and wetland habitats such as streams, ponds and lakes. The City of London manages the forest and records wildlife and habitat information to inform its work.
A mosaic contains patches with different conditions. Woodland shade supports organisms that need cooler or darker places; grassland and heath provide more open, sunlit habitat; ponds and wetlands provide water and feeding or breeding areas for aquatic and amphibious organisms. Edges between habitats can support species that use more than one patch. The combination matters: simply counting the area of “forest” would miss much of the variation.
Pollarding and deadwood
Pollarding is a traditional practice of cutting a tree above browsing height so that new growth develops higher on the trunk. Historic pollarding helped shape Epping's wood-pasture landscape. Old pollarded trees can develop hollows and decaying wood, which provide habitat for fungi, insects and other organisms. Leaving some deadwood can support ecological processes, although managers also consider visitor safety near paths.
This example shows that a human practice may create a distinctive habitat structure. “Natural” and “human-shaped” are not always opposites. Long-term use, grazing and tree management have influenced the landscape, and present-day conservation decisions must account for this history.
Monitoring evidence and limits
The City of London reports that a systematic ecological monitoring programme began in 2025 and surveyed more than 1,000 hectares of open habitat across over 40 forest locations. Its published 2025 results include mapped rare-plant patches and records of butterflies, moths and reptiles. These are observations collected through a monitoring programme, not a complete count of every organism in every habitat. Methods and survey coverage affect what is detected.
In 2026 the City reports that pond monitoring is under way. Current records can help managers compare sites, identify habitat needs and plan protection, but the programme is developing over time. A single survey total cannot show a population trend unless it is compared with compatible records from other dates.
People, services and management
Epping Forest supports walking, cycling, education and enjoyment as well as habitats and wildlife. Visitors gain cultural and health benefits; wildlife depends on suitable habitat and connections; managers must consider access, safety and conservation together. Paths can concentrate pressure, while keeping some areas quiet or redirecting visitors may protect sensitive habitat.
The City of London also describes natural flood-management projects such as leaky barriers on streams and ditches. Holding water in the landscape can support habitat and may slow some runoff, but effects depend on location, design and rainfall. This connects the local ecosystem to the water cycle and to people living downstream. It should not be described as a guaranteed solution to every flood.
Using Epping as evidence
Use the forest to explain a process rather than recite a list:
- Habitat mosaic: different vegetation structures provide different conditions and niches.
- Wood pasture: pollarding and grazing shaped a landscape that now supports species associated with old trees and open habitat.
- Deadwood: decomposition returns material to soil while providing living space for specialist organisms.
- Wetlands: ponds and streams connect aquatic and land habitats and can store water.
- People: recreation and conservation share space and sometimes require management choices.
- Evidence: surveys can reveal patterns, but sample coverage, seasons and detection methods limit conclusions.
Epping is not a model for every British woodland. Local geology, soil, weather, history, species and land use differ. It is a named example to practise linking physical conditions, organisms and people.
Maps, data and evidence: 11. Mapping and investigating ecosystems
Biome maps
Read the title, legend, scale and source before interpreting a biome map. Identify the categories and whether the map shows potential natural vegetation, current land cover or a climate-based biome classification. Human land use has transformed many places, so a map of biome zones does not necessarily show intact natural habitat.
Compare locations using latitude, altitude, distance from the sea, ocean currents and relief. If two sites in the same biome differ, consider seasonal rainfall, soil, fire, grazing or land use. If two sites at the same latitude differ, consider coast, mountains and prevailing winds.
Climate graphs
A climate graph usually shows monthly precipitation and mean temperature. First identify units and axes. Then describe annual patterns: warmest and coolest months, wettest and driest months, and size of seasonal range. Link the pattern cautiously to a biome. A graph gives climate data for the station and time period shown; it does not prove which plants grow at every point around it.
Food-web diagrams
In a food web, arrows point from the resource to the consumer. Use the key to distinguish producers, consumers and decomposers. A simple web can show a pathway; a more connected web can show alternative foods and possible indirect links.
Do not infer that every species eats another species just because their symbols appear close together. Follow the arrows and question wording. If a web shows that a bird eats caterpillars and seeds, a decline in caterpillars may affect it differently from a species that relies only on caterpillars.
Quadrat sampling
A quadrat samples a small area. Place it randomly or systematically, depending on the investigation question. Identify the species or ground-cover categories using the same method at every sample. Record the number of individuals, percentage cover or frequency, and note the date and site conditions.
A single quadrat is rarely representative of an entire habitat. Use several samples, compare similar areas and report the method. If plants grow in clumps, a systematic transect may reveal changes better than a few random squares.
Transects and environmental gradients
A transect records change along a line, such as from a path edge into woodland or from a pond margin toward drier ground. At set distances, use quadrats or other observations to record plant cover, moisture, shade or soil condition. The line should cross the gradient relevant to the question.
A pattern along a transect is an association, not automatic proof of cause. If plant cover changes where shade decreases, light may be one explanation, but soil, trampling or moisture may also change at that point. Record several variables and consider alternative explanations.
Sampling animals responsibly
Mobile animals are difficult to count. Point counts, camera traps, tracks, timed searches or invertebrate sampling may be suitable with expert guidance and permissions. Methods must avoid harm and respect protected areas. The same effort and timing should be used in comparisons.
Observation conditions affect detectability. Birds call more at some times; amphibians may be more active after rain; insects vary by season. A zero count can mean none were detected in that sample, not necessarily that the species is absent from the whole habitat.
Ethical and fair fieldwork
Before fieldwork, agree permissions, safety boundaries, weather plans and a code of care. Avoid trampling plants, disturbing nests or removing organisms without approval. Return stones and logs carefully if they are moved under a supervised activity. Do not publish precise locations of vulnerable species if doing so could expose them to harm.
Include people as well as nature in an enquiry. Ask how a path, pond or woodland is used, what groups value about it and whether access is safe and inclusive. An ecosystem decision may affect local residents, visitors, land managers, farmers and future users differently.
Common misconception
An ecosystem is just a list of species. It also includes physical conditions, processes, flows and interactions.
Every ecosystem is a closed container. Ecosystems exchange water, energy, nutrients, organisms and materials with surrounding places.
A food chain shows every feeding relationship. It shows one simplified path; food webs link many paths.
Energy cycles like nutrients. Energy flows through a system and is eventually transferred to the surroundings as heat; matter and nutrients can be recycled.
Decomposers create energy. They break down organic matter and release nutrients; most food-web energy ultimately comes from sunlight.
One species disappearing has a simple one-step effect. Effects can pass through several links and vary with alternative foods, competitors and habitat.
A biome map predicts the exact species at a site. It shows broad patterns. Local climate, soil, disturbance and land use create variation.
More species automatically means no risk. Biodiversity can support ecosystem function, but resilience depends on species, connections, pressures and system condition.
All disturbance is harmful. Some ecosystems are shaped by occasional fire, flood or grazing. The effect depends on frequency, intensity and context.
A tree-planting project always improves nature. Planting in the wrong place can damage open habitats or affect water. Location, species and management matter.
One field survey proves a long-term trend. It shows evidence from a specific sample, date, method and area. Trends require comparable observations over time.
Ecosystem services are only money. They include material products, regulation, habitat processes, recreation, learning and cultural meaning.
Self-check
Answer from memory first. For longer questions, connect components and trace a process.
- What is an ecosystem?
- How is a habitat different from an ecosystem?
- Name two biotic and two abiotic components in a woodland.
- What is the difference between a population and a community?
- What does biodiversity include?
- Why is an ecosystem an open system?
- What is a limiting factor?
- What is a producer?
- How does a food web differ from a food chain?
- Which way should arrows point in a food-chain diagram?
- What happens to energy as it passes between trophic levels?
- How do decomposers contribute to nutrient cycling?
- How is energy flow different from nutrient cycling?
- How could drought affect a woodland food web?
- What is a biome, and why are its boundaries simplified?
- Name two factors besides latitude that can affect biome patterns.
- How might a climate graph help explain vegetation?
- Why can two places in the same biome still differ?
- What is a soil nutrient store?
- How can woodland soil and leaf litter affect water movement?
- What does a nutrient pathway help explain about ecosystems?
- What are ecosystem services?
- Give one example each of a provisioning, regulating and cultural service.
- How can woodland pollarding influence habitat structure?
- Why do survey totals not necessarily give a population trend?
- What does a quadrat measure?
- When might a transect be useful?
- Give one reason a species might not be detected during a survey.
- What is habitat fragmentation?
- Why should a management decision consider who gains and who bears costs?
Suggested responses
- A community of organisms interacting with one another and with their physical environment.
- A habitat is the place and conditions where an organism lives; an ecosystem includes interactions among organisms and the physical setting.
- Biotic: oak tree and fungus. Abiotic: soil moisture and light.
- A population contains members of one species in an area; a community includes populations of different species.
- Variety among genes, species and habitats, depending on the measure and scale used.
- It exchanges energy, water, nutrients, organisms and materials with its surroundings.
- A factor such as water, light or nutrients that restricts growth or distribution.
- An organism that makes organic material, usually by photosynthesis.
- A food chain shows one feeding pathway; a web connects many pathways.
- From the organism or resource being eaten toward the organism receiving the energy and matter.
- Some energy becomes biomass for the next level, while much is used in life processes or transferred as heat.
- They break down dead material and waste, making nutrients available in soil or water.
- Energy flows through and leaves as heat; nutrients and matter can be recycled through living and non-living stores.
- Lower soil moisture could reduce seedlings or pond water, affect food and shelter, and then influence consumers; the effects depend on species and site.
- A broad region associated with characteristic climate and vegetation; boundaries are transitions and maps simplify local variation.
- Altitude, ocean currents, relief, prevailing winds, soil, disturbance or human land use.
- It shows temperature and rainfall seasonality that can be compared with the broad growing conditions of a biome.
- Local soils, slope, water, disturbance, species and human use differ.
- Nutrients held in soil particles, organic matter or soil water that plants can potentially use.
- Roots and porous soil can support infiltration; leaf litter can slow runoff and decompose to add organic matter.
- It shows how nutrients move through plants, litter, decomposers and soil, and how a change to one store can affect others.
- Benefits people obtain from ecosystem processes.
- Provisioning: timber. Regulating: some water filtration. Cultural: recreation or learning.
- Pollarding creates old-tree forms, hollows and decaying wood that can provide habitat for specialist species.
- Surveys sample particular places and times and may use changing methods or detect species differently.
- It samples organisms or ground cover within a defined square area.
- To study change along a line, such as from a shaded path edge to an open glade.
- The species may be seasonal, mobile, hidden, inactive or missed by the method.
- The division of a larger habitat into smaller patches that may be harder for organisms to cross.
- Different groups may receive different benefits or experience restricted access, costs, habitat change or loss of livelihood.
Practice tasks
Task A: Trace an ecosystem interaction
A hot, dry period reduces water in a woodland pond. Describe two possible effects and identify one piece of evidence needed to test your explanation.
Model response: Lower water may reduce shallow habitat for aquatic plants and amphibians, while exposed pond margins may become warmer and less suitable for some organisms. A water-depth record combined with repeated plant or amphibian surveys could test the relationship. Other factors, such as shade, rainfall, groundwater and pollution, should also be considered.
Task B: Compare a food chain with a food web
A diagram shows oak leaves, caterpillars, mice, blue tits, spiders, owls, fungi and bacteria. Explain why the web gives more information than a single chain.
Model response: A single chain might show oak leaves eaten by a caterpillar, then the caterpillar eaten by a blue tit. A web can show that mice also eat seeds, blue tits feed on more than one prey, owls use several prey species, and fungi and bacteria break down dead material. It shows alternative pathways and possible indirect effects if one population changes.
Task C: Interpret biome evidence
A climate graph shows high temperatures through the year and rainfall concentrated in one wet season with a long dry season. Suggest a broad biome and explain why the graph alone is not enough.
Model response: A tropical grassland or savanna may be plausible because warm conditions and seasonal rainfall can support grasses with scattered trees. However, rainfall totals, soil, fire, grazing, altitude and land use also matter. A graph from one station cannot describe every site or identify its species.
Task D: Plan a transect
Your class wants to investigate whether ground plants change from a woodland path into a shaded interior. Outline a suitable method and one limitation.
Model response: Set a transect line from the path edge into the woodland, place quadrats at fixed intervals and record species or percentage cover using the same method in every square. Also record light, soil moisture and evidence of trampling. A limitation is that one line may not represent the whole woodland, so repeat transects in comparable places and record date and weather.
Task E: Evaluate a local management choice
A woodland manager wants to close part of a path to protect a sensitive habitat and improve nearby access with a new route. Give a balanced recommendation.
Model response: Closing the path may reduce trampling or disturbance in a sensitive area. A new route could maintain public access, but it may disturb a different habitat, require construction or make access harder for some users. The manager should map habitats and current use, consult visitors and local groups, consider accessible route design, and monitor both the closed area and alternative route after the change.
Revision points
- Define the ecosystem boundary and scale before describing its components.
- Separate biotic factors, abiotic conditions and interactions.
- Explain producers, consumers, decomposers and food webs with correctly directed arrows.
- State that energy flows while nutrients and matter cycle.
- Link climate, soil, water, relief and disturbance to organism distributions.
- Treat biome maps as broad patterns with transition zones and local variation.
- Use climate graphs, maps and field samples with their dates, scales and limitations.
- Trace direct and indirect effects through a food web rather than claiming certainty.
- Describe Epping Forest as a human-shaped habitat mosaic with evidence and monitoring limits.
- Compare ecosystem services and management choices by place, beneficiaries, trade-offs and timescale.
Curriculum alignment
- Curriculum coverage IDs: ks3.physical.ecosystems-biomes, ks3.human-physical-interaction, ks3.human.natural-resources
- Related practice packs: ks3_geography_ecosystems
- Shared concept tags: ecosystems, biomes, biodiversity, interdependence
Sources
- Curriculum: Department for Education: England Geography programme of study
- Food webs and organism interactions for KS3: Natural History Museum: Food web of life
- Energy flow and biome definitions: OpenStax Concepts of Biology: Energy flow through ecosystems
- Broad terrestrial biome patterns: OpenStax Biology 2e: Terrestrial biomes
- UK woodland biodiversity and habitat: GOV.UK: Benefits of woodland creation for nature
- Ecosystem pressures and working with nature: Environment Agency: Working with nature
- Epping Forest habitat mosaic and monitoring: City of London: Epping Forest wildlife
- Epping Forest climate action and leaky dams: City of London: Using open spaces to remove carbon
- Woodland management evidence: Forest Research: Woodland management for biodiversity and environmental benefits
- Current local species totals and project activity can change; use the latest monitoring report and check its survey coverage and methods.