 FoxChild@Learn
14. Economic activity, trade and natural resources
Curriculum status: Required core content.
This guide follows the England Key Stage 3 Geography programme of study. Schools choose their own sequence and detailed place exemplars; the coverage map in the curriculum framework shows how this guide fits the full programme.
Required knowledge
- Distinguish primary, secondary, tertiary and quaternary activities and explain how their balance changes over time and space.
- Describe trade links and the location of economic activity.
- Explain the distribution, use and management of energy, food, minerals and water resources.
Key vocabulary
| Term | Meaning |
|---|---|
| primary | extracting or producing raw materials |
| secondary | manufacturing or construction |
| tertiary | services |
| quaternary | knowledge and information services |
| resource | material or service people value and use |
| supply chain | linked stages from input to consumer |
| economic activity | work that produces, moves, sells or provides goods and services |
| employment structure | the distribution of workers between industries or sectors |
| primary sector | activities that obtain raw materials from land, water or living systems |
| secondary sector | activities that process materials, manufacture goods or construct buildings |
| tertiary sector | activities that provide services to people, businesses or governments |
| quaternary sector | knowledge-based work such as research, design, data and information services |
| informal employment | work that may lack some formal contracts, protections or registration |
| productivity | amount of output produced for a stated input of labour, land or capital |
| infrastructure | networks and facilities such as roads, ports, power grids and communications |
| global value chain | production and service stages distributed between places and organisations |
| import | good or service bought from a producer in another country |
| export | good or service sold to a buyer in another country |
| trade balance | difference between the value of exports and imports for a stated period and measure |
| resource security | reliable access to a resource at an acceptable cost and quality |
| renewable resource | resource replenished on a human timescale if use remains within renewal limits |
| non-renewable resource | resource formed over a timescale much longer than its rate of use |
| energy mix | proportions of different energy sources used in a defined system and period |
| energy security | ability to access reliable energy at affordable cost while managing risks |
| food security | reliable physical and economic access to sufficient, safe and nutritious food |
| water stress | pressure that occurs when demand and quality threaten available water supplies |
| circular economy | system designed to reduce waste by maintaining, reusing and recovering materials |
| externality | cost or benefit of an activity that affects others but may not appear in its market price |
How the geography works
Economic activity is linked through supply chains. Resource location, skills, capital, infrastructure, markets and policy influence where each stage occurs. As technology and wealth change, employment can shift between sectors, though old and new activities often coexist.
1. Economic activity and the four sectors
From raw material to service
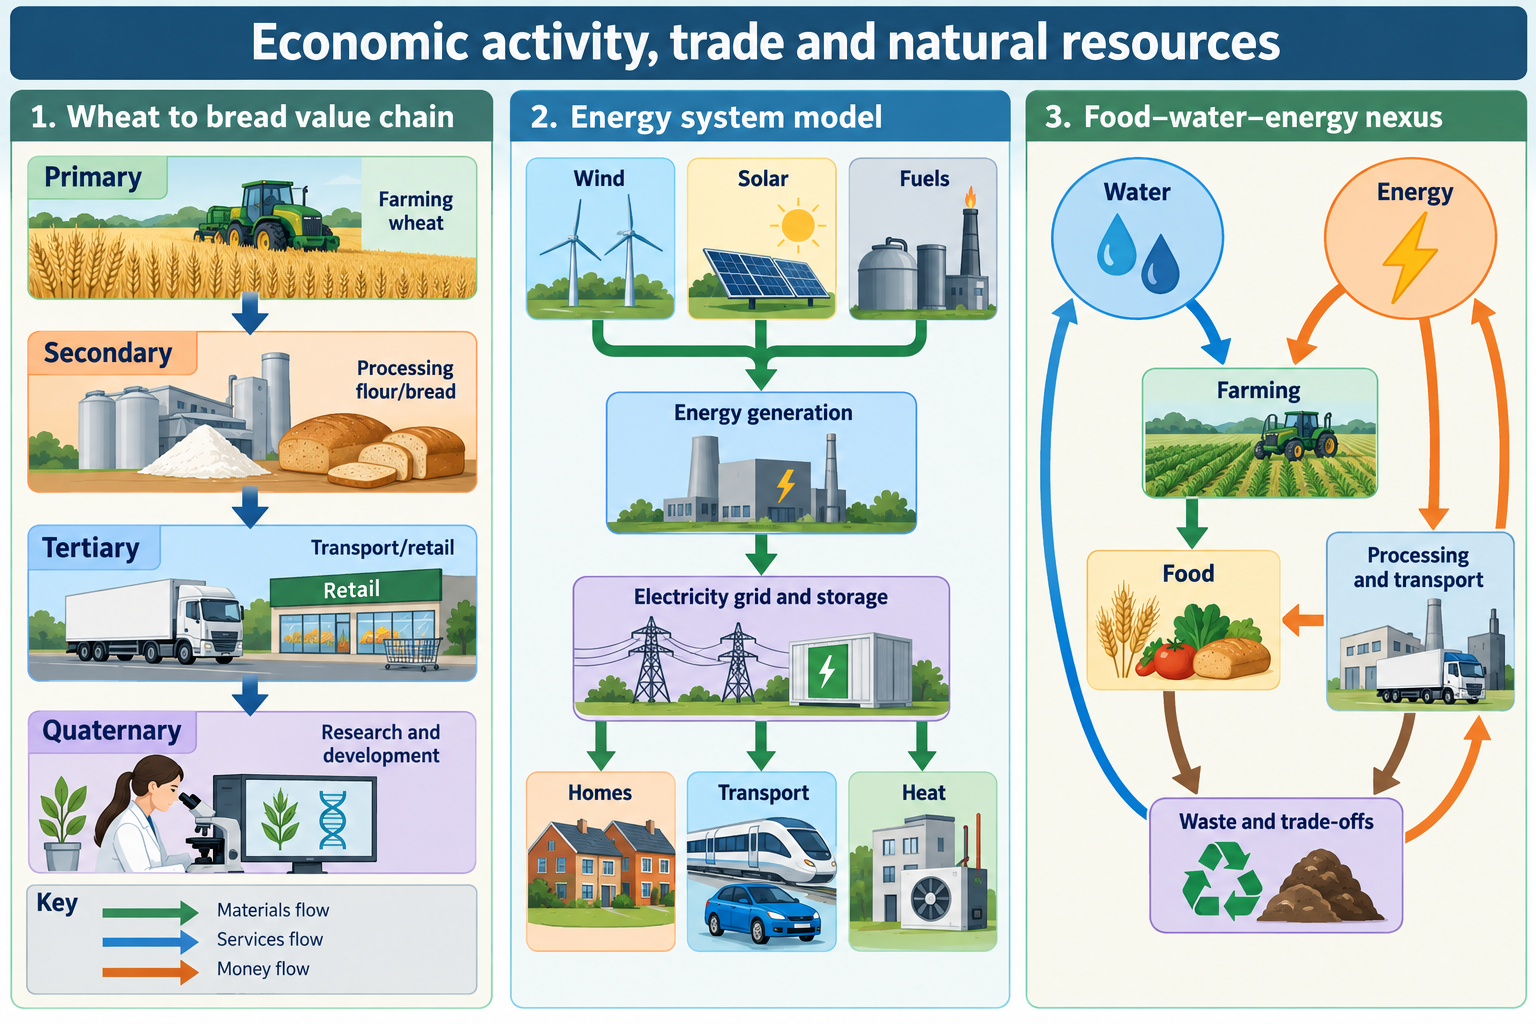
Economic activity includes making, moving, selling and maintaining goods and services. A product often passes through several stages before it reaches a user. A wheat crop is grown on a farm, harvested and stored, milled into flour, transported to a bakery, made into bread, delivered to a shop and sold. Farming is primary activity; milling and baking are secondary; transport, finance, wholesale and retail are tertiary. Research into seed varieties, grain data systems and food technology can be quaternary activity. The stages depend on one another.
The primary sector obtains raw materials from natural systems. It includes farming, fishing, forestry, mining and quarrying. A primary activity is not necessarily simple or low-technology: commercial farming can use satellite data, machinery, irrigation, scientific research and complex finance. It can be highly productive and require skilled workers. Environmental conditions and markets matter, but so do ownership, equipment, knowledge, land access, storage and routes to buyers.
The secondary sector processes materials and manufactures or constructs products. It includes food processing, steelmaking, electronics, building and energy transformation. Factories can benefit from access to materials, skilled workers, transport, reliable power, capital and customers. Production may be located near a resource, port, supplier cluster, city or market. Automation can change the number and type of workers needed without removing the factory's importance to a supply chain.
The tertiary sector provides services. Examples include retail, transport, education, health care, hospitality, finance, construction services, public administration and repair. Some services are sold directly to households; others support businesses or government. A service economy still depends on physical resources: shops require buildings and deliveries, data centres use land and electricity, and tourism relies on water, transport and ecosystems.
The quaternary sector uses specialised knowledge and information. Research, software, engineering design, environmental analysis, data services and scientific development are examples. It overlaps with other sectors: a farm may employ agronomists; a factory may run a design laboratory; a hospital may use medical research and data analysis. Sector categories classify the main activity, but real workplaces can combine several.
Measuring an employment structure
An employment-structure diagram shows how workers are distributed among sectors for a particular place and date. A pie chart may show shares of workers; a bar chart can compare values between places or years; a map can show regional variation. Read the legend, category definitions and year. A sector's share of workers is not the same as its share of output, exports or profit. One highly automated industry can produce substantial output while employing fewer workers than a large service sector.
Employment categories can hide differences between full-time, part-time, seasonal, informal, paid and unpaid work. A dataset may classify a person's main job even when they hold several jobs or work in a family enterprise. A farm household's unpaid care and subsistence production may not appear in the same way as a formal wage job. Always state what the data count.
A shift in sector shares can happen because one sector grows, another shrinks or population changes. If a chart shows the primary sector falling from 40 to 20 per cent, this is a 20-percentage-point fall in its share, not necessarily a halving of the number of workers. If the total workforce grew, the number working in farming could rise even while its share fell. Use counts and percentages together when available.
How and why sector patterns change
As incomes, technology, infrastructure and demand change, employment can move between sectors. A country may mechanise agriculture, expand manufacturing, then develop more services and research. This is a broad model, not a fixed sequence. Primary, secondary, tertiary and quaternary activities can grow at the same time, and the history of each country or region affects the pattern. Resource booms, tourism, conflict, automation, financial crises and public policy can change sector demand quickly.
Automation can reduce the labour needed for a task while increasing demand for maintenance, programming, design and logistics. A factory might employ fewer assembly workers but rely on engineers, accountants and distribution staff. Outsourcing can shift a function to a different company or location; it changes where a job is counted, not necessarily whether the task exists. Digital platforms can make some services tradable across borders while other services need to be delivered in person.
Deindustrialisation describes a decline in manufacturing employment or output in a place. It may follow technological change, competition, resource depletion, investment decisions or changes in demand. It does not always mean that all industry disappears. A town can lose some factories but retain advanced manufacturing, transport, maintenance or design. A regional shift can leave vacant buildings and unemployment, while new sectors may require different skills and may not employ the same people or occupy the same location.
Economic restructuring creates uneven effects. Workers with transferable skills may move to new jobs; others may face retraining, lower pay, insecure contracts or long travel. Town centres can lose customers when a large employer closes; local suppliers and public budgets may also be affected. A new industry can create growth but not necessarily replace every lost role. An account of sector change should identify both the new activity and the people, buildings and services affected by decline.
2. Where economic activities locate
Locational factors work together
Businesses and public services choose locations for different reasons. Important factors include:
- Raw materials and natural conditions: mines, farmland, water, climate and suitable soils can influence extraction, production and processing.
- Workers and skills: employers need people with the required experience, training, health and availability.
- Markets and customers: a service may need proximity to users, while an export factory may connect to global buyers.
- Transport: roads, railways, ports, airports, pipelines and digital networks move workers, materials, information and goods.
- Energy, water and other inputs: reliability, quality and cost can matter as much as physical presence.
- Land and buildings: a location needs sufficient space, suitable structures and permissions, at an affordable cost.
- Suppliers and business networks: firms can benefit from being near specialist components, research, maintenance or finance.
- Policy and regulation: planning, tax, labour standards, environmental rules, grants and trade agreements influence costs and choices.
- Risk and resilience: firms consider hazards, political change, supply disruption, insurance and access to alternative routes.
The most important factor varies. A quarry must be near a suitable rock deposit because moving the raw material is costly. A high-street shop needs access to customers and may cluster with other shops. A software team may locate near skilled workers, a university or communications networks. A warehouse may seek a large site close to motorways and distribution routes. None can be explained by one universal locational rule.
Transport creates accessibility, not just proximity. A factory five kilometres from a motorway may have poor access if a river, congestion or a restricted junction creates a long journey. A port can reduce the cost of international trade, but only if inland roads and railways connect producers to it. Workers may live close to a business but face expensive or infrequent buses. Maps, journey times, timetables, freight records and field evidence can test a claim about access.
Clustering and agglomeration
Some businesses cluster because they share suppliers, a skilled labour pool, customers, research, services or infrastructure. A group of firms can gain from shared networks and the movement of ideas. A port, technology district or food-processing area may attract companies that use each other's services. This concentration is sometimes called an agglomeration benefit.
Clustering can also increase land prices, congestion, water demand, pollution and competition for workers. If an area depends on one industry, a downturn can affect many linked employers at once. A new business district may bring investment but raise rents or displace smaller firms. The same concentration that improves connections can create shared risk. A resilient area often has transport alternatives, worker skills that transfer and a varied economic base.
Rural and urban economic links
Rural places supply food, timber, minerals, water, energy, landscape and recreation. They also contain manufacturers, technology firms, logistics, tourism and public services. Urban places provide large markets, finance, universities, specialist health care, administration and cultural services. These descriptions are broad: neither rural nor urban economies are limited to one set of jobs.
Goods, workers, visitors, investment, data and waste move between settlements. A farm may sell into a city through a processor and wholesaler; workers may commute from a town to an industrial estate; city residents may visit a national park; electricity may move from a rural wind farm through a grid to homes and factories. Describe direction, route, scale and effect. A flow map should distinguish the amount or frequency if it uses line width or symbol size.
Economic connections can benefit different places unevenly. A tourist town may have high seasonal employment but low year-round wages. A farm's products may be processed and branded in a city, where more value is added. A rural energy project may produce national electricity while local residents debate landscape change and community benefit. Ask who owns the activity, who supplies labour, who receives income and what costs remain local.
3. Trade and supply chains
Imports, exports and the geography of a product
Trade connects producers and consumers across space. An import is bought from another country; an export is sold to a buyer elsewhere. A country can import and export similar products because products differ in season, quality, cost, timing, brand or processing. Trade depends on production, demand, currency, prices, standards, transport, contracts and political agreements.
Follow an item from input to user. A phone may use mined minerals from several regions, components manufactured in different countries, software designed in another city, assembly near an international port, global shipping, a distribution centre, retail and later repair or recycling. Production geography does not fit on one country-of-origin label. Map the locations for a specific product, identify what moves between them and ask which stages add value or create environmental costs.
Supply chains include farms and mines, processors, manufacturers, storage, transport, wholesalers, retailers and service or repair businesses. Inputs can include fuel, fertiliser, packaging, water, finance, data and labour as well as raw materials. A delay in one stage can affect others: a port closure may hold components, a power cut can stop refrigeration, and a shortage of fertiliser can affect next season's harvest.
Comparative advantage and the limits of specialisation
Countries and regions may specialise in activities for which they have an advantage in skills, resources, technology, location or opportunity cost. Specialisation can increase output and allow a producer to access a larger market. However, the benefits depend on prices, wages, ownership, productivity, working conditions, tax, regulation and environmental effects. If a place specialises in one crop or mineral, a disease, drought, price fall or new technology can quickly reduce income.
Diversification spreads some risk across products, sectors or trading partners. It may help a household combine crops, a region develop services alongside industry, or a country expand processing and manufacturing. Diversifying takes investment, training, market research, reliable infrastructure and time. It can also introduce new risks. Growing a cash crop for export may increase farm income while reducing land for local food; opening a mine may add export revenue while placing water users under pressure.
Trade statistics require care. A trade-balance figure compares exports and imports under a stated definition and period; it does not show whether trade improved wellbeing. Export value can rise because prices increase even if the quantity sold falls. A port flow map may show volume without revealing the cost of transport or who owns the cargo. Add context and avoid equating a higher export total with a fairer distribution of income.
Global production networks and value capture
In a global value chain, design, materials, components, finance, assembly, marketing and sales may occur in different countries. A company may organise these stages through subsidiaries, suppliers and logistics firms. The location that assembles a product may receive wages and local purchases, while patents, finance, branding and profits are controlled elsewhere. More local supplier links, skills, services and processing can increase domestic value capture, but require capacity and investment.
The chain can make production efficient and products more available. It can also make a business dependent on a limited supplier or shipping route. A factory may lose orders if a buyer changes its contract; a farming region can be affected by a distant price shock; workers may have limited influence over the terms set by a large buyer. Contract length, labour standards, supplier diversity, emergency stocks and social protection alter the distribution of risk.
Companies choose sites by comparing costs and access, but a simple “low wages attract firms” explanation is incomplete. Workers need skills, ports and roads must be reliable, power must be available, suppliers need to meet standards and political rules need to be predictable. Some firms locate near their customers to offer fast service; others locate near research or specialist workers. A good answer names the activity and explains which location factors matter to it.
4. Natural resources, access and management
What makes something a resource?
A resource is something people value and use. It can be a material, a flow of energy, a service from an ecosystem or a human capability. Whether a feature becomes a resource depends on knowledge, technology, demand, ownership, access, cost and social choices. A mineral deposit may be known but not economical to extract; a river may supply water and habitats but be protected from some forms of use; sunlight is widespread but generating electricity requires equipment, land and a grid.
Resources can be classified by how they are replenished. Renewable resources such as sunlight and wind are renewed continuously, but equipment, grid capacity and suitable locations are limited. A forest or fish stock can renew if rates of use do not exceed regeneration and ecosystems remain healthy; overuse can make a nominally renewable resource scarce. Non-renewable resources such as coal, oil, gas and many minerals form over geological time and are depleted as they are extracted. Recycling can recover some materials but requires collection, sorting, energy and quality control.
Resource availability is not the same as resource access. A region can contain water while households lack a pipe or cannot afford a connection. A country can produce electricity while remote communities experience unreliable supply. Food may be present in shops while low incomes prevent some people from buying enough. Analyse where the resource is, who owns or controls it, how it is processed and moved, who pays and who benefits.
Resource security concerns whether users can obtain a reliable supply at an acceptable price and quality. Security can be affected by physical scarcity, climate, infrastructure, trade routes, conflict, market concentration, pollution, seasonal demand, maintenance or unequal purchasing power. A system may be secure for industry and insecure for some households, or secure in an average year but vulnerable to drought or a port closure. Define whose security and what time period you mean.
5. Energy: sources, systems and choices
Energy sources and energy carriers
An energy source provides usable energy. Coal, oil and natural gas are fossil fuels formed from ancient organic material; burning them releases carbon dioxide and other pollutants. Nuclear power uses energy released from atomic nuclei and produces electricity without direct carbon dioxide emissions during generation, but creates radioactive waste and needs secure fuel supply, specialist facilities and long-term management. Wind, solar, hydroelectricity, tidal and geothermal sources use renewable flows or processes; biomass uses organic material and is renewable only when regrowth and land effects are managed.
Electricity is an energy carrier, not a primary source. It can be generated from different sources and transmitted through a grid. Petrol and natural gas are fuels that can be used directly; hydrogen can store or transport energy after production, but its climate effect depends on how it is made. Keep the source, conversion and end use distinct. A solar panel generates electricity; an electric vehicle uses electricity stored in a battery; charging demand depends on the grid and time of day.
Energy supply also depends on infrastructure. Oil and gas use wells, pipelines, terminals, storage, refineries or import facilities. Wind and solar need generating equipment, grid connections, balancing and sometimes storage or flexible demand. A hydroelectric station needs suitable water and terrain, a dam or flow infrastructure and environmental planning. A system is not reliable simply because a source exists; the route from source to user needs maintenance and capacity.
Comparing energy choices fairly
No source is impact-free. Compare energy technologies using a consistent set of questions: where is the source, how predictable is it, how much energy does it produce over time, what infrastructure is required, what is the cost to build and operate, what emissions occur over the full life cycle, how much land and water are used, what materials are needed, who receives jobs or income, and what environmental or community effects may occur?
Wind and solar output vary with weather and daylight. They can reduce fuel imports and operational emissions, but need suitable sites, transmission, balancing, storage or other flexible supply. Hydroelectricity can produce controllable power and store water, but dams alter river flow, habitats and sediment movement and may displace communities. Tidal energy uses predictable cycles but needs particular coastal conditions and can affect marine environments. Geothermal energy can provide steady heat or power in suitable geological settings, though exploration and drilling can be expensive.
Fossil fuels can provide dispatchable energy and have established infrastructure, but fuel prices and geopolitical events affect supply and cost. Burning them adds greenhouse gases and air pollution. Carbon capture aims to prevent some emissions from reaching the atmosphere, but requires energy, transport and permanent storage; it should be assessed using measured performance and full-system costs rather than treated as automatic zero-carbon energy. Nuclear power can provide firm low-carbon electricity, but construction time, finance, waste, water use, safety and decommissioning matter.
Energy security includes reliability, affordability, diversity, infrastructure resilience and environmental sustainability. Importing energy can expose users to exchange rates or supply disruption, while domestic production can affect landscapes and communities. Relying on a single fuel, route, generator or technology may create a single point of failure. A diverse system with interconnection, storage, flexible demand, maintenance and emergency planning may be more resilient, though building it costs money and has its own impacts.
The UK energy example: read the year and denominator
The Department for Energy Security and Net Zero's Digest of UK Energy Statistics (DUKES) is an annual official source for energy production and consumption. The 2026 edition was published in July 2026 and contains 2025 data. Provisional government greenhouse-gas statistics report that nuclear and renewables together accounted for 65 per cent of the fuel used for UK electricity generation in 2025. This is a share of electricity generation, not a share of all energy used for transport, heating, industry and other purposes. The same release explains that the long-term fall in power-sector emissions reflects fuel changes, renewables and efficiency. Always keep the denominator and reporting year with the percentage. DESNZ: DUKES 2026; DESNZ: provisional UK greenhouse-gas emissions, 2025
The UK also imports and exports electricity through interconnectors, produces oil and gas, and uses energy for heat, transport and industry. A percentage about electricity says little about these other energy uses. Compare separate datasets for electricity generation, total energy demand, imports, fuel use and emissions. Distinguish capacity, the maximum output possible under stated conditions, from generation, the energy actually produced over a period. Installed wind capacity may rise while generation changes with wind speeds and maintenance.
Energy geography involves locating supply and demand. Offshore wind sites may have strong wind resources and access to ports, but require undersea cables and grid connections onshore. Solar farms need land and connection capacity; rooftop panels use built surfaces but vary with orientation, shading and ownership. Electricity demand is concentrated near homes, transport networks and industry, while some generating sites are distant. New transmission can carry power across regions but changes landscapes and requires planning.
Energy transition and the just transition
An energy transition changes the sources, infrastructure, skills, costs and organisations that provide energy. It includes more than replacing a power station. Homes may need insulation and heat pumps; transport may electrify; industries may need cleaner process heat; grids may need storage and new connections. Progress in one area can be slowed if another part is missing. A wind farm without transmission may be constrained; an electric vehicle without charging access may not suit every household.
Workers and communities can face gains and losses as old industries decline and new ones develop. An offshore wind project may bring engineering, port, maintenance and manufacturing jobs, but not every role will go to local workers without training and supply-chain plans. A fossil-fuel community may depend on wages, local taxes, supply firms and cultural identity linked to an industry. A just transition recognises the need for secure work, retraining, community participation and support for places exposed to change.
Households also experience energy decisions through bills, warmth, transport and housing quality. Insulation can reduce energy demand and improve comfort; the benefit depends on upfront finance, building condition, landlord decisions and installation quality. A tariff may lower costs for some users but be hard to access for others. Measure energy poverty or affordability using stated definitions; do not assume that a household's income alone explains its energy use.
6. Food: production, trade and security
A food system from farm to table
A food system connects land, water, climate, seeds, livestock, workers, machinery, fertiliser, veterinary care, processing, packaging, refrigeration, transport, shops, kitchens, waste and public health. A crop may be harvested in one region, processed in another, packed abroad and sold through a national retailer. A meal's ingredients can link several countries and seasons. Map a food chain from origin to consumer and label both physical movement and information or money flows.
Food security is broader than the amount of food produced. The 2025 UK Food Security Digest uses the World Food Summit definition: people need reliable physical and economic access to sufficient, safe and nutritious food that meets dietary needs and preferences. At a household scale, affordability and safe access matter. At a national scale, domestic production, imports, transport and resilience matter. At a global scale, climate, conflict, trade and food availability matter. A country can have sufficient food in aggregate while some households cannot afford a nutritious diet.
Food availability is affected by growing conditions, soil, water, pests and disease, technology, storage, trade and transport. Food access is affected by income, prices, distance, mobility, social support and market availability. Utilisation concerns whether food is safe, nutritious and suitable, while stability concerns whether access continues through seasons and shocks. Use these dimensions to explain why production volume alone is not a complete food-security measure.
UK food supply: a dated, broad comparison
The 2024 UK Food Security Report reported that in 2023 domestic production supplied about 62 per cent of all food and 75 per cent of foods that can be produced commercially in the UK. The report also notes that a production-to-supply ratio is not a single measure of food security. The UK imports products that do not suit its climate, and trade can provide flexibility when a domestic harvest or overseas supplier is disrupted. The figure compares farm-gate production value with the value of raw food consumed and excludes some components of production and consumption; read its method before using it as a measure of “self-sufficiency.” Defra: UK Food Security Report 2024, food supply sources
Production differs by product group and season. The report found higher domestic production-to-supply ratios for cereals and livestock than for fruit and vegetables; climate suitability, consumer demand, seasonality and producer choices help explain variation. These figures are dated 2023 and should not be described as current without checking a later release. A national ratio can conceal regional differences, household affordability, food waste and reliance on imported farm inputs such as fuel, animal feed, machinery and fertiliser.
Trade can improve resilience by letting a country source food from diverse places. It can also transmit shocks. A crop failure, drought, port closure, disease outbreak, cyberattack, fuel-price rise or conflict can affect production or movement. A 2025 Defra digest describes the 2025 disruption at Holyhead and reports that the port usually handles 5–10 per cent of annual UK meat and dairy imports. It also records how weather, disease, shipping delays and food-price changes interacted in 2025. These examples show that supply chains include ports, processing, retail systems, labour, energy and digital networks, not only farms. Defra: UK Food Security Digest 2025
Farming choices and environmental trade-offs
Farming systems vary with climate, soil, relief, land ownership, technology, finance, labour, market access and public rules. Arable farms grow crops; pastoral systems raise livestock; mixed farms combine crops and animals. Intensive systems use more inputs per area or animal, often to raise output, while extensive systems use larger areas with lower inputs per unit of land. These are broad contrasts and actual farms can combine methods.
Fertiliser can supply nutrients and increase yields, but runoff can pollute rivers and excess nitrogen can damage air and climate. Irrigation can stabilise crops in dry periods but may compete with cities, ecosystems or downstream users. Pesticides can reduce crop loss but affect non-target organisms if used poorly. Soil conservation, crop rotation, cover crops, precision application, agroforestry and integrated pest management may reduce pressure, but require knowledge, investment and locally suitable methods.
Food production also affects land. Expansion into forests, wetlands or grasslands can increase short-term output while reducing habitat, carbon storage, flood regulation and soil protection. Urban growth can remove productive land near cities. Food waste occurs on farms, in storage, processing, retail and households; reducing it may improve availability without expanding farmland, though causes and remedies differ along the chain. A sustainable food strategy considers yield, nutrition, affordability, farm incomes, soil, water, biodiversity, emissions and waste together.
7. Water, minerals and material resources
Water as a resource for people and ecosystems
Water supports homes, health, agriculture, industry, energy, transport, habitats and recreation. Availability varies by season, rainfall, geology, storage and demand. A region may receive substantial annual rainfall yet experience summer shortages if rain falls in winter, reservoirs are small or population demand is concentrated. Groundwater aquifers, rivers, reservoirs, desalination, transfers and reuse each have different locations, costs, energy needs and environmental effects.
Water security includes quantity, quality, timing, access and affordability. Pollution can make water physically present but unsuitable; leaks can reduce usable supply; drought can lower river flow and reservoir storage; floods can damage infrastructure and contaminate supplies. Households, farms, energy systems and ecosystems may compete for the same water. Management can combine metering, fixing leaks, water-efficient appliances, storage, catchment restoration, irrigation scheduling, industrial reuse and pollution control.
Water has strong links to economic activity. Food production uses water directly for irrigation and indirectly through animal feed, processing and energy. Power stations may use water for cooling; water-treatment plants use electricity; mines need water for processing and dust control. These links mean a drought or energy disruption can spread between sectors. A water footprint estimates water used in a product chain under a chosen method, but it should not be confused with water taken from a single local river.
Minerals and the material economy
Minerals and rocks supply construction materials, metals, fertilisers, glass, ceramics and components used in vehicles, phones, electricity grids and renewable technologies. Extraction depends on geology, deposit size and quality, access, technology, price, infrastructure, environmental rules and consent. A deposit that is technically present is not automatically viable or approved for extraction.
Quarrying can provide stone, sand and gravel for buildings and roads, along with jobs, taxes and local contracts. It can also create dust, noise, traffic, visual change, habitat loss and effects on water. Planning can require transport routes, limits on working hours, restoration plans and monitoring. Restored quarries may become wetlands, lakes, parks or habitats, but restoration takes time and cannot always reproduce the previous landscape.
Metals and critical materials can be geographically concentrated. Mining may create export income and employment while leaving surrounding communities with environmental risks or limited access to profits. Processing, refining and component manufacturing may occur in other countries, so a mine's output value is only one stage of the product chain. Reuse, longer product lifetimes, repair and recycling can reduce pressure on new extraction, but they cannot eliminate the need for new materials as populations and infrastructure change.
Water-energy-food and material connections
Resources interact. Water is required to grow food, and energy is used to pump and treat water. Energy is needed for farm machinery, fertiliser, cold storage and transport. Food waste also wastes land, water, labour and energy embodied in the product. A new reservoir might improve drought resilience while changing habitats and displacing land uses. A biofuel crop could provide energy but compete with food, water and land. A solar farm may reduce emissions while using land wanted for agriculture or nature.
When evaluating a proposal, draw a simple system diagram: identify the inputs, users, waste streams, affected ecosystems and people. Add flows between food, water, energy, transport and materials. Ask where demand occurs, what the source can supply, how resilient the route is and who has decision-making power. A systems view helps reveal trade-offs that a single-sector chart might miss.
Sustainable management
Resource management balances demand, supply, access, environmental limits and future needs. Demand-side actions reduce or change use through efficiency, repair, public transport, insulation, lower food waste or altered irrigation. Supply-side actions develop or protect sources through reservoirs, renewable generation, recycling, storage, restoration or new infrastructure. Each action creates trade-offs and needs fair planning.
Efficiency can provide more service for each unit of input, but lower cost can encourage extra use. A more efficient car may use less fuel per kilometre, but people may drive farther. This is a rebound effect. Efficiency therefore works alongside behaviour, design, public transport, pricing and planning. A resource strategy should explain whether it lowers total pressure or only the amount used per task.
Recycling and a circular economy aim to reduce demand for new materials by designing products to last, repair, reuse or recover their components. Reuse usually avoids some processing needed to create a new item, but collection and transport still use resources. Some materials lose quality after repeated recycling; composites are hard to separate; and recovered supply may not meet industry demand. Reducing unnecessary use, designing for repair and improving material recovery can work together.
The costs of using a resource can be externalities: impacts on people or ecosystems that do not appear in the market price. Air pollution, habitat loss, noise, traffic, water contamination and greenhouse-gas emissions may be borne by people who do not receive the product's income. Environmental rules, monitoring, public participation, remediation and compensation can help account for such effects, but need to be enforced and reviewed.
Place example
The UK offers linked examples of resource production, energy transition, farming and international trade. They show how a high-income country can still depend on imports, face uneven access and make difficult choices about land and infrastructure. Use the examples as a dated evidence base, then check the latest official statistics before quoting a current figure.
UK energy: North Sea resources and changing generation
Oil and natural gas beneath the North Sea have supported extraction, engineering, shipping, processing and specialist services. Ports, offshore platforms, pipelines and onshore terminals connect seabed resources with refineries, power stations, homes and industry. This activity has created skilled work and supplied fuels, but it is a finite resource and its use releases greenhouse gases. As production changes and fields mature, companies, workers, suppliers and port towns face questions about employment, investment and future land or infrastructure use.
The energy system is now changing as wind, solar and other low-carbon sources expand alongside nuclear power, gas and electricity imports. DESNZ reports that nuclear and renewables accounted for 65 per cent of the fuel used for UK electricity generation in 2025. That does not mean 65 per cent of all UK energy use was low carbon: transport, heating and industrial fuels are included in total energy demand and change at different rates. It is also a national share, not a map of how much electricity a household receives from a nearby generator.
Offshore wind has strong potential in areas with suitable wind and seabed conditions. Turbines can be installed far from many homes, but their electricity must be carried to shore and connected to the grid. Ports need to handle large components; cables and substations take time to plan; maintenance vessels and skilled workers are required. Competing uses include shipping, fishing, conservation, defence and recreation. Local support can depend on consultation, visible impacts, jobs, ownership and community benefit.
The transition produces both new opportunities and difficult choices. Workers in oil and gas may have relevant skills in engineering, safety and marine operations, yet new jobs may require different training or be located elsewhere. An energy strategy can be assessed by comparing reliable supply, household cost, emissions, local jobs, worker transitions, grid capacity and environmental effects. Avoid saying that renewables solve every problem or that fossil fuels can be removed from every use at the same pace; identify the specific energy service and time period.
UK food: domestic production and import links
The UK food system links farms, fisheries, processors, warehouses, ports, supermarkets and households. Defra's 2024 report estimated that domestic production supplied 62 per cent of all food in 2023 and 75 per cent of food that is commercially producible in the UK. These are not shares of every food eaten by every household; tropical products and some ingredients cannot be grown commercially in the UK. A 2025 digest describes how multiple suppliers and trade routes help the system respond to some disruptions.
Domestic and imported supply each bring advantages and risks. UK farms can provide fresh seasonal food and support rural employment, while imports give access to products that do not grow locally and can spread risk between suppliers. Imports rely on shipping, ports, road and rail, refrigeration, labour and digital systems. Domestic production still uses imported energy, animal feed, machinery, fertiliser and packaging. Resilience depends on the whole chain rather than the location of the farm alone.
Food access is also a household issue. The 2025 Defra digest reports that food affordability remained a concern and that food-price inflation was above overall inflation for much of the year. It describes how higher energy or fertiliser costs can move through farm and processing costs into retail prices. A shop may have enough food while a household cannot afford a suitable diet. Economic access, physical distance, dietary needs, safety and waste therefore belong in a study of food security alongside harvest and import figures.
This example shows how a global supply chain can help maintain availability while transmitting price, weather, disease, shipping or cyber risks. Diverse suppliers and adaptable routes can improve resilience, but low-income households may still feel a price shock first. To assess a strategy, compare the source of food, the route to market, the security and affordability of supply, the use of water and energy, and who benefits from farm and retail income.
Comparing energy and food supply systems
| Geography question | UK energy system | UK food system |
|---|---|---|
| Main flows to map | fuels, electricity, grid connections, imported energy and emissions | crops, livestock, seafood, inputs, processing, imports and retail delivery |
| Location factors | source location, grid capacity, ports, land, technology and demand | soils, climate, water, labour, storage, roads, ports and customers |
| Resilience issue | fuel-price shocks, grid constraints, weather variability and equipment outages | harvest failure, disease, port disruption, energy/fertiliser prices and household affordability |
| Possible response | diverse generation, storage, interconnection, efficiency and grid investment | diverse suppliers, healthy soils, storage, reduced waste and affordable access |
| Evidence limitation | electricity generation share is not total energy use or household access | production-to-supply ratio is not a complete food-security measure |
The comparison helps explain why resource security is about systems. A resource may be available but hard to move; a country may have enough in total but unequal access; and a more secure supply can still create environmental costs. Use separate indicators for separate questions.
Maps, data and evidence
Use flow maps for trade and proportional symbols for production only with a clear legend. A sector chart shows employment or output only if the measure and date are labelled.
Selecting a map or chart
Start with a question. A choropleth can compare a rate, such as the share of workers employed in manufacturing, between regions. A proportional-symbol map can compare production totals, provided the symbol-size key is clear. A flow map can show the direction and scale of imports, workers or electricity. A line graph can show change over time; a stacked bar can compare the composition of an energy mix. Use consistent units, dates and boundaries.
For a sector chart, identify whether it shows employment, output, exports or businesses. The manufacturing share of jobs may fall while output rises because machinery increases productivity. A percentage can fall even as the total number grows; check both. For an energy chart, identify whether the denominator is electricity, final energy use or total primary energy supply. For food, distinguish production, supply, imports, consumption, calories and value.
Worked resource comparison
Suppose a class compares a wind-farm proposal with continued gas generation for a region. First state the scale and date of the generation data. Next compare expected annual output, reliability, grid needs, costs, emissions, land or seabed use, jobs and affected groups. Do not compare a renewable's installed capacity with a gas station's annual generation: one is a maximum power measure and the other is energy produced over time. Include a source for every number and record assumptions about future demand or storage.
Then make a supported conclusion. One option may have lower operating emissions but require a new grid line and variable output; another may be dispatchable but release greenhouse gases and depend on fuel prices. The best choice depends on the question, system mix, location and values of decision-makers. State which criteria carry most weight and what further evidence would change the decision.
Worked supply-chain reading: grain to a loaf
Imagine a flow map traces a loaf of bread from wheat grown in an inland farming area to a nearby mill, then to a bakery and a supermarket. A map can show where the stages happen, but students should add the flows that make the chain work: seed, fertiliser, fuel and machinery moving towards the farm; grain moving to storage and milling; flour moving to bakeries; bread travelling to shops; and money, data and packaging moving in other directions. The physical flow, service flow and payment flow overlap but are not the same.
Ask what could interrupt each link. Wet weather can delay harvest; poor storage can increase losses; an energy-price rise can increase machinery, milling or refrigeration costs; a road closure can delay deliveries; a labour shortage can limit processing. A single local disruption may be manageable if there are alternative routes or suppliers, but a chain with concentrated processing and limited storage may be less flexible. Do not claim that one interruption will cause a shortage without evidence about stocks, substitute routes and buyer responses.
A second map could add land use, roads, rail sidings, mills, ports and population. A chart might show the amount of wheat harvested or the share used domestically, but students must confirm units, crop year and whether imports or animal feed are included. A high farm output does not tell us how much bread is affordable or how much waste occurs after retail. To study those issues, household spending, price, nutrition and waste data would be needed.
How a supply shock travels through a supply chain
Consider a hypothetical drought in a major wheat-growing region. The first effect may be a smaller harvest, but the final effect depends on stocks, other suppliers, transport, contracts and the ability to substitute other grains. If milling is concentrated in a few facilities, a local outage can matter more than a shortfall spread across many farms. A map helps locate the source and processing nodes; a flow map shows routes; a time-series chart can reveal whether prices or deliveries changed after the event.
Price transmission is not instant or identical at every stage. Farmers may have sold crops under contracts; mills may hold stored grain; supermarkets may use several suppliers; households may change what they buy. A retail price also includes transport, processing, labour, energy, packaging, rent, tax and profit. It is therefore inaccurate to claim that a crop-price increase passes directly and equally to every consumer. Ask which part of the price changed, how quickly, and for whom.
Resilience is the ability of a system to prepare for, absorb and recover from disruption while maintaining important functions. Possible measures include storing supplies, using more than one supplier, maintaining alternative routes, reducing waste, improving forecasts and supporting local production. Each choice has costs: storage needs space and capital, extra routes may increase emissions, local production can be seasonal, and diversification can be difficult for small businesses. There is no single resilience solution that removes all risk.
This example also connects physical and human geography. Drought hazard depends on rainfall deficit and duration; exposure depends on where crops and infrastructure are located; vulnerability depends on incomes, insurance, irrigation, storage, market access and social support. Two farms in the same dry region may experience very different losses. When interpreting a supply-chain map, identify not just the hazard but the people and economic links that shape its consequences.
The chain can also be evaluated environmentally and socially. Farmers need a viable income and healthy soil; mill and bakery workers need safe, secure work; retailers need dependable deliveries; households need affordable food. Fertiliser runoff, fuel emissions, packaging and waste create costs. Crop rotation, precision inputs, efficient ovens, reusable crates and food redistribution may reduce some pressure, but each requires investment and coordination. A useful conclusion states which stage the evidence covers and which stakeholders were not represented.
Field investigation: resource use in a local economy
Students can investigate how a local business, farm shop, market or community facility uses resources. Choose one enquiry question, such as “How do deliveries connect our local shops to wider suppliers?” or “How does a public building reduce energy demand?” Use public observation, published information and a safe site visit with permission. Do not enter restricted areas, photograph staff or customers without permission, or record confidential business data.
Map a route or draw a flow diagram, record the date and define what is included. A short observation cannot reveal a whole annual supply chain, seasonal demand or business contract. If interviewing a worker or manager, use neutral questions and explain the purpose. Present evidence using a map, tally, table or diagram and discuss what could not be observed. Compare two sites with the same method before drawing a general conclusion.
Common misconception
- “The primary sector only happens in poorer countries.” Farming, forestry, fishing, mining and energy extraction occur in high-income countries too and may use advanced technology.
- “A service economy no longer uses natural resources.” Services depend on buildings, energy, water, transport, food, devices and supply chains.
- “A sector's share of employment is its share of output.” Employment and production measure different things, especially when productivity and automation vary.
- “A falling sector share means fewer workers.” The share may fall while the number grows if the whole workforce expands; check totals.
- “Every country moves through the same sector sequence.” Sector patterns depend on histories, policies, resources, technology and global markets and can overlap.
- “All factories locate where wages are lowest.” Skills, energy, transport, suppliers, markets, regulation and reliability also matter.
- “A country label shows where all of a product was made.” Design, inputs, components, assembly, branding, shipping and repair may happen in different places.
- “A trade surplus proves that people are better off.” The balance does not show job quality, access, environmental costs or distribution of income.
- “All renewable resources are inexhaustible.” Forests, fish stocks, soil and freshwater can be depleted if use exceeds renewal or damages the system.
- “Renewable electricity is always available when needed.” Wind and solar vary with conditions; storage, balancing, interconnection and flexible demand matter.
- “A source's installed capacity is its annual output.” Capacity is a maximum rate under stated conditions; generation measures energy produced over time.
- “Low-carbon power means the whole economy is low carbon.” Electricity, transport, heat and industry are different parts of the energy system.
- “A high domestic food-production ratio guarantees food security.” Household affordability, nutrition, imports, inputs, storage, waste and resilience also matter.
- “Imports make a food system automatically insecure.” Diverse trade can increase flexibility, though concentration along one route can increase risk.
- “Water scarcity is only about rainfall.” Storage, pipes, pollution, demand, seasonal timing and affordability affect access.
- “Recycling removes the need to mine.” Recycling reduces some demand but needs collection and processing and cannot meet every material need.
- “A resource-rich place keeps all the value.” Ownership, processing, prices, contracts, taxes and environmental costs determine local benefit.
- “A new project always helps its host community.” Jobs, routes, costs, land use and profits may be unevenly shared.
- “One chart is enough to choose an energy or resource plan.” Decisions involve reliability, cost, access, environmental effects, time and more than one stakeholder.
Self-check
- Give one example of primary, secondary, tertiary and quaternary economic activity.
- How is employment share different from a sector's share of output?
- Name three factors that can influence the location of a factory.
- How can transport change a place's economic situation?
- Give two examples of rural–urban economic flows.
- What does a trade-flow map need to show clearly?
- How can specialisation bring both opportunity and risk?
- Why might a product's assembly location not receive all the value from a sale?
- What is the difference between an energy source and an energy carrier?
- Give one advantage and one challenge of wind or solar electricity.
- Why should installed capacity not be compared directly with annual generation?
- What does energy security include besides having a resource in the country?
- In the 2025 UK electricity-generation data, what did the 65 per cent figure include, and what did it not represent?
- How might an energy transition affect workers and communities differently?
- Why is food security more than the amount grown by farms?
- In the 2024 UK Food Security Report, what were the 2023 production-to-supply ratios for all food and indigenous foods?
- Why is a production-to-supply ratio not a complete measure of UK food security?
- Name two supply-chain disruptions that can affect food availability or price.
- Give one benefit and one possible cost of irrigation.
- How can healthy soils support both food production and other ecosystem services?
- Why can a resource be present but inaccessible to some people?
- Distinguish a renewable resource from a non-renewable resource, using an example of each.
- What is one way to reduce material demand, and what limitation remains?
- How can a quarry provide benefits and create environmental costs?
- Outline a safe, ethical enquiry into resource use at a local business.
Answers and reasoning
- Primary: growing wheat; secondary: milling it into flour; tertiary: transporting or selling it; quaternary: developing crop data or food-processing technology. Other valid examples are possible.
- Employment share counts workers in a sector; output share measures the value or volume produced. Productivity, automation and prices can make the shares different.
- Skills, suppliers, roads, ports, customers, energy, water, land, policy, safety and finance are examples. Explain how a named activity uses a factor.
- A new road, port or rail service can reduce journey time, connect suppliers with buyers or attract activity; it may also bypass places or increase traffic and land costs.
- Food or water moving to a city, commuters travelling to work, urban visitors going to the countryside, electricity entering the grid or rural residents using city services.
- Origin, destination, direction, time period, quantity or frequency, a clear legend and the route or geography represented.
- Specialisation can raise output and market access; dependence on one crop, mineral, employer or buyer increases vulnerability to price, climate, disease or demand changes.
- Design, research, components, finance, branding, logistics or retail may happen elsewhere and capture part of the product's value.
- A source provides energy; a carrier moves or stores usable energy. Wind is a source, while electricity and hydrogen can act as carriers.
- Wind or solar can provide low-operating-emission electricity and reduce fuel imports; output varies, and sites need land or sea space, grid connections and materials.
- Capacity is the maximum rate of output; generation is energy produced over a stated period. Output varies with operating time, weather and maintenance.
- Reliable infrastructure, affordability, diversity, storage, transport, maintenance, exposure to shocks and fair access are all relevant.
- It combined nuclear and renewable sources in the electricity-generation fuel mix for 2025. It did not represent all energy use, household access or every individual power source.
- Some workers may gain new jobs and training; others may face closure, relocation, retraining or lower income. Effects depend on location, skills, investment and worker support.
- People also need physical and economic access to safe, nutritious food; stability, affordability, transport and household needs matter.
- The report estimated 62 per cent for all food and 75 per cent for foods that can be grown commercially in the UK, for 2023.
- It uses a stated value-based method and does not capture all imports, household affordability, nutrition, waste, input dependencies or local inequalities.
- Drought, disease, port closure, cyberattack, conflict, shipping delays, fuel or fertiliser prices, and labour shortages are examples.
- It can stabilise crops and improve yields; it can also compete with households or ecosystems for water, use energy and affect rivers or aquifers.
- Healthy soil supports crop growth and can help maintain water quality, biodiversity, carbon storage and flood regulation.
- Pipes, roads, affordability, ownership, pollution, infrastructure, legal rights, technology or location can limit access even where a resource exists.
- A renewable resource can be replenished on a human timescale if use is sustainable, such as wind or a well-managed forest. A non-renewable resource forms much more slowly than it is used, such as coal or copper ore.
- Repairing, reusing, recycling or designing products to last can reduce new extraction. Collection, energy, quality loss and growing demand mean recycling does not replace all new materials.
- A quarry can provide construction materials, jobs, taxes and local contracts; it can also create noise, dust, traffic, habitat and water impacts. Planning, monitoring and restoration matter.
- Choose one question and site, obtain permission, use public observation, protect personal and commercial information, record date and method, and explain limits of a short sample.
Revision points
Classify activity by its main function, then explain how stages connect through supply chains. When analysing location, name the place, activity and interacting factors. For a sector graph, state whether it measures workers, output or trade. For energy and food data, identify the denominator, year and method. Trace resource flows from source to user and identify access, ownership and environmental effects. Evaluate a proposal using reliability, cost, work, access, ecosystem effects and the views of affected people.
Curriculum alignment
- Curriculum coverage IDs:
ks3.human.economic-sectors,ks3.human.trade-links,ks3.human.natural-resources,ks3.human-physical-interaction - Related practice packs:
ks3_geography_industry_economic_activity,ks3_geography_energy_resources - Shared concept tags:
economic-activity,sectors,trade,natural-resources
Sources
- Curriculum/specification: https://www.gov.uk/government/publications/national-curriculum-in-england-geography-programmes-of-study/national-curriculum-in-england-geography-programmes-of-study
- UK energy production, consumption and fuel data: DESNZ: Digest of UK Energy Statistics 2026
- Energy-generation emissions and the 2025 low-carbon electricity mix: DESNZ: 2025 UK greenhouse-gas emissions, provisional figures
- UK domestic and imported food supply: Defra: UK Food Security Report 2024, supply sources
- UK supply-chain disruptions and household food access: Defra: UK Food Security Digest 2025
- Official mineral statistics and surveys: British Geological Survey: UK minerals statistics
- For case-study facts, use the source list and figures selected by your teacher; dates, totals and local conditions can change between datasets.