 FoxChild@Learn
13. International development and globalisation
Curriculum status: Required core content.
This guide follows the England Key Stage 3 Geography programme of study. Schools choose their own sequence and detailed place exemplars; the coverage map in the curriculum framework shows how this guide fits the full programme.
Required knowledge
- Explain that development includes social, economic, political and environmental change and is uneven within as well as between countries.
- Compare indicators and explain limitations of single measures.
- Describe global connections through trade, migration, investment, communication and supply chains; evaluate who benefits and who bears costs.
Key vocabulary
| Term | Meaning |
|---|---|
| development | changes in well-being, opportunity and economic structure |
| GDP/GNI per person | average economic output or income measure |
| HDI | composite measure using health, education and income |
| globalisation | growing connections across places |
| TNC | company operating in more than one country |
| economic growth | increase in the value of goods and services produced over time |
| inequality | uneven distribution of resources, opportunities or outcomes |
| poverty line | defined income or consumption threshold used to identify poverty |
| purchasing power parity (PPP) | method that adjusts currencies for differences in local prices |
| Gini coefficient | summary measure of income inequality, interpreted using its stated scale |
| multidimensional poverty | overlapping deprivations across more than one aspect of wellbeing |
| human capital | knowledge, skills and health that can support people's choices and work |
| infrastructure | physical systems such as roads, electricity, ports, water and communications |
| commodity | raw material or primary product traded between places |
| value chain | linked stages that design, produce, transport, sell and service a product |
| global value chain (GVC) | value chain with stages distributed across multiple countries |
| foreign direct investment (FDI) | investment that gives a foreign investor lasting interest or influence in an enterprise |
| transnational corporation (TNC) | company that owns or coordinates operations in more than one country |
| comparative advantage | ability to produce something at lower opportunity cost than another producer |
| remittance | money sent by a migrant to people or organisations in another place |
| aid | resources or support transferred to address a development need or goal |
| fair trade | trading approach with standards intended to improve conditions and terms for producers |
| sustainable development | improving wellbeing while protecting the conditions and resources needed in future |
| resilience | capacity to prepare for, cope with and recover from change or shock |
How the geography works
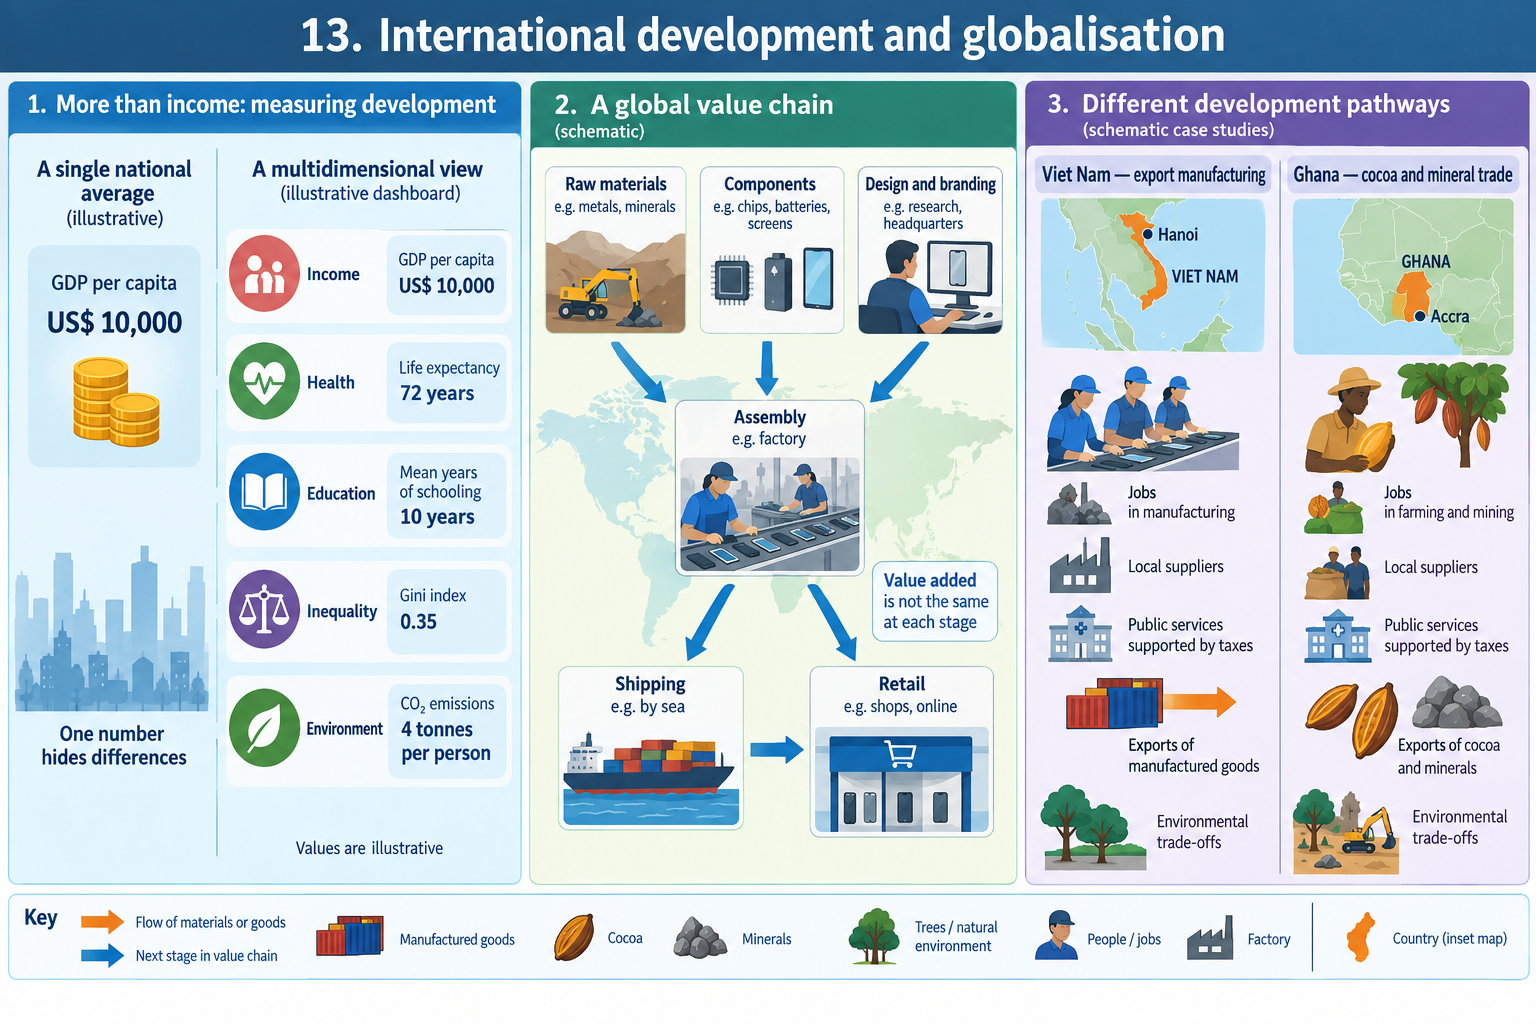
Trade and investment can create jobs, infrastructure and tax revenue, but gains depend on wages, ownership, working conditions, regulation and environmental costs. Indicators summarise selected dimensions: an average can hide inequality, unpaid work, local prices or differences between regions.
Development is a long-term process through which people's opportunities, health, security, knowledge, income and ability to make choices can change. It is not one destination that every country follows in the same order. A place can improve in one dimension and face a setback in another. Average income may rise while some households remain in poverty; school enrolment may improve while learning resources remain uneven; new industry may create employment while increasing air pollution or greenhouse-gas emissions. Geographers therefore ask what is changing, for whom, where, at what scale and over what period.
1. What geographers mean by development
More than economic growth
Economic growth usually refers to an increase in the value of goods and services produced in an economy over time. It can provide governments, firms and households with more resources, but it does not show how those resources are shared or used. Development is broader. It can include better health, education, safety, housing, political voice, clean water, reliable energy, transport, environmental quality and the ability to choose a livelihood.
Keep growth and development distinct. Growth is often measured using a money value, commonly a percentage change in gross domestic product. Development asks whether people's lives and choices have changed. Growth may support development if earnings and public revenue fund jobs, schools, health services and infrastructure. The link depends on ownership, taxation, public decisions, wages, prices and access. Growth can also occur without enough secure work, or create costs that reduce people's wellbeing.
Development is spatial. A national average can rise while one region, neighbourhood or social group gains little. A new airport might connect a capital city to international trade while a remote district remains far from a clinic. An industrial zone may employ thousands of workers but depend on imported components and send much of its profit to owners elsewhere. A country can perform strongly in one sector and experience weaker outcomes in another. Always consider both the whole-country pattern and variation within it.
Development is also temporal. A statistic from one year is a snapshot, not a permanent label. A longer series can show direction and speed, but changes in definitions, surveys, prices or methods can make comparisons difficult. Record the year, unit, boundary, population covered and source for every indicator. When events such as conflict, a pandemic, drought, a commodity-price shock or a policy change affect an economy, the effects can appear at different times in different measures.
Scale and perspective
Geographers study development at several connected scales:
- At the individual or household scale, access to food, income, education, care, safe housing and decision-making can vary between people living on the same street.
- At the community scale, a village or neighbourhood may have different transport, water, employment and environmental conditions from a nearby settlement.
- At the regional scale, infrastructure, climate, investment, history and political decisions can create contrasts between a coast and an inland region, or between an urban core and a rural periphery.
- At the national scale, laws, public spending, taxation, trade strategy and services shape opportunities, while national averages can hide local differences.
- At the global scale, trade, finance, technology, migration, climate and political relationships connect places and can spread both benefits and risks.
A change can look different from each viewpoint. A mine can raise export revenue on a national account, generate wages for workers and suppliers locally, and still affect nearby water or land. The national measure records one part of the picture; interviews, environmental monitoring and household data help reveal others. Identify who is speaking and which outcome that person values. There is rarely a single measure that represents every perspective.
Development priorities can differ too. A government may prioritise employment and export earnings; households may value secure wages and affordable services; a business may seek predictable transport and energy; an Indigenous community may prioritise land rights and cultural continuity; an environmental group may emphasise ecosystem protection. These priorities may overlap, but they can also conflict. A sound geographical account describes the disagreement and tests claims with evidence instead of assuming one objective is automatically shared by everyone.
2. Measuring development carefully
Income and production measures
Gross domestic product (GDP) estimates the monetary value of goods and services produced within a country during a period. Gross national income (GNI) estimates income received by a country's residents and businesses, including some income from abroad and subtracting some income paid abroad. The distinction matters where foreign-owned companies produce a large share of exports or where residents earn income overseas. A rise in GDP does not automatically mean that the average household receives an equal rise in income.
Dividing GDP or GNI by population produces an average per-person figure. This makes countries of different population sizes easier to compare, but it is not a typical person's pay. One very wealthy group can raise an average even if many people have low incomes. A mean and a median answer different questions: the mean divides the total by the number of people; the median is the middle value when people are ordered. Both can hide differences by gender, location, occupation, disability or other characteristics.
Currency conversion adds another challenge. Exchange-rate comparisons use market rates that change. Purchasing-power-parity measures adjust for the different prices of comparable goods and services in different countries. Neither method captures every local cost or household need. When quoting an income-based poverty line, name the currency basis, price year and purchasing-power-parity version; two dollar figures using different PPP bases should not be compared as if they were identical.
Human-development indicators
The Human Development Index (HDI) combines measures of life expectancy, education and income to summarise selected dimensions of human development. It is useful for a broad comparison because it is not based on income alone. The United Nations Development Programme explains that a fuller assessment also requires other indicators and information in its statistical annex. HDI remains a summary: it does not directly measure every person's safety, freedom, environmental quality, unpaid work or access to political power.
The Multidimensional Poverty Index (MPI) identifies overlapping deprivations in health, education and living standards using specified indicators and thresholds. Its country notes help show that poverty can involve several connected disadvantages. An index result depends on its definitions, available household surveys, dates and the population included. A national MPI cannot describe every community, and a household-level measure may not show that resources are shared equally among its members.
Other indicators answer narrower questions. Life expectancy at birth summarises mortality patterns; infant or maternal mortality focuses on particular outcomes; literacy measures a defined ability; school enrolment records participation rather than learning; access-to-water indicators depend on what is counted as safe and accessible. An indicator can be valuable without being a complete picture. State what it measures and what it leaves out.
Inequality and distribution
The Gini coefficient summarises income distribution on a scale where lower values indicate a more equal distribution and higher values indicate greater inequality under the dataset's method. It does not reveal where inequality occurs, who is at the top or bottom, or whether basic needs are met. A country can become more equal while most people remain poor; another can reduce poverty while income differences increase. Use it alongside poverty and service indicators.
Disaggregated data divide a national total into meaningful groups, such as regions, rural and urban areas, age groups or genders. A table can show a gap between a national mean and a northern region, but the category “rural” can include very different settlements. A map can show clusters while concealing variation inside a large district. If data permit, compare several scales and use the same years and definitions.
Environmental indicators add another dimension. Air pollution exposure, water quality, forest change, carbon emissions and hazard exposure can reveal costs that national output totals do not. Yet these, too, need interpretation: emissions may be counted where goods are produced or where they are consumed; forest loss can be measured using different definitions; and local pollution can vary sharply within a city. The measure chosen affects the story a map or chart can tell.
A practical indicator comparison
Suppose two countries have similar GNI per person, but one has longer life expectancy and higher school participation while the other has greater average income. The correct conclusion is not that one number is wrong. The indicators measure different dimensions. Ask whether their dates match, whether they use the same definitions, and whether either country has large regional or gender gaps. Then explain what more evidence is needed to understand the differences.
When comparing a map, use its title, date, unit, source, scale and classification. A choropleth shades areas by a value; it can make a large low-population region look as visually important as a densely populated one. Class intervals can change which differences stand out. A chart may show percentages while another shows counts. Never compare the visual height of bars unless the axis and units match. If a map uses national averages, avoid saying that all people in a coloured area share the same conditions.
Correlation means that two variables vary together in the data. It does not by itself prove that one caused the other. A country with higher incomes may also have more years of schooling, but a chart alone cannot show whether education caused income growth, whether income enabled more schooling, or whether other factors influenced both. Use a plausible process, a time sequence and evidence from another source before making a causal claim.
3. Why development is uneven
Differences in development emerge through interacting conditions over time. Physical geography can influence costs and risks, but it does not determine a country's future. A landlocked position may increase the cost of reaching ports, yet roads, rail, regional agreements and reliable border procedures can reduce that barrier. Drought can threaten crops and water supply, while irrigation, storage, drought-tolerant crops, diversified work and fair access can change vulnerability. A cyclone can cause severe losses, but exposure, housing quality, warning, health services and recovery support shape the consequences.
Historical processes influence the distribution of wealth, land, infrastructure and political power. Colonial rule often reorganised economies to extract and export particular resources, drew borders across existing social and ecological systems, and shaped transport routes towards ports. Present-day conditions cannot be explained by history alone, and countries and communities have made their own choices since independence. However, historical patterns can persist through unequal land ownership, trade relationships, language, debt or infrastructure that is expensive to adapt. Explain a specific link rather than using the word “history” as a complete cause.
Government institutions and public decisions matter. Clear laws, effective public services, trusted institutions, accountable budgets, transport investment and access to education can support development. Conflict, corruption, exclusion, unstable policy or weak capacity can interrupt services and discourage investment. These factors are not simple labels for a country or people: they vary over time, across institutions and between regions. Check evidence before attributing an outcome to governance.
Economic structure affects exposure to change. A country reliant on a small number of exports can receive strong revenue when prices rise and face pressure when prices fall. Processing more goods domestically can add value and skills, but may require electricity, finance, trained workers, technology, market access and environmental safeguards. Services, agriculture and industry can all support development; no sector is automatically more beneficial in every place.
Education, health and gender equality interact with the economy. Healthy people may be better able to learn and work; education can open choices, improve productivity and support political participation. If girls face barriers to secondary schooling or women have limited access to land, finance and safe employment, the loss affects individuals, households and the wider economy. Measures need to examine access, quality, safety and outcomes, not just the existence of a school or legal right.
Climate change can deepen existing inequalities because exposure and capacity to adapt are uneven. A low-lying delta may support farming, cities and trade while facing flood risk. Poor households may live in places with higher exposure and fewer resources to recover. Wealthier households can also face severe losses, but insurance, infrastructure, political influence and savings alter their choices. A fair analysis identifies the hazard, the people and assets exposed, the vulnerability, the coping resources and the decisions that could reduce risk.
Avoiding one-cause explanations
A weak explanation says: “The climate is dry, so the country is poor.” It skips the ways people manage water, the different livelihoods in the country, local history and access to trade or services. A stronger answer might explain that rainfall variability affects rain-fed farming; an unreliable harvest can lower income and raise food prices; limited storage or irrigation can amplify the effect; and transport, credit, insurance, land access and public support influence how households cope. The chain links physical conditions to human decisions without claiming that climate fixes the outcome.
Another weak explanation says: “The country exports oil, so everyone becomes rich.” Export earnings may support services or infrastructure, but benefits depend on ownership, tax collection, spending, price changes, employment links, corruption control and environmental costs. A national export figure does not show how income is distributed or whether nearby residents have clean water and secure work. Ask where money flows after extraction and which data could reveal its local effects.
For a multi-cause explanation, sort evidence into physical, historical, economic, political, social and environmental influences. Select a few that can be connected in a chain. Explain how one condition affects another, then identify a feedback or response. Avoid listing every possible cause without showing how they relate. A careful answer often uses phrases such as “contributed to”, “can increase the likelihood of” or “interacted with” rather than claiming one factor is always decisive.
4. Globalisation: connections between places
Globalisation describes the growth and intensification of connections across countries and regions. It is not a single force arriving from outside: people, governments, firms, communities and institutions create or change these links through decisions. Connections include the movement of goods, services, money, workers, ideas, data, technologies, media and cultural practices. Transport containers, air travel, mobile communications, digital platforms, trade agreements and financial systems can make some links faster or cheaper, although access to them is uneven.
How a product connects a chain of places
Consider a pair of trainers. Design work may take place in one country, synthetic materials and cotton may come from several others, components may be made in specialised factories, final assembly may occur near a port, and a brand may market and sell the product in many countries. Warehouses, shipping firms, shops, online platforms and repair or recycling services add further stages. A label naming the assembly country does not show the full chain or how much value each location receives.
At each stage, ask who owns the assets, who performs the work, what skills and wages are involved, where profits go, which taxes are paid and who bears environmental costs. A host location may gain jobs, training, supplier contracts, export income, tax revenue and infrastructure. These effects are stronger when local firms supply inputs, workers gain transferable skills, regulation is enforced and public investment connects poorer communities to opportunities. They may be weaker where production relies on imported components, jobs are insecure, companies can move quickly, or public revenue is not used effectively.
Production networks change. A buyer can switch suppliers; a factory can move; a conflict, port closure, flood, disease outbreak or trade-policy change can interrupt transport. Firms may diversify suppliers to reduce risk, while a community dependent on one employer may remain exposed. Resilience can be strengthened by skills, local suppliers, reliable energy, social protection, more than one source of income and fair contingency plans. Diversification is not automatically easy: a new industry may require different training, capital and infrastructure.
Trade, specialisation and terms of exchange
Trade allows places to exchange goods and services. A country may specialise in products for which it has suitable resources, skills, technology, infrastructure or lower opportunity costs, then import other goods. Specialisation can increase output and market access, but a narrow export base can make income vulnerable to world prices, weather, crop disease, shipping costs or a sudden fall in demand. The geography of trade involves both the flow itself and the power to set prices, standards, contracts and delivery conditions.
Many primary commodities are sold in markets where prices change. Farmers may face higher costs for fertiliser, fuel or transport while receiving a low or uncertain price for their crop. Processing, branding and retailing may capture a larger share of the final selling price than growing the raw product. This is not true for every commodity or producer; the value distribution varies by product, contract, ownership and market. A useful case study follows one commodity from production to processing, transport and sale, and asks what evidence can estimate the share retained locally.
Fair-trade labels, producer cooperatives, certification schemes and long-term buying contracts aim to improve aspects such as price certainty, standards, worker protections or collective investment. They can help some producers negotiate, plan and invest. They do not by themselves solve low productivity, land insecurity, unequal access to credit, poor transport, climate risk or the bargaining power of large buyers. Check the exact scheme, coverage and evidence; do not assume that every worker or farmer in an industry receives the same benefit.
Investment and company decisions
Foreign direct investment can provide capital, technology, management, export connections and employment. A foreign company may also have strong bargaining power, repatriate profit, seek tax incentives or produce pollution. Host governments may compete for investment, but the outcome depends on contract terms, labour rules, environmental enforcement, local ownership and whether firms create links with domestic suppliers. FDI figures record investment flows or stocks according to a definition; they are not a direct measure of wellbeing.
Transnational corporations can coordinate production across several countries. Their decisions influence where factories, offices, mines, farms and distribution centres are located. Firms often consider labour, skills, access to ports and markets, energy reliability, taxes, regulation, political risk and supplier networks together. A low wage alone does not guarantee a factory will locate in a place if workers lack training or transport and electricity are unreliable.
Digital globalisation can connect people to learning, banking, markets, remote work and public information. It can also exclude people without affordable devices, reliable connectivity, language access or digital skills. Online platforms may create jobs and reduce the cost of reaching customers while concentrating control over data, visibility and fees. Use local evidence to determine who participates, who owns the service and who has an alternative when it is unavailable.
Migration and remittances as development links
Migration connects places through people, skills, care, culture, work and money. A person may move within a country or internationally, temporarily or for a longer period, for several reasons at once. Movement can be influenced by work, education, family, safety, environmental change, housing or policy. A simple push–pull list may help organise ideas, but it should not treat a migrant's decision as automatic or reduce an individual to a single reason.
Remittances can support household food, schooling, health care, housing, debt repayment or investment. They can act as a useful income link when local employment or services are limited. However, access varies: migration itself can be costly, workers may face insecure conditions, and households without a migrant relative do not receive the same flow. A region relying heavily on remittances can also be affected by job losses or changing immigration rules in the destination. Remittance totals tell us that money moves; household surveys and interviews are needed to understand how it is used and shared.
Migration can benefit origin and destination places through skills, work, care and cultural connections. It can also create pressures if housing and services cannot respond to a rapid change, or if leaving removes workers a community needs. “Brain drain” describes the loss of skilled people from a region or country; “brain gain” describes the skills or networks gained through return, circulation or diaspora links. Both concepts need evidence. People may move more than once, return with new experience or maintain connections across borders.
Global links are selective and uneven
Places are not connected to global networks equally. A deep-water port, a major airport, a reliable electricity grid, a stable communications network and trained workers can attract investment. Remote areas, small producers and households with limited resources may have less bargaining power or fewer routes to markets. A supply-chain map can look like a web of connections while concealing who controls the most valuable decisions or receives the largest share of returns.
Globalisation can spread technology, jobs, ideas, foods, languages and cultural practices. It can support cooperation on health, climate, science and disaster response. It can also intensify competition, shift employment, spread financial shocks and increase pressure on land, water, energy and waste systems. The same link can carry opportunity and risk. An export factory provides wages and products while consuming electricity and water; international tourism provides income while increasing pressure on housing or ecosystems.
To explain the geography of a connection, identify the origin and destination, the flow, the route, the organisations involved, and the people affected. Then ask how the relationship has changed over time and what evidence would show its effects. This approach prevents “globalisation” from becoming a vague answer that names a process but does not explain what happened in a specific place.
Place example
The two examples below show how countries can connect to the global economy through different routes. Viet Nam illustrates export-led manufacturing and foreign investment; Ghana illustrates agriculture, minerals, oil and efforts to expand non-resource production. They are teaching examples, not labels for every resident. Both contain regional differences and varied livelihoods, and neither can be described by one headline measure.
Viet Nam: trade integration, manufacturing and upgrading
Viet Nam lies on the eastern edge of mainland Southeast Asia. Its long coastline, river deltas, inland borders, large cities and rural regions give it varied connections and development conditions. The country has undergone major economic change since the Đổi Mới reforms began in 1986. The World Bank describes how these reforms and favourable global conditions accompanied the shift from a very low-income economy to middle-income status. It reports that GDP per person rose from under US$700 in 1986 to almost US$4,500 in 2023 in constant 2023 dollars. Using the World Bank's lower-middle-income poverty line of US$3.65 a day at 2017 purchasing-power parity, the reported poverty share fell from 14 per cent in 2010 to below 4 per cent in 2023. These are dated measures with a stated poverty definition, not a description of every household or the current value of income. World Bank, Viet Nam overview
Manufacturing exports, foreign investment, trade agreements, infrastructure, education and domestic policy have all contributed to Viet Nam's connection with global markets. Factories assemble electronics, clothing, footwear and other products for export. Ports, roads, industrial zones and supplier networks connect production sites to buyers. Firms bring capital and access to markets; workers gain wage employment; government revenue and household spending can support other activity. This process can help reduce poverty and shift employment away from subsistence agriculture, though job quality and gains differ by location, skill and employer.
Export growth does not mean that the whole value of a product remains in the country where it is assembled. In its 2025 Viet Nam 2045 trade report, the World Bank states that foreign firms accounted for 73 per cent of exports, while local business participation in global value chains fell from 35 to 18 per cent between 2009 and 2023 under the report's measure. It argues that domestic firms capture only part of the value embodied in exports and that stronger local supplier links, services, skills and research can support the next stage of development. Check the report's definitions before reusing those measures: a “GVC-linked” firm has a specified combination of foreign ownership, technology licensing, exporting or importing. World Bank, Viet Nam 2045: Trading Up in a Changing World
This raises the question of value capture. Workers doing final assembly contribute to a product, but design, software, patents, finance, marketing, logistics and retail may be controlled elsewhere. If local firms supply materials or provide engineering, maintenance, design and digital services, more income and expertise can remain in the domestic economy. Supplier development is not automatic: it requires reliable power, standards, investment, trained workers, finance and relationships between large and small firms.
Employment gains bring questions about conditions and resilience. Factory work can offer regular wages, training and access to social insurance, yet some jobs remain repetitive or low-paid and may be affected by production targets, contract changes or relocation. Migrant workers can move from rural provinces to industrial centres, but housing, childcare, transport and access to local services can be uneven. The World Bank's 2025 report notes an emerging need for more highly skilled labour and expanded training as Viet Nam seeks higher-value activities. A development response can therefore include vocational education, opportunities for women and disadvantaged learners, labour protection and pathways for workers to move between sectors.
There are environmental trade-offs. Export manufacturing consumes land, water, electricity and materials, and creates transport demand and waste. The World Bank's 2025 report identifies the carbon intensity of export production and the exposure of manufacturing areas to climate hazards as challenges in Viet Nam's future trade model. A factory may raise income while depending on fossil-fuel electricity or occupying a flood-prone industrial zone. Clean power, efficient production, flood protection, emergency plans and environmental regulation can reduce some risks, but firms and communities need resources to make those changes. Count an environmental cost alongside jobs and output rather than treating it as an unrelated issue.
Viet Nam also shows how national progress can coexist with last-mile challenges. The World Bank overview describes improvements in health and poverty outcomes while identifying vulnerable households, skills, informal employment, social protection and climate resilience as continuing concerns. A national trend can conceal differences between urban and rural areas, coastal and inland regions, or majority and ethnic-minority communities. The correct lesson is not that export-led growth succeeds everywhere; it is that global connections can support development when they link to broad opportunities, local capabilities and effective public choices.
Ghana: primary products, uneven regions and economic diversification
Ghana is on the Gulf of Guinea in West Africa, bordering Côte d'Ivoire, Burkina Faso and Togo. Its economy is connected to global markets through cocoa, gold, oil, agricultural products, services and manufactured goods. The World Bank describes oil, cocoa and gold as major export commodities and records efforts to expand productive activity beyond natural-resource sectors. Because these commodities respond to global prices, export income and government revenue can change with world demand, harvest conditions, production costs and exchange rates.
Cocoa provides a useful way to follow a value chain. Farmers grow and harvest cocoa pods; beans are fermented and dried; traders, processors and exporters move them through local and international networks; manufacturers turn cocoa products into chocolate and other goods; brands and retailers market and sell them. Each stage needs labour, transport, knowledge, equipment and capital. The final retail price is not the same as the amount received by a farmer. Where processing, packaging, branding and product design occur affects which places retain income and skills.
Farmers' earnings can be exposed to crop disease, rainfall variation, ageing trees, input costs, transport access and shifts in global demand. Higher world prices do not always pass directly to each producer: local purchasing systems, contracts, national pricing arrangements, processing capacity and currency conditions matter. Cocoa is also linked to land and forest change. Expanding cultivation can put pressure on forests and soil, while climate change may alter the conditions suitable for production. Agroforestry, better farm management, traceable sourcing and restoration can help address some pressures, but results depend on land rights, finance, farmer participation and the livelihood alternatives available.
Gold and oil connect Ghana to international commodity markets through a different geography. Extraction can create skilled and less-skilled work, infrastructure, export revenue and supplier demand. It can also be capital-intensive, create relatively few direct jobs, affect land and water, and leave the country exposed to price fluctuations. The distribution of tax and royalty income, contract transparency, environmental monitoring and decisions about public investment influence whether resource wealth improves broad wellbeing. A high export value should therefore prompt further questions, not settle the development debate.
Regional inequality is another important part of the Ghana example. The World Bank's country overview, updated in October 2025, describes continuing poverty and a substantial difference between northern regions and the country as a whole; the underlying data, date and poverty line should be checked before using a precise comparison. Differences in rainfall, transport, service access, employment structure, historic investment and distance from major markets can interact. A map of poverty rates by region may highlight a broad pattern but can hide differences between urban centres, rural districts and individual households.
Development strategies include improving water and sanitation, strengthening social protection, supporting farmers and small businesses, expanding energy access, improving roads and encouraging export-led manufacturing. The World Bank's Ghana overview reports, for example, that a Greater Accra water and sanitation project had improved access for hundreds of thousands of people, and describes support for non-resource investment and jobs. These are project-reported results; they do not show that all of Ghana has equivalent access, nor do they establish the full long-term impact of a programme. A useful study identifies the project boundary, its target population, the outcome measured and the comparison used.
Economic diversification can reduce dependence on a narrow group of commodities, but diversification takes time. Agro-processing, clothing, recycling, digital services, tourism and renewable energy each need workers, reliable transport and power, investment, market demand and suitable rules. A new industry may create jobs but still depend on imported materials or external finance. A project needs to be assessed for wage quality, gender access, local suppliers, government revenue, environmental effects and whether skills can transfer to other work.
Ghana and Viet Nam are not a ranking pair. They have different histories, populations, institutions, resources, locations and policy choices. The comparison is useful because it highlights two trade connections: primary commodity chains and manufacturing value chains. Both can bring income and employment; both raise questions about ownership, skills, domestic links, environmental costs and how gains are shared. Use the example that best fits the question and keep every claim attached to a stated date and source.
Comparing the examples without reducing them to labels
| Question | Viet Nam | Ghana |
|---|---|---|
| Important global links | Manufactured exports, foreign investment, trade agreements, supplier networks and services | Cocoa, gold and oil exports; agriculture, services and emerging non-resource production |
| Possible development gains | Jobs, wages, export access, infrastructure, poverty reduction and supplier capabilities | Farm income, extraction and processing jobs, export revenue, services and public investment |
| Uneven outcomes to investigate | Differences in firm ownership, region, skill, job quality and access to training or social protection | Regional service and income gaps, producer bargaining power and distribution of resource revenue |
| Environmental pressures | Energy use, emissions, industrial pollution, land use and climate exposure of export zones | Forest and soil pressure, mining impacts, water quality and climate risks to farming |
| Follow-up evidence | Domestic value added, local suppliers, wages, working conditions, skills, energy mix and flood exposure | Farm-gate and export prices, local processing, poverty by region, land cover, water quality and use of public revenue |
When comparing, use the same kind of evidence and date where possible. “Exports are more important in country A” is unclear unless the measure is named: export value, share of GDP, employment embodied in exports or share of firms selling abroad are different quantities. Explain how the trade pattern relates to people's opportunities and identify a limitation of the comparison.
5. Strategies for supporting development
Development strategies try to change a condition, expand an opportunity or reduce a risk. They can be initiated by governments, communities, businesses, charities, international organisations or partnerships among them. A useful strategy has a clear aim, an identified group or place, resources, a mechanism and a way to judge its results. Ask whether a project addresses a cause of a problem or only one visible symptom.
Infrastructure, services and skills
Roads, ports, railways, electricity networks, broadband, water systems and sanitation can connect people and firms to jobs, health care, schools and markets. Infrastructure can lower travel times, reduce spoilage, improve reliability and attract investment. Its effects depend on location, maintenance, affordability, safety and the services it actually connects. A new road may bypass settlements; a broadband connection has limited value where devices or data plans are unaffordable; a water main may not reach informal neighbourhoods. Measure who gains practical access, not only how many kilometres were built.
Investment in health and education can support people throughout their lives. Vaccination, nutrition, maternal care, clean water and accessible clinics improve wellbeing directly and can reduce days lost to illness. Good-quality schooling, vocational training and lifelong learning can broaden choices and help workers move into new activities. Buildings alone do not guarantee these outcomes: schools need trained teachers and materials, clinics need staff and supplies, and education must be reachable, safe and relevant. Compare attendance, completion and learning, and disaggregate outcomes where possible.
Reliable institutions support the delivery of these services. Transparent budgets, public participation, enforceable labour and environmental rules, fair tax collection, accessible legal processes and protection from discrimination can shape who receives opportunities. Institutions may have different capacities and face resource limits. A policy written on paper is not the same as a policy implemented in every district; look for evidence of staffing, funding, enforcement and public experience.
Aid and international cooperation
Aid can transfer money, expertise, equipment, emergency relief or debt support from one organisation or country to another. Humanitarian aid responds to an urgent crisis, while long-term development assistance may support health, education, infrastructure, governance or livelihoods. Aid can provide resources that are scarce locally, save lives and support recovery. Its results depend on timing, design, local knowledge, coordination, accountability and whether services can continue when a project ends.
Aid can cause problems if a project is designed without the people who will use it, if funding rules favour external contractors, if parallel services weaken local institutions, or if a donated item is difficult to repair. Emergency food support can be essential during a crisis but may affect local markets if its timing and source are poorly planned. These are reasons to examine the specific programme, not to assume all aid helps or harms. Ask who set the priorities, who controls the money, how local workers participate and what happens after external funding stops.
Debt relief can reduce some repayment pressure and release public money for other priorities. It does not by itself create jobs, fix service access or guarantee that released resources reach those most in need. The type of debt, conditions, budget decisions and future borrowing all matter. International cooperation can also include technology sharing, disease monitoring, climate finance, trade agreements and disaster preparation, each with its own distribution of influence and responsibility.
Trade, fairer value and local enterprise
Trade-focused approaches aim to increase access to customers or improve the position of producers. Fair-trade certification may include a minimum-price mechanism, premiums for collective projects, labour or environmental standards, and requirements for transparent relationships. Producer cooperatives can pool storage, transport, equipment or bargaining power. Local processing may add value and create skilled work near the source of a crop or mineral.
These approaches work only within their actual scope. Certification can cover some producers but not all workers or farms in a sector. A minimum price may not reach a household if it is excluded from the scheme, lacks enough crop to sell or must pay high transport costs. Processing requires reliable energy, machinery, finance, skills, quality controls and buyers. Local business support can widen opportunities, but a small firm can still face competition, limited credit and unstable demand. Evaluate who participates, the share of production included and how benefits are measured.
Microfinance and small-business loans can help people manage an investment or bridge a temporary shortage of cash. Loans are not a guaranteed route out of poverty: borrowers need a viable opportunity, fair terms and protection against shocks. Debt can increase pressure if an illness, crop failure or price fall reduces income. Savings groups, insurance, grants, training and public services are different tools with different risks. Ask what constraint the intervention addresses and whether it transfers too much risk onto a household.
Tourism, manufacturing and diversification
Tourism can provide income to guides, transport workers, accommodation, food suppliers, craftspeople and public services. It can support conservation or help maintain cultural and historic sites. Benefits depend on the share of visitor spending retained locally, job quality, ownership, seasonality, access to training and links with local suppliers. If an external company owns hotels, imports most supplies and repatriates profits, visitor numbers may rise without the same increase in local income.
Tourism can also increase pressure on water, housing, roads, ecosystems and heritage. Seasonal work may offer irregular income; local residents may be priced out of popular areas; wildlife disturbance can increase if visitor access is unmanaged. Community-led planning, environmental limits, local procurement, workers' rights, public transport and reinvestment can improve outcomes. These measures involve trade-offs and require monitoring. Compare visitor earnings with wages, housing costs, resource use and resident views over time.
Manufacturing can create jobs, supplier demand, technology transfer and export revenue. Diversifying into more than one activity may reduce reliance on a narrow set of commodities. Yet factories need reliable electricity, ports, finance, trained workers and rules for working conditions, safety and pollution. A new industrial zone can create well-paid technical jobs and lower-paid assembly work side by side. Examine the full employment structure, not just the headline number of jobs.
Agricultural development can improve yields, incomes and food security through irrigation, soil conservation, storage, extension advice, fair access to markets and climate-resilient methods. Higher production does not guarantee better nutrition if households cannot afford the food or if farmers are paid poorly. Irrigation can raise output but compete for water; mechanisation may increase productivity while changing labour demand; a new cash crop can generate income while increasing dependence on one price. A strong evaluation compares yields, earnings, food availability, water use, soil condition and who controls land.
A strategy evaluation frame
When judging a development strategy, use a chain:
- State the problem using a dated measure and identify the people or area affected.
- Explain how the proposed action is meant to change a cause or expand access.
- Identify who pays, owns, manages and participates.
- Predict direct and indirect effects on jobs, services, incomes, environment and resilience.
- Consider who is likely to gain, who may lose or be excluded, and over what period.
- Name indicators that could test the outcomes and state a limitation of each.
For example, a road project may lower the travel time to a market. That could help farmers sell perishable crops, students reach school and patients reach health care. To test the claim, compare travel time before and after, the number of trips, freight costs, prices received by producers and school or clinic access. Check whether bus services run on the road, whether maintenance is funded, and whether land was acquired fairly. A kilometres-built target is useful but cannot answer all of these questions.
6. Sustainable and inclusive development
Sustainable development aims to improve lives now while maintaining the environmental and social conditions people will need in future. The idea connects economic security, social wellbeing and environmental limits. It does not mean that every activity must have zero impact. It means that decision-makers identify costs, compare alternatives, avoid transferring harm to poorer groups or later generations, and monitor whether resources and ecosystems remain able to support life.
The United Nations Sustainable Development Goals (SDGs) provide a shared set of goals on poverty, health, education, equality, water, energy, work, cities, climate, ecosystems, peace and partnership. They help organise questions across sectors, but the goals are not evidence that a country has achieved them. A government or school can use an SDG to frame an enquiry, then choose measurable indicators and investigate local conditions.
Inclusion means that people can participate in and benefit from development. A project may increase average income while excluding remote communities, women, people with disabilities, minority language speakers or households without land titles. Accessible information, safe transport, representation in planning, secure work and protection against discrimination can change who benefits. Disaggregated data and community participation help reveal gaps, but people should not be treated as a single voice. Communities contain different ages, livelihoods, interests and power relationships.
Environmental sustainability requires attention to resource stocks and flows. A forest can provide timber, food, carbon storage, water regulation and habitat. Clearing it may create farmland or short-term income, yet reduce other services and increase erosion. A river can supply homes, farms, energy and factories, but extraction and pollution can affect downstream users. A fishery can sustain livelihoods if harvest rates and habitats allow populations to recover. Map the resource, identify users, follow the flow and ask how use changes its future availability.
Climate resilience is part of development because hazards can destroy homes, roads, crops, health and schooling. Adaptation may include flood warning, raised infrastructure, heat plans, crop diversification, drainage or mangrove restoration. Mitigation reduces greenhouse-gas emissions through cleaner electricity, efficiency, public transport, forest protection or changes in production. The two approaches can complement each other, but they answer different questions. A flood barrier adapts to a hazard; it does not by itself reduce global warming. A new renewable power project can reduce emissions but still need a fair land-use decision and grid connection.
Resilience is not only the ability to rebuild the same system after a shock. If a settlement repeatedly floods, recovery may require safer housing, restored wetlands, reliable warnings, income support and a land-use decision. A farmer facing recurring drought may need soil moisture, water storage, crop choice, insurance, savings and alternative livelihoods. A resilient strategy reduces exposure where possible, strengthens capacity, and avoids making people dependent on an intervention that cannot be maintained.
Maps, data and evidence
Read development indicators with units, definitions, year and scale. Compare like with like; do not rank countries using data from different years or treat correlation as proof of a single cause.
A step-by-step method for data interpretation
Begin by reading the source title, date, geography, population, unit and definition. A value such as “4.5” is meaningless without knowing whether it represents thousands of dollars per person, years of schooling, a rate per thousand or an index score. Check whether the figure is a count, percentage, rate, average, median or projection. Note the base year and whether prices use current dollars, constant dollars or purchasing-power parity.
Describe the pattern before explaining it. Identify the highest and lowest values, a broad gradient, cluster, gap or exception. Quote only enough data to support the description. If two regions have rates of 12 and 24 per cent, the second rate is double the first, but that comparison does not show why it is higher. A third measure or local evidence may be needed to develop an explanation.
Check how the measure was collected. Household surveys can miss people who are mobile, displaced or living in informal housing. Census data provide broad coverage but are not collected every year and may use categories that hide differences. National accounts may be revised. International indices combine data collected by multiple agencies and years. These limitations do not make the data useless; they affect how confidently and precisely a claim can be made.
When a series contains missing values, a blank does not mean zero. It may indicate that data were not collected, were not comparable or were withheld. Do not join distant years with a smooth line unless you explain the gap. When comparing countries, use the same database and definition if possible, and be cautious when one country's last available year differs from another's.
Making and interpreting a development map
A choropleth map shades areas by a value. It works best for rates or ratios that can be compared between places, rather than raw population totals. Check the class intervals and legend: a different set of breaks can make the same data appear more or less unequal. Identify the boundary system, because administrative regions, rural districts, urban built-up areas and survey zones may not align. If the map uses a large region, avoid describing every settlement inside it as having the regional average.
A proportional-symbol map can show totals such as the number of clinics, but overlapping symbols may hide smaller places. A dot map can represent counts or locations, but the dots may be randomly placed within an area and should not be mistaken for exact household addresses. A flow map can represent trade or migration, but line thickness, direction and time period must be clear. Each map is a designed argument about which features matter; ask what is included, omitted and made visually prominent.
GIS can overlay layers such as roads, elevation, flood risk, population, schools, clinics and land use. An overlay may show which communities are far from services or which infrastructure is exposed to flooding. Distance should be measured along usable routes where possible, not assumed from a straight line. A high-risk map combined with population data can indicate exposure, but it does not reveal household resources, building quality or whether warnings reach people. Add field verification and local knowledge when decisions affect communities.
Worked indicator comparison
Imagine a table compares Viet Nam and Ghana using GDP per person, life expectancy, schooling and poverty. Before writing a conclusion, check whether each indicator uses the same year and whether income figures use the same prices and exchange method. The World Bank's Viet Nam overview reports almost US$4,500 GDP per person for 2023 in constant 2023 dollars; it also reports a poverty share below 4 per cent in 2023 using a $3.65/day 2017 PPP line. These two values answer different questions. A reader should not compare that poverty line directly with a national poverty rate based on a different threshold.
Next, describe only the pattern the table supports. If one country has higher income but a similar life-expectancy value, say that the indicator set shows an income difference alongside a smaller health gap. Do not claim that the higher income caused the health result without more evidence. Ask whether regional averages, rural access or different survey years could alter the comparison. Cite the source so a reader can inspect the definitions and latest revisions.
Finally, state one conclusion and one limit. For example: “The indicators suggest that Viet Nam's export-led economic growth has accompanied major poverty reduction by the World Bank's 2023 measure. National averages cannot show how gains are distributed between regions, firms, workers or ethnic groups; employment and household evidence is needed to test inclusiveness.” This answer combines a pattern, a dated source, a cautious relationship and a clear limitation.
Field enquiry: whose access to opportunity?
A KS3 field enquiry can investigate how access to a service differs between neighbourhoods. The class could ask: “How does travel time to a secondary school vary across our study area?” First define what counts as a school, which routes are safe and whether travel time is measured by walking, public transport, cycling or car. Use public timetables or an approved route planner for secondary evidence, and check a sample route on a field visit. Do not collect classmates' precise home addresses; use anonymised zones or representative starting points.
Record the date, time, route assumptions and any closures. A bus journey may depend on service frequency, fare, transfer, walking distance and timetable. One route taken at midday does not show a pupil's early-morning journey. If the study compares neighbourhoods, use the same travel mode and time assumptions. Add a simple map, travel-time table and a short discussion of the limits. The enquiry measures one part of access; it cannot by itself show whether every pupil attends, feels safe or receives suitable teaching.
A second enquiry might map access to a food shop, clinic, library, job centre or park. Choose a clear measure such as walking time, opening hours or service frequency. If interviews are approved, ask neutral questions, explain how answers will be used, keep personal information confidential and do not pressure people to take part. Compare routes and service conditions rather than blaming individuals for barriers created by cost, timetable, disability access or location.
Common misconception
- “Economic growth and development are the same.” Growth measures an increase in output; development asks how opportunities, health, education, security and living conditions change and for whom.
- “A high average income means everyone is wealthy.” A per-person average can hide inequality, poverty, unpaid work and regional differences.
- “HDI shows everything important about a country.” It combines selected dimensions and must be read alongside inequality, poverty, safety, environmental and political evidence.
- “One poverty line can be used in every comparison.” Definitions, price years and purchasing-power-parity bases differ; state the line and method.
- “A higher school-enrolment rate proves better learning.” Enrolment measures participation under a definition, not attendance, teaching quality or learning outcomes.
- “A country with a difficult physical environment cannot develop.” Physical conditions affect opportunities and costs, but technology, policy, infrastructure and choices mediate them.
- “A resource-rich country will automatically be prosperous.” Ownership, revenue management, price exposure, employment and environmental rules shape who benefits.
- “Exports always help a country's poorest residents.” Trade can create work and revenue, but wages, local suppliers, prices, public choices and job quality determine distribution.
- “The country named on a product label receives its full value.” Design, components, assembly, finance, patents, branding and retail may be spread across places.
- “Foreign investment always brings the same benefits.” Outcomes depend on local links, work conditions, tax, ownership, regulation and where profits go.
- “All aid is helpful, or all aid is harmful.” Evaluate the programme's design, local participation, accountability, duration and measured outcomes.
- “Fair trade guarantees a good income for every producer.” Scheme coverage, bargaining power, volume, cost and participation vary.
- “Tourism creates only jobs.” It can support earnings and services while increasing resource use, seasonality, housing pressure or environmental disturbance.
- “Migration is caused by one push or pull factor.” Decisions can involve work, family, safety, education, environment and policy at the same time.
- “A correlation proves a cause.” A relationship suggests a question; a process, sequence and further evidence are needed to test causation.
- “A national average describes every district.” Disaggregate data and compare scales before making a local claim.
- “A missing figure means zero.” Missing data usually indicate no comparable value is available, not that the outcome did not occur.
- “The SDGs prove that development has happened.” They are shared goals; progress needs dated indicators and local evidence.
- “Sustainability is only about nature.” It also concerns livelihoods, access, fairness, economic security and the needs of future generations.
- “A new road or factory is automatically sustainable.” Examine location, use, access, upkeep, emissions, local effects and alternatives.
Self-check
- How is economic growth different from development?
- Why can an average income rise while some households remain poor?
- What three dimensions does the HDI combine?
- Name one feature the HDI does not directly measure.
- What does the Gini coefficient summarise, and what does it leave out?
- Why must a poverty statistic include its threshold and price basis?
- Give two reasons why rural and urban averages inside one country might differ.
- How can a physical condition influence development without determining it?
- Name two flows that can connect places through globalisation.
- Describe three stages in the value chain of a manufactured product.
- How can a TNC bring benefits and costs to a host place?
- What is a remittance, and why might households receive different benefits from it?
- Why does the assembly location not necessarily receive all value from exports?
- What does the 2025 World Bank report say about foreign firms' share of Viet Nam's exports, and what should you check before quoting it?
- Give one benefit and one challenge of Viet Nam's export-led development.
- Why is cocoa useful for tracing Ghana's links with global trade?
- Give two ways resource exports may support development and two possible risks.
- Name two types of evidence that could show whether development gains are shared across Ghana's regions.
- How can a road improve access, and what might stop all residents benefiting?
- Give one possible benefit and one limitation of fair-trade certification.
- Why can tourism increase income while also creating pressure?
- Distinguish adaptation from mitigation with an example.
- When is a choropleth suitable, and how can class intervals affect its message?
- Why does correlation between schooling and income not prove that one caused the other?
- How might a student investigate unequal access to a local service ethically?
Answers and reasoning
- Economic growth is an increase in the monetary value of production; development is broader change in people's opportunities, wellbeing, services, security and choices. Growth may support development, but the link depends on how benefits and costs are distributed.
- National income can be concentrated among a smaller group, and household earnings, prices, assets and access to public services vary. The average gives no distribution by itself.
- Health, education and standard of living, represented by life expectancy, schooling measures and GNI per person in the UNDP method.
- Inequality, poverty, empowerment, human security, environmental quality or political voice are not directly represented by the HDI score. Other measures and local evidence are needed.
- It summarises income inequality under a dataset's method. It does not show exact incomes, geography, access to services or whether people meet basic needs.
- Poverty estimates depend on the chosen threshold, price year, currency and purchasing-power-parity basis. Different lines identify different households, so rates need a comparable definition.
- Jobs and services may cluster in towns, while remote routes, rainfall, land use, investment, school access or health services differ between places. A specific answer should be supported by a map or dataset.
- Drought can affect rain-fed harvests, but storage, irrigation, crop choice, transport, credit, insurance and public support influence the effect on livelihoods.
- Goods, money, services, workers, ideas, data, technologies, culture and remittances are examples.
- A product might be designed, supplied with materials and components, assembled, transported, marketed, sold and serviced across several countries. Name at least three stages and explain the connection.
- A TNC may provide jobs, technology, capital, taxes and supplier contracts; costs can include insecure work, pollution, profit repatriation, tax incentives or exposure to relocation. Conditions depend on the company and host-place rules.
- It is money sent by a migrant to another place, often to support household needs. Not every household has a migrant, and the size, cost and purpose of transfers vary.
- Higher-value activities such as design, patents, software, finance, logistics, branding or retail may occur elsewhere. Assembly is one stage, not the full chain.
- The report says foreign firms accounted for 73 per cent of exports. Check the source date, definition and data basis; the associated report distinguishes export share from local firm participation in value chains.
- Benefits include export jobs, wages, lower poverty by the stated World Bank measure and supplier opportunities. Challenges include uneven job quality, limited domestic value capture, emissions, climate exposure or skills gaps.
- Cocoa moves from farms through buying, processing, export, manufacturing and retail. This reveals how location, ownership, prices and processing affect who receives value.
- Exports may create jobs, tax revenue, foreign exchange, infrastructure or local supplier work. Risks include volatile world prices, concentrated ownership, pollution, land and water damage or limited direct employment.
- Regionally disaggregated poverty or service-access data, household surveys, travel-time maps, school/clinic access, employment data or community interviews can help. Record date and definition.
- A road may shorten travel to markets, schools, jobs or clinics; fares, service availability, disability access, safety, household resources, route alignment and maintenance can still create barriers.
- Certification may improve standards, producer organisation or price stability for participating producers. Coverage can be limited, and the label alone does not prove that all workers receive higher income.
- Visitor spending can support jobs and local businesses; tourism can also increase seasonal work, housing prices, water demand, waste or habitat disturbance.
- Adaptation reduces harm from climate impacts, such as flood warnings or raised infrastructure. Mitigation reduces greenhouse-gas emissions, such as cleaner electricity or energy efficiency.
- A choropleth is useful for comparing area-based rates or ratios. Class breaks control which differences look large or small, and the boundary units can hide local variation.
- Both variables may be influenced by other factors, the direction of influence may be uncertain, and the data may not show change over time. A causal explanation needs a mechanism and supporting evidence.
- Define a service, use safe routes and comparable travel modes, map broad anonymised areas, record date and timetable assumptions, avoid personal addresses, and explain what the sample cannot show.
Revision points
Use a dated indicator with its unit, definition and limitation; then connect it to a named place and explain a plausible process. Separate a descriptive pattern from a causal claim. Follow one global flow from source to destination and show who controls each stage, who gains and who bears costs. Evaluate a development strategy using access, employment, distribution, environmental effects and the views of more than one stakeholder. Present development as multidimensional, unequal and open to change.
Curriculum alignment
- Curriculum coverage IDs:
ks3.human.international-development,ks3.human-physical-interaction,ks3.place-knowledge - Related practice packs:
ks3_geography_development_globalisation - Shared concept tags:
development,globalisation,inequality,trade
Sources
- Curriculum/specification: https://www.gov.uk/government/publications/national-curriculum-in-england-geography-programmes-of-study/national-curriculum-in-england-geography-programmes-of-study
- Further reading: World Bank: World Development Indicators
- Human-development measures: UNDP Human Development Index and UNDP Human Development Country Insights
- Viet Nam's dated national indicators: World Bank: Viet Nam overview
- Viet Nam's trade and value-chain evidence: World Bank: Viet Nam 2045—Trading Up in a Changing World
- Ghana's economy, regional gaps and development programmes: World Bank: Ghana overview
- Global development goals: United Nations: Sustainable Development Goals
- For case-study facts, use the source list and figures selected by your teacher; dates, totals and local conditions can change between datasets.