 FoxChild@Learn
3. Weather hazards
Curriculum status: Required core content.
This guide follows AQA GCSE Geography 8035. Named examples below are suggested teaching examples where the specification allows a school choice; use your teacher’s selected case study and verify current figures before an assessment.
Required knowledge
- Use pressure belts and surface winds in the general circulation model to explain broad weather and climate patterns.
- Explain tropical-storm conditions, global distribution, formation, structure, movement and likely climate-change effects on distribution, frequency and intensity.
- Describe UK weather hazards, analyse a recent UK extreme-weather example, and evaluate evidence about changing UK extremes.
Key vocabulary
| Term | Meaning |
|---|---|
| atmosphere | the envelope of gases around Earth, within which weather occurs |
| weather | the state of the atmosphere at a particular place and time, including temperature, wind, cloud and precipitation |
| climate | statistical patterns of weather over a long period, commonly assessed using multi-decadal records |
| global atmospheric circulation | large-scale movement of air that transfers heat and moisture between latitudes |
| insolation | incoming solar radiation reaching Earth |
| pressure belt | broad zone where average atmospheric pressure is relatively high or low |
| Hadley cell | tropical circulation cell in which warm air rises near the Equator, moves polewards aloft and tends to sink in the subtropics |
| Ferrel cell | mid-latitude circulation cell between the Hadley and Polar cells, associated with prevailing westerly surface winds |
| Polar cell | high-latitude circulation in which cold air tends to sink near the pole and flow equatorwards at the surface |
| Intertropical Convergence Zone (ITCZ) | near-equatorial low-pressure zone where the north-east and south-east trade winds meet and air rises |
| Coriolis effect | apparent turning of moving air caused by Earth’s rotation: to the right in the Northern Hemisphere and to the left in the Southern Hemisphere |
| trade winds | tropical surface winds blowing towards the ITCZ from subtropical high-pressure areas |
| westerlies | prevailing mid-latitude winds that generally blow from west to east |
| jet stream | narrow, fast-moving band of strong winds high in the atmosphere, often near the boundary between air masses |
| convergence | horizontal movement of air towards an area, encouraging air to rise |
| convection | vertical movement of air caused by heating and differences in density |
| low-pressure system | area where air pressure is lower than in surrounding places, often associated with rising air and unsettled weather |
| tropical disturbance | early cluster of showers and thunderstorms over warm tropical waters |
| tropical depression | organised tropical low-pressure system below the regional tropical-storm wind threshold |
| tropical cyclone | generic term for an organised, rotating low-pressure storm over tropical or subtropical waters |
| hurricane / typhoon / cyclone | regional names for strong tropical cyclones; the name depends on the ocean basin |
| latent heat | energy transferred when water evaporates and released when water vapour condenses |
| wind shear | change in wind speed or direction with height; strong vertical shear can disrupt a developing tropical cyclone |
| eye | relatively calm central region of a mature tropical cyclone, with sinking air |
| eyewall | ring of intense thunderstorms around the eye, usually containing the strongest winds and heavy rain |
| rainband | curved band of thunderstorms spiralling towards a tropical cyclone’s centre |
| storm surge | abnormal rise of sea level pushed towards a coast by strong winds and low atmospheric pressure |
| inundation | flooding of normally dry land by water |
| storm track | observed or forecast path of the storm’s centre |
| forecast cone | graphic showing a range of possible future storm-centre positions; it is not the full area that may experience impacts |
| storm tide | total coastal water level when storm surge combines with the astronomical tide and other local factors |
| primary effect | direct consequence of the hazard, such as wind damage or coastal inundation |
| secondary effect | indirect or later consequence, such as service failure, disease risk or loss of income after damage |
| exposure | people, buildings, livelihoods or infrastructure located where a hazard can affect them |
| vulnerability | conditions that make people or assets more likely to be harmed, including unsafe buildings or limited access to warnings |
| capacity | resources, knowledge, institutions and relationships that help prepare, respond and recover |
| monitoring | repeated observation of weather and environmental conditions, such as satellite tracking or river-level measurement |
| forecasting | use of observations and models to estimate future weather or storm conditions |
| warning | an official message about a possible hazard and the action people should take |
| preparedness | knowledge, plans, equipment, practice and coordination developed before an event |
| mitigation | measures that reduce the causes or likely consequences of a hazard or climate change |
| adaptation | adjustments that reduce harm or make the most of actual or expected climate conditions |
| attribution study | analysis estimating how climate change affected the likelihood or intensity of an event, with a stated method and uncertainty |
| baseline | reference period against which observations or anomalies are compared |
| return period | statistical average interval associated with an event magnitude in a specified dataset; not a timetable or guarantee |
How the geography works
Weather hazards connect processes operating at different scales. Uneven heating helps create global pressure and wind belts; those belts influence the tropical settings where cyclones form and the westerly flow that carries UK depressions. At a smaller scale, a storm’s track, wind field, rainfall and coastal shape determine local impacts. At the human scale, exposure, housing, livelihoods, warning access and emergency capacity influence who is harmed.
The causal chain is not “climate causes disaster” in one step. A physical event becomes dangerous when it intersects with people and assets. A tropical cyclone may produce extreme wind, rainfall and coastal water rise; a UK Atlantic depression may deliver prolonged rain into a saturated river basin. Land use, drainage, river management, building quality and preparation modify what follows. Keep weather event, hazard, risk, impact and disaster distinct when you explain that chain.
Place example
This guide uses Typhoon Haiyan (Yolanda), which struck the central Philippines on 8 November 2013, and the winter 2013–14 flooding of the Somerset Levels and Moors in England as detailed examples. They are selected examples, not a requirement to use exactly these places. The cyclone chapter follows the storm from warm-ocean formation to wind, rainfall and storm-surge impacts, then evaluates warnings, evacuation, emergency response and reconstruction. The UK example traces a succession of Atlantic depressions and prolonged rainfall into a low-lying, drained landscape where rivers, tides and pumping interacted.
Both examples require careful evidence. WHO reports 6,300 deaths, more than 28,000 injuries and 16 million people affected by Haiyan; reports use different cut-off dates for missing people and other totals. The Environment Agency now describes about 100 million cubic metres of floodwater over 65 square kilometres on the Somerset Levels in early 2014, while earlier event summaries published different estimated volumes. Preserve the source, date, area and category attached to each statistic rather than blending incompatible counts.
Maps, data and evidence
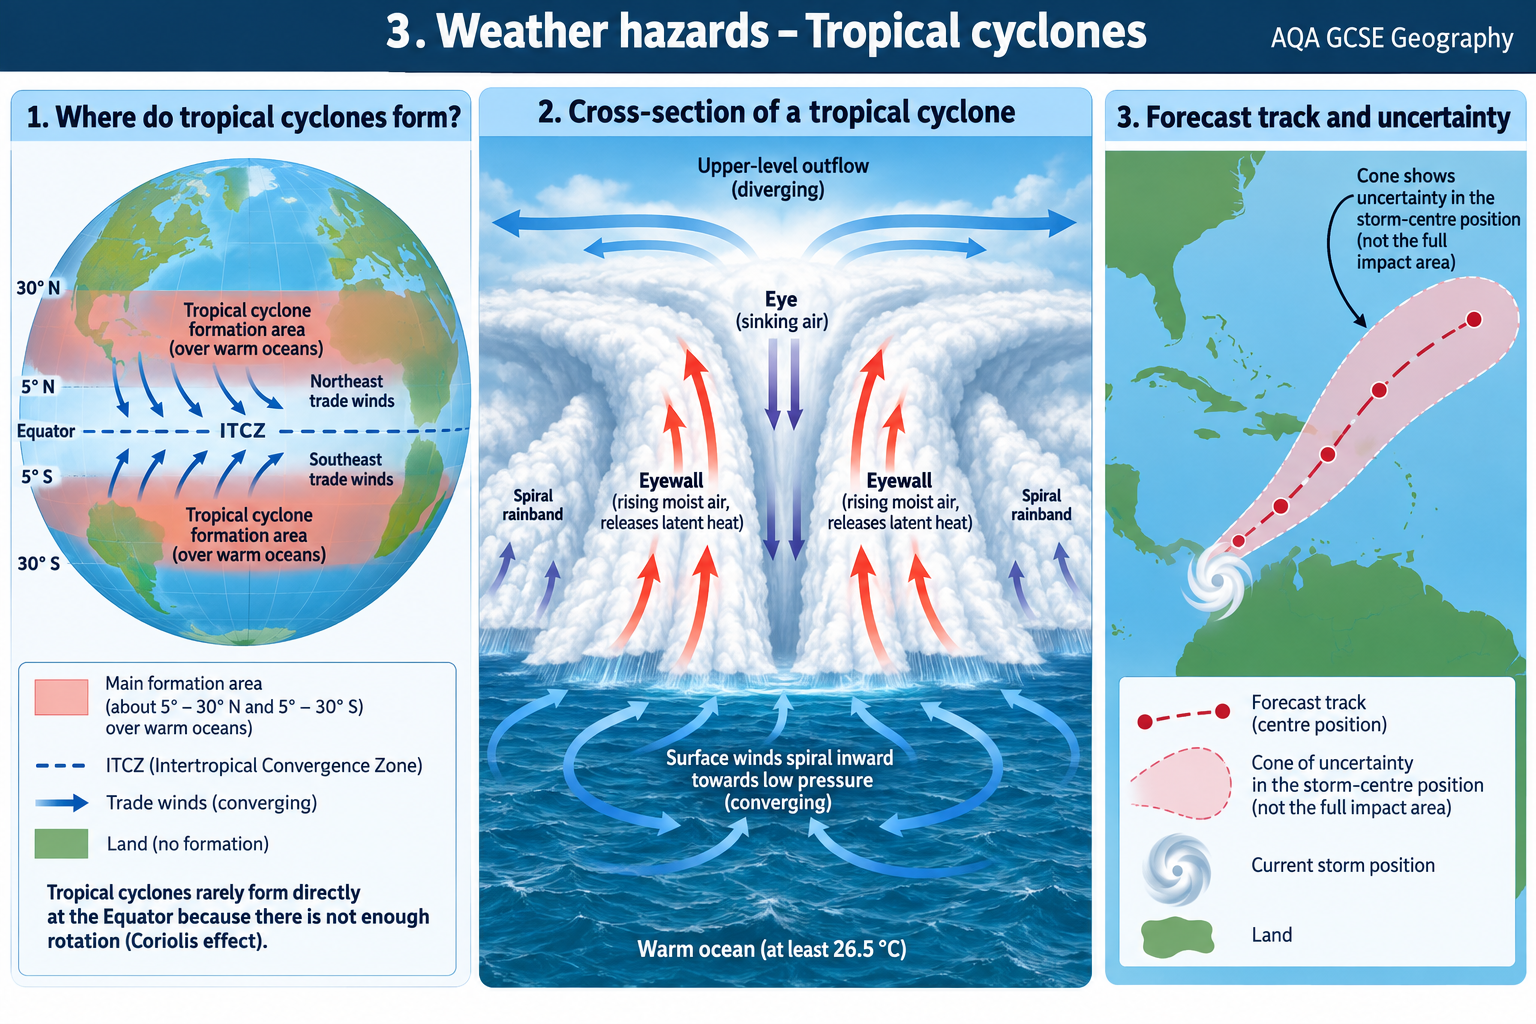
Use a world map to locate tropical cyclone basins and the broad latitudes where storms can develop. Add the ITCZ, trade winds and subtropical high-pressure zones to explain why storms cluster in tropical oceans and why they rarely start directly at the Equator. A track map for Haiyan should mark its approach from the western Pacific, landfalls across the central Philippines and weakening after landfall. A storm track records the centre; damaging winds and rain extend much farther away.
Read a forecast cone as a range of likely positions of the centre during forecast periods. It is not a solid boundary containing all impacts, a guarantee that the storm stays inside it, or a measure of wind or surge. Compare the cone issued at a named time with the later observed track to assess forecast error, but remember that uncertainty grows with lead time. Impact maps need separate layers for wind, rainfall, surge, elevation, settlements, roads and evacuation centres.
For the Somerset example, map the Parrett and Tone catchments, the Levels and Moors, the Quantock and Mendip hills, low-lying villages, roads, pumping stations, spillways and tidal influence near Bridgwater. A rainfall map alone cannot explain the flood: catchment boundaries, saturated soils, river levels, drainage, embankments, tide and water-storage areas also matter. On a hydrograph, identify the rainfall period, rising limb, peak discharge, lag time and recession; distinguish a measured river response from a modelled forecast.
For climate evidence, define the variable, season, region, baseline and period. A temperature anomaly is a difference from a reference average, not the actual temperature. Use long station records and regional series rather than selecting one memorable event. Separate detection (what changed), attribution (why it changed) and projection (what models suggest may happen under future conditions). State uncertainty and natural variability wherever the evidence requires it.
1. Global atmospheric circulation and weather patterns
Unequal heating creates a circulation
Earth receives more concentrated solar energy near the Equator than near the poles because sunlight strikes at different angles and travels through different thicknesses of atmosphere. The tropical surface warms the air above it. Warm, less-dense air rises, expands and cools; cooler, denser air tends to sink. This transfers heat and moisture and creates broad pressure contrasts. The real atmosphere is complex and constantly changing, but the three-cell model is a useful way to explain average pressure belts and surface winds.
Near the Equator, intense heating and converging trade winds contribute to rising air and a broad zone of low pressure called the Intertropical Convergence Zone. Clouds and frequent heavy showers are common. The rising air spreads polewards near the top of the troposphere. Around 30° north and south, some air descends, warms and dries, creating average subtropical high pressure. This helps explain the location of many hot deserts, although continentality, cold currents, relief and seasonal circulation also matter.
At the surface, some air from the subtropical highs returns towards the Equator. Earth’s rotation deflects these winds, producing north-east trade winds in the Northern Hemisphere and south-east trade winds in the Southern Hemisphere. They converge near the ITCZ. Because the ITCZ shifts with the seasonal migration of the zone of greatest solar heating, tropical rain belts also move. Land heats and cools faster than ocean, so the seasonal shift may be larger over continents than over nearby seas. This helps shape seasonal wet and dry seasons and contributes to monsoon circulation in some regions.
Between about 30° and 60° latitude lies the Ferrel cell in the simplified model. Surface air generally flows polewards from subtropical highs and is deflected into the westerlies, which blow broadly from west to east in the Northern Hemisphere. At around 60°, warmer mid-latitude air meets colder polar air; air rises along this zone and forms a belt of lower pressure. Depressions frequently develop and travel along the polar front. The UK sits in the mid-latitudes, where Atlantic depressions carried by the westerlies bring changeable weather, especially when the jet stream steers a sequence along a persistent path.
In the Polar cell, cold air tends to sink over the poles and flow equatorwards at the surface as polar easterlies. Where this air meets warmer air near the polar front, uplift and low pressure can occur. The boundaries between cells are not fixed walls. Pressure belts shift seasonally, and high- and low-pressure systems move, deepen or weaken. The model describes long-term averages; it does not tell you the weather at one place on one day.
Three cells, pressure belts and the Coriolis effect
The Hadley cell links rising air near the Equator with descending air in the subtropics. The Ferrel cell links subtropical and subpolar circulation in mid-latitudes, while the Polar cell describes circulation near each pole. In a diagram, show air rising at low pressure and sinking at high pressure, with surface winds labelled separately from upper-air flow. Arrows should form broad cells in both hemispheres; do not draw every layer as an exact closed loop.
Earth’s rotation changes the apparent direction of moving air relative to the surface. This is the Coriolis effect: moving air is deflected to the right in the Northern Hemisphere and to the left in the Southern Hemisphere. It helps create the directions of the trade winds, westerlies and polar easterlies. It also contributes to the rotation of large low-pressure systems. Near the Equator, the Coriolis effect is too weak to organise a tropical cyclone’s rotation effectively; this is one reason storms do not normally form within about five degrees of latitude of the Equator.
Pressure describes the weight of air above a location. Air tends to move from higher towards lower pressure, but its path is altered by Earth’s rotation and friction near the surface. In a low-pressure system in the Northern Hemisphere, surface winds spiral inwards and anticlockwise, while air rises. In the Southern Hemisphere, the direction is reversed. A high-pressure system generally has sinking air and surface divergence. These are broad patterns, not a substitute for a synoptic chart: local terrain and weather fronts can alter observed wind direction.
Jet streams and UK weather
Jet streams are fast winds high in the atmosphere near boundaries between contrasting air masses. The polar-front jet is associated with the boundary between warmer mid-latitude air and colder polar air. It is not a wall of wind that mechanically “pushes” every storm, but its position and meanders help steer and shape weather systems. When the jet is strong and its path carries Atlantic depressions repeatedly across the UK, unsettled, wet and windy weather can persist. A more northerly path may steer systems away from some regions; a meandering or slow-moving pattern can cause weather to linger.
The jet stream changes through the year and from one period to another. The UK’s weather also depends on the North Atlantic Oscillation, sea-surface temperatures, air-mass origins, the polar vortex, storm development and local conditions. Therefore the three-cell model gives a geographical framework, not a precise seasonal forecast. To explain a UK winter, connect the prevailing westerly flow and sequence of depressions to observed rainfall and ground conditions, then use a named example.
Worked circulation explanation
Suppose a diagram shows heavy rain near the Equator and dry conditions near 30° north. State the evidence first: the rain belt is a zone of frequent cloud and precipitation, whereas the subtropical area has more descending air. Then explain the process: strong solar heating and convergence lift warm moist air near the ITCZ; it cools as it rises, water vapour condenses and rain forms. Aloft, air moves polewards and later descends in the subtropics, warms and becomes relatively dry. This explains a broad climate pattern, not every local shower or desert boundary.
If a map shows a cluster of tropical cyclones between 5° and 30° north, relate it to tropical oceans, warm water and sufficient Coriolis effect. If the same map shows no storms at the Equator, explain the weak rotational deflection there. Avoid saying the Equator is “too hot” or that the ITCZ itself guarantees a cyclone: many tropical disturbances never develop into a cyclone.
2. Tropical cyclone formation and development
Conditions for formation
A tropical cyclone needs several conditions to act together:
- Warm ocean water and a deep source of heat and moisture. A commonly used guide is sea-surface temperature near or above 27°C over a sufficiently deep layer. This is not a universal switch: temperatures, depth, atmospheric structure and storm history all matter.
- A moist, unstable atmosphere. Warm humid air must be able to rise and sustain deep clouds rather than being diluted by very dry air.
- Low-level convergence. Winds from different directions meet near the surface, encouraging warm air to rise and clusters of thunderstorms to organise.
- Low vertical wind shear. If winds change greatly in speed or direction with height, the rising storm column can tilt and its heat and circulation become less organised.
- Enough Coriolis effect. The disturbance must form far enough from the Equator for Earth’s rotation to help generate spin.
- An initial disturbance. Tropical waves, clusters of thunderstorms or other low-pressure disturbances provide a starting focus. Warm water alone does not create a cyclone in a cloud-free atmosphere.
These conditions explain why tropical cyclones usually develop over warm tropical and subtropical oceans, commonly between approximately 5° and 30° latitude in either hemisphere. They occur in the Atlantic and eastern Pacific as hurricanes, in the western Pacific as typhoons, and in the Indian Ocean and South Pacific as cyclones. The same storm type has different regional names. Some tropical oceans have few or no storms because ocean temperatures, wind shear, circulation or other conditions are unfavourable. The South Atlantic is a useful reminder that the world map is uneven: warm water by itself is not enough when other atmospheric conditions do not support development.
The storm season differs by basin and hemisphere. It is linked to the seasonal pattern of ocean warmth and atmospheric conditions, not to a single date applying worldwide. A map should show the relevant basin and months if seasonality is part of the question. As the ITCZ migrates, the zones of convergence and favourable disturbance also shift, but a cyclone’s actual formation and track depend on changing weather systems.
A step-by-step development sequence
Stage 1: disturbance. Warm tropical seas transfer heat and water vapour to the air through evaporation. Clusters of thunderstorms may form where air converges and rises. In the western Pacific, tropical waves can help organise a disturbance; in other basins, the initiating features may differ. The first clouds are not necessarily the start of a cyclone: many disorganised clusters dissipate.
Stage 2: falling pressure and stronger uplift. If warm, moist air continues to rise, surface pressure falls. More air flows towards the centre. The converging winds carry additional moisture and energy, and thunderstorms become more organised. Earth’s rotation deflects the inflowing air, helping the system rotate around its centre.
Stage 3: condensation releases latent heat. As moist air rises and cools, water vapour condenses into cloud droplets and rain. Condensation releases latent heat into the surrounding air. This warms the column relative to its surroundings and supports further uplift and a lower surface pressure. The pressure gradient strengthens, drawing in faster winds. The energy loop is sustained by the warm ocean and moisture supply, although the storm’s structure also depends on its environment and upper-level outflow.
Stage 4: organised tropical depression. Thunderstorms consolidate around a low-pressure centre. Air flows inwards near the surface, rises in deep cumulonimbus clouds and spreads out aloft. If the circulation and wind speeds reach the basin’s defined thresholds, meteorological agencies classify it as a tropical depression, then a tropical storm and potentially a hurricane, typhoon or cyclone. Thresholds are based on sustained wind over a specified averaging period, which differs among agencies; do not compare categories without checking the definition.
Stage 5: mature cyclone. The system may develop a relatively calm eye, an eyewall of intense thunderstorms, and spiral rainbands. Strong winds and heavy rainfall can extend over a very wide area. The cyclone continues to strengthen only if the heat and moisture supply, atmospheric stability, wind shear and upper-level outflow remain favourable. A storm can fluctuate in strength, and a temporary weakening does not guarantee safety.
Stage 6: weakening or transition. Moving over land cuts off much of the warm-ocean energy and increases surface friction. Moving over cooler water reduces heat and moisture supply. Strong wind shear or interaction with other weather systems can also disrupt the circulation. The system weakens as a tropical cyclone but can still produce severe rain, flooding, landslides and damaging winds inland. Some storms moving into the mid-latitudes interact with fronts and undergo extratropical transition, changing their structure while retaining dangerous wind and rainfall.
Pressure, wind and uplift reinforce one another
At the surface, pressure is lowest near the centre. Air moves inward and is deflected into rotation. Around the eye, the pressure gradient is steep and the strongest sustained winds are commonly in or near the eyewall. Rising air and intense condensation in the eyewall maintain tall thunderclouds. Near the top of the storm, air diverges away from the centre; this upper-level outflow helps prevent air from accumulating aloft. If outflow becomes blocked, the storm’s structure may weaken.
The storm is sometimes described as a heat engine. Warm water evaporates; water vapour carries energy into the atmosphere; condensation releases latent heat as air rises; and the pressure and circulation can intensify. That description is useful but simplified. The cyclone does not draw energy from a “hole” in the ocean or from land heating. Its development is part of a coupled ocean-atmosphere system, and the storm itself can churn colder water upward, reducing the heat available beneath it.
Winds do not blow at the same speed everywhere. Wind depends on the pressure gradient, storm size, movement, local friction, coastline shape and surrounding systems. A storm with a smaller radius of maximum winds can have very intense winds near its eyewall, while a broad storm may affect a much larger area. Maximum sustained wind is not the same as a short gust, and different agencies average sustained wind over different periods. Always attribute a wind statistic to its source and averaging definition.
3. Structure, movement and hazards of tropical cyclones
Reading the structure
The eye is a central region of relatively sinking air. It may have lighter winds and fewer clouds for a time, but this calm is temporary: the eyewall can arrive after it. People should never interpret an eye passage as the end of danger. In a mature system, the eyewall surrounds the eye and contains powerful thunderstorms, intense rainfall and often the strongest winds. Rainbands curve around the storm and can produce squalls, flooding and occasional tornadoes in some regions.
In a vertical cross-section, draw a deep column of cloud around the eye. Show surface winds spiralling inward, rising strongly through the eyewall and outward flow high above. Label the eye, eyewall, rainbands, ocean heat and direction of movement. Do not draw the eye as the source of all wind or show every part of the storm as equally intense. The storm can be hundreds of kilometres across, so impacts extend far beyond its centre.
Four linked hazard pathways
Extreme wind. Strong winds can remove roofs, break windows, uproot trees, damage power lines, collapse weak buildings and scatter debris. Wind pressure can cause structural failure, while flying material creates additional danger. Power and communication outages can prevent warnings, refrigeration, water treatment and medical services from functioning. Wind impacts depend on building design, maintenance, trees, exposure, wind direction and the time people have to shelter.
Storm surge and waves. Strong onshore winds push water towards the coast; lower air pressure can add to the rise. The resulting storm surge is the abnormal component above the predicted astronomical tide. The actual water level at the coast—the storm tide—also reflects tide, waves, coastal shape, seafloor depth, river discharge and local defences. A shallow, funnel-shaped bay can increase water levels in some conditions. Surge can rapidly inundate low-lying coastal land, damage buildings and contaminate freshwater. Large waves can overtop or erode defences even if surge levels alone are lower.
Extreme rainfall and flooding. Tropical cyclones carry abundant water vapour. Persistent rain can overwhelm drains, raise river levels and flood settlements well inland. Slow-moving storms may deliver prolonged rainfall over the same catchment. Steep terrain can funnel runoff into valleys and trigger landslides or debris flows. Floodwater can damage crops, roads, bridges, water systems and health facilities; contaminated water can increase disease risks after the storm.
Secondary environmental and social hazards. Landslides can isolate upland communities. Salt water can damage fields and freshwater sources. Debris can block roads and drainage. Fuel spills, damaged sanitation and decomposing waste can affect water and health. Schools, clinics, ports and markets may close, interrupting education, health care, employment and supply chains. These chains can continue after winds have weakened, so “storm ended” does not mean “hazard ended.”
Why impacts vary around the storm
Wind speeds and rain are not distributed evenly. The storm’s forward motion interacts with its rotating winds, so the strongest winds can occur in particular quadrants depending on hemisphere and direction of movement. The largest surge depends on storm size, angle of approach, wind direction, coastal shape, water depth and tide—not simply on the category number. Heavy rain may occur far from the eye or after landfall. Forecasts should therefore communicate multiple hazards and not present a single category as a complete measure of danger.
Exposure is spatial. A low-lying city, fishing settlement, port, road corridor or hospital may be in the path of wind or surge. A community on higher ground may be less exposed to coastal inundation yet still face rain-triggered landslides or road failure. People living in informal housing, on steep slopes or beside rivers may experience different consequences from people in stronger buildings with several safe routes. Age, disability, language, income, migration status and access to transport affect the ability to understand or act on warnings.
Risk is not a fixed quality of a place. New housing, tourism, ports, mangrove loss, drainage changes, population growth, warning systems, building standards and emergency services alter exposure, vulnerability and capacity. A place may reduce wind risk through stronger roofs but remain vulnerable to surge. A community may receive an accurate forecast but lack a safe shelter or transport. Explain the particular risk factor a strategy changes.
How tropical cyclones move
Early in their life, many tropical cyclones are steered generally westwards by tropical easterly winds, with a gradual poleward component. As they move away from the Equator into the mid-latitudes, prevailing westerlies and other pressure systems may turn them eastwards or recurve them. The exact track depends on the surrounding flow, the storm’s structure and its interaction with land and oceans. A storm can speed up, slow down or change direction; a track forecast is uncertain and should be updated.
Storm tracks are not straight lines on a map. They can loop, stall or change direction. A storm moving slowly near a coast may bring prolonged rain and surge, whereas a faster system may reduce the duration of some impacts but still produce extreme winds. The storm centre can pass offshore while rainfall or wind causes severe impacts inland. A community outside the forecast cone may still receive hazards because the cone is not an impact boundary and storm size is large.
4. Climate change and tropical cyclones: a careful assessment
Distribution
The broad ocean basins and atmospheric conditions that support tropical cyclones will remain important in a warmer climate. A shift in ocean temperature patterns or the circulation of the atmosphere could alter where storms are most likely to form or travel, but regional changes are difficult to infer from one or two tracks. “Distribution” asks where storms form, intensify and move. A change in average sea-surface temperature does not mean that every basin experiences the same shift or that a storm will necessarily reach a particular coast.
Scientists investigate past observations and use climate models to assess possible future changes. Long, consistent records are difficult because satellites, wind estimates and storm-category methods have changed over time. A trend in one ocean basin may reflect natural variability, improved detection, climate change or several influences together. A robust statement identifies its geographical scale, time period and confidence rather than treating all tropical cyclones as one uniform global population.
Frequency and intensity
Frequency means how many storms occur in a defined area and period. Intensity can refer to maximum sustained wind, minimum central pressure, rainfall rate, storm surge or rapid intensification, so the measure must be specified. The Met Office describes ongoing scientific debate: models indicate that tropical-cyclone intensity may increase with continued global warming, while total global frequency may remain similar or decrease. Regional responses can differ. Therefore, it is inaccurate to claim that climate change has already made every basin produce more storms every year.
Warmer oceans and a warmer, moister atmosphere provide more available heat and water vapour. Physical understanding and modelling support the possibility of more intense rainfall and a greater proportion of very intense storms in some future settings. But the relationship is influenced by wind shear, atmospheric stability, ocean heat content, circulation, storm interactions and the way the storm cools the sea beneath it. A storm’s maximum winds may not rise in step with its rainfall or total damage.
Rapid intensification occurs when a storm’s wind speed increases quickly over a short period. Very warm water and favourable atmospheric conditions can support this, but predicting it remains difficult. Forecast agencies now use improved satellites and models, yet a rapid change may leave communities less time to complete evacuation. This is a planning challenge as well as a climate-research question.
Rainfall, sea level and coastal consequences
Even if global storm numbers do not rise, a warmer atmosphere can hold more water vapour, all else being equal. A cyclone may therefore produce heavier rainfall, increasing inland flood and landslide risk. Sea-level rise raises the background water level on which a surge and waves act. A surge of the same size can flood farther inland or reach higher levels when it coincides with a higher baseline sea level. This does not mean every storm surge grows by a fixed amount; local sea-level rise, storm track, tide, land movement and coastal form matter.
Storm impacts are also changing because exposure changes. Coastal cities grow, infrastructure becomes more valuable, people move into hazard zones and ecosystems that buffer waves may be damaged. Conversely, stronger building codes, better forecasts, evacuation planning and restored wetlands can reduce harm. When observed losses increase, do not assume that the physical storm alone intensified; population, wealth, asset value, reporting and preparedness are part of the comparison.
How to write the climate-change answer
Use a balanced three-part judgement:
- Mechanism: warming can increase atmospheric moisture and ocean heat; sea-level rise can raise the baseline for coastal inundation.
- Evidence and uncertainty: observed trends differ by basin and period; detection is complicated by natural variability and changing observation methods. Models offer projections with ranges and regional differences.
- Consequence: risk may increase through heavier rain, higher surge baseline or a larger share of intense storms, but total global cyclone frequency is not simply projected to rise everywhere.
Distinguish a weather event from a climate trend. One severe typhoon cannot prove a long-term change, and one quiet year cannot disprove one. Attribution studies ask whether climate change altered the likelihood or intensity of a specific event compared with a counterfactual world; they do not usually say that climate change was the sole cause. A useful GCSE answer should explain why evidence is uncertain and identify the physical process that could change risk.
5. Monitoring, forecasting and reducing tropical-storm risk
Monitoring and forecasting
Meteorological agencies use geostationary satellites to observe cloud patterns and movement repeatedly, and polar-orbiting satellites to collect different views and measurements. Radar can estimate rainfall and, near land, show bands and wind-related structure. Ocean buoys, ships, coastal stations, aircraft observations in some basins, pressure readings and sea-surface-temperature data help describe the storm and its environment. Observations feed computer forecast models that estimate the track, speed, intensity, rainfall and likely impacts.
Forecasting is probabilistic. Models may disagree because they represent atmospheric processes differently or begin with slightly different observations. A track cone communicates uncertainty in the predicted centre; uncertainty usually increases with lead time. Intensity is often harder to forecast than track because it depends on fine-scale structure, ocean heat and wind shear. Forecasts should be updated as observations change. An uncertain forecast is not useless: a range of plausible outcomes can still support preparation.
Agencies issue watches, warnings, storm-surge forecasts and rainfall or flood alerts. The message must be understandable, trusted, timely and actionable. “A severe storm is coming” is less useful than saying which areas may be inundated, when evacuation should begin, where shelters are and how residents without cars can travel. Messages should be accessible to people with disabilities, different languages, limited connectivity and different literacy levels. Warning reach should be measured by who received and understood it, not only by whether a bulletin was published.
Planning and preparedness
Land-use plans can limit new building in the most exposed coastal or flood-prone areas. Building codes can require roofs and connections designed for high winds, while elevation and flood-resistant materials may reduce water damage. Critical facilities such as hospitals, shelters, power stations, water plants and communication centres need siting and backup systems that reflect several hazards. Existing settlements cannot always be moved; retrofitting, evacuation routes and raised safe refuges may be more realistic.
Preparedness includes evacuation plans, shelters, transport, household supplies, school drills, public education, local volunteer networks and clear coordination among national and local agencies. Plans should identify people who may need help, such as older residents, people with disabilities, hospital patients, children, tourists and households without private transport. A plan written in an office may fail if roads flood, bridges are damaged, shelters are inaccessible or people distrust the warning.
Natural buffers such as mangroves, wetlands, dunes and reefs can reduce some wave energy, store water or stabilise coasts, depending on their health, width, elevation and the event. They do not provide absolute protection against a powerful cyclone. Restoration should be combined with evacuation, safe construction and warning. Ecosystems also support fisheries, biodiversity and livelihoods, so management decisions can have benefits beyond hazard reduction.
Immediate response and recovery
Before landfall, evacuation and sheltering can save lives when warnings arrive in time and routes are usable. Emergency services may pre-position boats, medical teams, food, clean water, fuel, generators, temporary communications and repair crews. During impact, responders conduct search and rescue, provide first aid, clear routes and establish incident coordination. After the storm, priorities include safe water, sanitation, shelter, medical care, food, electricity, debris removal and restoring transport and communication.
Recovery takes longer and can be unequal. Rebuilding homes “better” requires safer location or construction, finance, land rights, materials, labour and community participation. Relocation can reduce exposure but sever livelihoods, kinship and place attachment or move people farther from schools and work. A recovery total does not reveal who received assistance. Assess whether displaced people can return safely, whether incomes and services recover, and whether reconstruction reduces future vulnerability rather than recreating the same risk.
Judge a strategy by the risk it changes
Use a simple evaluation frame: what risk factor does it change, who can access it, when does it work, what can make it fail, and what trade-off does it create? A satellite improves monitoring but does not evacuate people. A warning can reduce exposure only if people receive it, trust it and have somewhere safe to go. A strong roof reduces wind vulnerability but not storm surge. A sea wall may reduce frequent coastal flooding but can be overtopped. An evacuation may save lives but be costly, difficult for people with mobility or transport barriers, and disruptive if warnings are false or prolonged.
The most effective risk management is usually layered. Forecasts guide warnings; accessible routes and shelters enable evacuation; strong buildings reduce wind losses; natural and engineered defences affect water; emergency services respond; long-term planning reduces new exposure; and recovery incorporates lessons. No one measure removes all hazard. Compare short-term life safety with long-term fairness, cost, environmental effect and residual risk.
6. Case study: Typhoon Haiyan (Yolanda), Philippines, 2013
Location, track and hazard characteristics
Typhoon Haiyan, called Yolanda in the Philippines, crossed the central Philippines on 8 November 2013. It developed over the western Pacific, where warm ocean water and favourable atmospheric conditions supported rapid intensification. The storm moved west-north-west across the Visayas, making landfall near Guiuan in Eastern Samar before crossing Leyte and other islands. It later moved into the South China Sea and weakened over land and cooler water. A track map should show the repeated island landfalls rather than a single point in Tacloban.
The World Meteorological Organization describes Haiyan as one of the strongest cyclones to make landfall, with maximum 10-minute sustained winds of about 230 km/h in its assessment. Wind estimates vary by agency and averaging period, so this is not interchangeable with short gusts or another agency’s one-minute value. In Tacloban and nearby coastal settlements, low-lying land and the shape of the coast increased storm-surge exposure. The UN Office for Disaster Risk Reduction reported a surge of about six metres at Tacloban Airport; this local observation should not be applied uniformly to the entire Philippine coastline.
The cyclone produced several hazards at once: destructive winds, intense rain, inland flooding, waves and storm surge. The surge and waves drove water into coastal neighbourhoods, while roofs and weak structures failed under wind. Roads, communications and the airport were damaged or obstructed, complicating rescue. In hills and rural areas, heavy rain increased runoff and the possibility of slope failure. The distribution of harm therefore depended on which hazard reached each location, not simply its distance from the eye.
Effects on people, livelihoods and places
The World Health Organization reports that Haiyan affected 16 million people, injured more than 28,000 and killed 6,300. These are reported national totals; other sources use different reporting cut-offs, especially for people missing after the disaster. Tacloban was among the hardest-hit cities. UNDRR reports that more than 5,900 fatalities were recorded there in the account it published ten years later. Always cite the source and do not add totals from different reporting dates.
Homes, schools, health facilities, shops, public buildings, port facilities and transport infrastructure were severely damaged in affected areas. Coastal inundation destroyed or displaced buildings and moved debris, boats and vehicles inland. Power, water, telecommunications and sanitation services failed or were interrupted. Where hospitals and clinics were damaged or crowded, people faced difficulty receiving treatment. The loss of a functioning airport and blocked roads reduced the ability to deliver relief quickly to some of the places that needed it most.
The social effects continued after the winds passed. Many households lost homes, documents, possessions and relatives. People sheltered in schools, public buildings, temporary camps or with relatives. Overcrowded shelters and disrupted water and sanitation increased health concerns. Children’s schooling was interrupted, and families experienced bereavement, stress and uncertainty while waiting for clean water, stable shelter and a way to earn income. A “displaced person” statistic can include people who move temporarily and people who cannot return to their home; it is not the same as a permanent resettlement total.
Economic effects included damage to farms, fisheries, shops, small businesses, roads and public infrastructure. Coconut production is important to many households in the central Philippines; damaged trees and processing facilities reduced income beyond the immediate storm period because crops take time to recover. Fishing communities lost boats, nets and landing facilities. Damaged roads and power supplies interrupted markets and supply chains. The cost of reconstruction placed pressure on public budgets and household savings, while workers who relied on daily income could lose earnings immediately.
Environmental effects included coastal erosion, saltwater contamination, uprooted vegetation, damaged mangroves and debris across settlements. Mangroves can reduce some wave energy and support fisheries, but their protective influence varies with width, density, elevation and storm conditions; they cannot guarantee protection from an extreme surge. Their loss may also affect biodiversity and livelihoods. After Haiyan, some communities restored mangroves as part of a wider approach to coastal resilience.
Why the impacts were so severe
Exposure: dense settlement and critical infrastructure occupied low coastal areas, including parts of Tacloban and other communities in Eastern Visayas. People, homes, the airport and transport routes lay in places where wind and surge could reach them. Fishing and port livelihoods connect communities to the coast, so simply moving all residents away would have serious social and economic consequences.
Vulnerability: the strength and location of buildings varied, and some homes could not withstand extreme winds, debris or deep water. Informal housing, low household savings and limited access to safe transport or secure shelter made protection harder for some residents. Warning information did not automatically create understanding of the specific storm-surge hazard. If people interpret a message as a familiar typhoon warning, they may not realise that water can rise rapidly and travel inland.
Capacity: the Philippines had national and local disaster institutions and issued advance forecasts and warnings. However, the storm affected a large area and damaged transport, communications and public facilities. Emergency teams had to operate while infrastructure was failing. Local resources and household capacity varied. National planning and outside assistance could support recovery, but the scale of damage challenged logistics and coordination.
These factors interacted. Stronger housing could have reduced wind damage but would not make a low-lying settlement safe from every surge. A warning could reduce exposure but only where the hazard is understood, transport or a shelter is available, and evacuation routes remain open. Physical hazard explains what the storm did; social and spatial conditions help explain who was harmed most.
Immediate response and the problem of access
Before landfall, the national weather service issued warnings and authorities organised evacuation activity. UNDRR’s post-event account describes local officials and barangay captains going door to door and trying to move residents from exposed areas. In Tacloban, some people did not understand what “storm surge” meant or did not expect water to rise as high as it did. Some residents were reluctant to leave homes or belongings; others thought their buildings were strong enough. This illustrates that a warning must communicate the likely impact in familiar terms and tell people what action to take.
Once the storm crossed the islands, local residents, local government, national responders, health workers and emergency services began rescue and relief. Roads were blocked by debris and damaged bridges; floodwater and power failure interrupted communications. Tacloban Airport was damaged and was affected by surge, limiting its early usefulness for relief traffic. The large international response brought food, water, medical teams, shelter materials and logistics support, but supplies had to move through damaged infrastructure. This produced delays and uneven access, particularly away from the main urban centres.
The immediate priorities were search and rescue, medical care, safe drinking water, food, temporary shelter, sanitation, restoring communications and reopening routes. WHO worked with the Philippine Department of Health as co-leads of the Health Cluster, coordinating more than 200 partner organisations and over 150 emergency medical teams, as described in its Haiyan summary. Coordination can reduce duplication and identify unmet needs, but only when local and international organisations share information and understand which services are operational.
One useful comparison comes from Tulang Diyot, a small island community in Cebu Province. UNDRR reports that all 1,000 residents were evacuated before the storm and survived, although all 500 homes were destroyed. The contrast with Tacloban shows that successful evacuation can protect lives without preventing property damage. It also shows why local knowledge, repeated drills, trust and a clear understanding of the hazard matter. The outcome cannot be explained by the storm’s strength alone.
Long-term responses and recovery
Recovery involved rebuilding homes and public facilities, restoring livelihoods and roads, and planning for future storms. The World Bank announced nearly US$1 billion of support for reconstruction, including budget support and funding for community-driven development of water systems, schools, health facilities, local roads and bridges. Its description emphasises assessment, engineering advice and community participation. This is an announced programme and funding commitment; it should not be described as proof that every damaged home or livelihood was fully restored.
The “build back better” principle aims to use recovery to reduce future vulnerability. Safer roofs and structural connections can reduce wind damage. Better siting, evacuation routes, accessible shelters, coastal risk information, communications and livelihood support can reduce other forms of risk. However, reconstruction takes time. Families may lack land titles or funds for rebuilding; jobs and transport may not return at the same pace as housing. A relocation zone may be safer from surge but farther from fishing grounds, schools, work or social networks.
UNDRR’s ten-year reflection notes that some settlements were no longer habitable and that resettlement created challenges because people could be separated from communities and places of work. Restoration of mangroves and community-based preparedness were among the later resilience measures. These strategies have more than one goal, but each needs maintenance, local support and monitoring. A nature-based measure cannot replace warning, shelter and evacuation; a new house cannot restore a lost livelihood by itself.
Evaluate the management
Haiyan demonstrates that forecasting and warning can provide valuable lead time, but communication and public understanding are as important as technical accuracy. Evacuation can be highly effective for life safety where routes and shelters are available, as Tulang Diyot illustrates. But evacuation does not protect property and can be difficult for households without transport or for people who fear looting or loss of income. A shelter should be reachable, structurally suitable for the expected wind and water, and equipped for people with different needs.
International assistance increased the resources available for medical care and recovery, but damaged roads, communications and the airport restricted access. Long-term reconstruction offered opportunities to build safer homes and restore infrastructure, but delivery was uneven and resettlement could disrupt livelihoods. The best judgement is therefore layered: Haiyan’s deaths were not inevitable, but no single warning, seawall, evacuation or funding programme could remove every risk. Forecasts, trusted communication, safe construction, land-use planning, evacuation, local capacity and equitable recovery need to work together.
7. UK weather hazards: types, distribution and management
The UK experiences a range of hazards because it lies in the mid-latitudes, is surrounded by seas and is exposed to Atlantic weather systems. The position of the jet stream and polar front helps steer depressions carrying wind and rain. The same weather system can affect regions differently because of relief, coast shape, catchment size, urban cover, soil saturation, drainage and the direction of prevailing winds.
Rain and river flooding can follow prolonged frontal rainfall, intense convective showers, saturated catchments or snowmelt. Rivers rise when precipitation exceeds infiltration, storage and drainage capacity. Flooding can affect low-lying properties, roads, farms and utilities. Surface-water flooding occurs when intense rain overwhelms drainage or cannot infiltrate built surfaces; it may happen away from a river. Coastal flooding can result from storm surge and large waves coinciding with high tides, especially where defences are overtopped or eroded.
Windstorms and depressions can damage roofs, trees, power lines and coastal defences. Cold, snow and ice can create hazardous roads, interrupt rail and air travel, isolate rural communities and increase risks for people without adequate heating. Heatwaves and drought can increase heat stress, affect health and labour, lower river flows, increase pressure on water supply and damage crops. Thunderstorms, lightning and hail can cause local injuries, fires, crop damage and flash flooding. Fog can sharply reduce visibility and affect transport. These hazards can overlap: a winter storm may bring wind, heavy rain, high tides and river flooding together.
Management includes weather observations and forecasts, Met Office warnings, Environment Agency or SEPA flood alerts, local emergency plans, public information, flood defences, drainage, river and catchment management, road closures, evacuation, cooling or warming centres, and recovery support. Forecasts help people prepare, but local impacts depend on action and access. Defences lower risk to a design level; they cannot remove all risk, and they may redistribute water or encourage development behind them.
8. UK case study: Somerset Levels and Moors floods, winter 2013–14
Why the Levels and Moors are exposed
The Somerset Levels and Moors lie between the Quantock and Mendip hills in central Somerset. They are very flat and low-lying; the Environment Agency notes that 18% of Somerset lies below average tide level. The area is crossed by the Rivers Parrett and Tone, and other rivers drain nearby areas. It has a long history of drainage and water-level management for agriculture and settlement. The low relief means floodwater can spread widely and drain away slowly, particularly when river levels are high and tides restrict outflow.
The flooding in early 2014 was part of the exceptionally wet and stormy winter of 2013–14. A succession of deep Atlantic low-pressure systems and a powerful jet stream brought repeated rain to the UK. The Met Office records at least 12 major winter storms affecting the UK during the season. January 2014 was the wettest calendar month on record at that time for south-west and south-east England in a series from 1910; in some southern areas, half to two-thirds of an average year’s rainfall fell in just over two months. Conditions differed across the UK, and a regional record should not be presented as a national rainfall total.
On the Levels, rain fell over catchments that drain towards the Parrett and Tone. Soils and drainage systems became saturated, reducing the ability to absorb further rainfall. High river flows moved towards the low-lying moors. Around Bridgwater, tides pushed water into estuaries as river flows travelled downstream; this interaction contributed to widespread flooding. The Environment Agency’s current Somerset summary estimates about 100 million cubic metres of floodwater over 65 square kilometres in the affected area. An earlier operational report estimated about 90 million cubic metres using information available during the event. These are dated estimates over a difficult-to-measure flooded area, not a contradiction that can be resolved by adding the two figures.
Social, economic and environmental impacts
The Environment Agency reports that residents of Northmoor had to leave homes and many communities were cut off at the height of the flooding. Muchelney and Thorney were isolated for a period, with boats used to help residents travel. Roads remained affected for weeks. Some residents could not use septic tanks or drain wastewater normally because surrounding land was flooded. This shows how flood effects extend beyond properties where water has entered a house: access, sanitation, deliveries, school and health services may be disrupted even when a building stays dry.
For households whose properties flooded, clean-up could involve removing contaminated water and damaged furniture, drying buildings and replacing heating, wiring or flooring. Returning home could take far longer than the period of high river levels. People who were cut off faced additional difficulty reaching work or obtaining supplies. Temporary accommodation and uncertainty could affect wellbeing, family routines and local businesses. Vulnerability differed according to property location, insurance, transport, age, health and access to alternative accommodation.
Agriculture was heavily affected because large areas of pasture and crops remained underwater for an extended period. Livestock needed moving to higher ground, and wet fields could delay grazing, planting and harvesting. Prolonged waterlogging can damage crops, soils, farm access and drainage. Where floodwater carries sewage or contaminants, water quality and habitats can be affected. Natural England assessed the effects of the 2013–14 event on wildlife and habitats; outcomes varied by species and habitat, and some floodplain wetlands are adapted to periodic inundation.
The disruption also affected roads, rail and supply chains. Flooding on the Levels and winter storms elsewhere damaged transport links, while the south-west rail route at Dawlish was severely damaged when storms destroyed part of the sea wall. The closure severed a major regional rail connection for weeks. It is important to separate that coastal storm damage from the fluvial flooding on the Levels: both belonged to the same stormy winter but had different immediate physical processes.
Immediate response
The Environment Agency monitored river and tide conditions, operated pumps and flood assets, issued flood information and worked with local authorities and communities. In late January, local councils declared a major incident. The 2013–14 operational account reports 108 pumps, including temporary equipment brought from other areas and the Netherlands. Many operated continuously; this report estimated pumping rates peaked at about eight million cubic metres a day. Pumping reduced standing water but required safe access, power, operating staff and a place for water to drain. It could not pump away all water while rivers remained high or tides limited discharge.
Local councils and emergency services helped residents in cut-off communities, including boat transport. Temporary road closures and warnings helped reduce the risk of people driving into dangerous water. Farmers moved livestock, and volunteers and community groups helped residents obtain supplies and support. The national response coordinated forecasts, pumping capacity and resources across agencies. Emergency action could reduce immediate danger, but the duration of inundation meant some households and farms faced prolonged disruption.
Longer-term management and recovery
The Somerset Levels and Moors Flood Action Plan was developed with councils, drainage boards, residents, businesses and national agencies. Early actions included dredging targeted sections of the Rivers Parrett and Tone, repairing flood banks, improving pumping and control structures, raising roads and improving flood-warning trigger plans. The Environment Agency reports that the eight-kilometre dredge completed in 2014 removed about 130,000 cubic metres of silt. The agency said this could reduce the likelihood and duration of flooding in some locations but stressed that floods could not be prevented altogether. Dredging needs maintenance because sediment returns; it is one component of flood-risk management, not a complete solution.
Current management on the Levels includes permanent pumping stations and the option to use additional mobile pumps when trigger points indicate a need. The Environment Agency reports operating 21 permanent pumping stations across Somerset. Road raising and control structures can maintain access or reduce the chance of particular roads flooding. Repairs and maintenance help defences perform, but embankments and pumps need inspection, funding and operation. A pump station can reduce water levels only within its designed area and under the conditions for which it can discharge.
The Bridgwater Tidal Barrier Scheme is a longer-term response to tidal risk in the lower Parrett. Somerset Council describes it as part of the 20-year action plan accelerated after 2013–14; the scheme is intended to reduce the risk of tidal water travelling upstream. The same council notes that high river flows can coincide with tidal conditions. A barrier would address one pathway and must work with downstream defences, forecasts and river management; it does not stop rainfall or eliminate fluvial flooding. Construction and operation also require funding, maintenance, environmental assessment and coordination.
Assess the causes and management fairly
The winter’s atmospheric conditions supplied prolonged rainfall, while the catchment and landscape translated that rainfall into floodwater. Flat, low-lying land, saturated soils, high river flows, restricted drainage and tides all contributed to the extent or duration of flooding. Human management of channels and moors influenced storage and conveyance, but no single intervention explains the event. Debates about dredging should be evaluated with evidence about the reach, expected benefit, sediment return, maintenance and effects elsewhere. Dredging may move water more quickly through a section yet cannot prevent all rainfall, high river levels or tidal locking.
Management protected many properties and agricultural land, but some residents were still flooded or isolated. The difference between “properties protected” by assets and “properties affected” in an event matters: a defence may reduce risk for one area without preventing all flooding, and protection is not the same as a guarantee. Raised roads, pumps, dredging, alerts, flood banks and tidal barriers act on different components of risk. A balanced assessment considers who benefits, what residual risk remains, who pays, and how strategies affect wetlands, farming and downstream locations.
9. A recent UK example: Storm Babet, October 2023
Somerset gives a detailed example of prolonged river flooding, but the AQA specification asks students to study a recent UK extreme-weather event. In a course followed during 2026, the 2013–14 flood is a useful established case but may not count as recent for every school or teacher. Storm Babet (18–21 October 2023) provides a more recent example of extreme rainfall, flooding and wind impacts; students should follow the event their class has selected and use the latest examination guidance.
The Met Office reports that Storm Babet brought 150–200 mm of rain to the wettest parts of eastern Scotland and led to two red rain warnings. Angus’s 19 October rainfall was the wettest day in its daily record from 1891. The storm also brought widespread rain to England, Wales and Northern Ireland; England and Wales experienced their third-wettest independent three-day period in the Met Office series from 1891, while the Midlands provisionally recorded its wettest three-day period. Earlier October rainfall had already left some places saturated, so the additional rain fell onto catchments with limited spare soil storage.
Brechin in Angus was severely affected when the River South Esk rose and existing flood defences were overtopped. Residents were warned and evacuated from exposed areas; roads and services were disrupted. The Scottish Government’s response account reported severe flooding, hazardous river levels, casualties and a recovery period extending beyond the rain itself. The event shows that defences designed to reduce risk to a stated standard may still be exceeded by an event outside the design assumptions. Evacuation and warnings protected people even where property protection was insufficient.
Storm Babet demonstrates how extreme rainfall can combine with saturated ground, river catchments, relief and settlement location. The Met Office describes an unusual south-easterly flow that increased rainfall across eastern Scottish high ground, while western mountain areas sheltered some places from the worst of the rain. A single storm therefore created contrasting conditions across the country. As the area received repeated rain, runoff and river levels rose quickly. Local impact depended on the track and duration of rain, catchment response, defences and the location of homes and routes.
Responses included Met Office warnings, flood alerts, evacuation, emergency services, local authority coordination and government recovery support. Scotland activated its resilience arrangements; its government described support through local authorities, crisis grants and the Scottish Flood Forum for recovery advice. The Met Office later recorded two red warnings and the month’s exceptional rainfall. Warning effectiveness should be judged by lead time, access, comprehension and safe routes, not by whether every property was saved. A red warning communicates danger to life, so residents need practical ways to act.
Use the example carefully: Babet was one event and does not prove a long-term trend by itself. It can illustrate the causes, impacts and management of a recent UK extreme-weather event; use long-term rainfall and temperature series separately when answering whether UK extremes are becoming more common or intense. When citing a rainfall record, retain its area and measurement period—for example, an Angus daily record is not a UK-wide daily record.
10. Is UK weather becoming more extreme? Evidence and limits
“Extreme weather” is not one measurement. A claim may concern high temperature, heavy rainfall, strong wind, drought, snow or coastal water levels. Define the event threshold and region before comparing years. A sequence of warmer days does not prove more intense rainfall, and a record rainfall month does not by itself show that storm winds have strengthened.
The Met Office’s State of the UK Climate 2025 summary reports that 2025 was the warmest year in the UK series from 1884. The decade 2016–2025 was 0.51°C warmer than 1991–2020 and 1.33°C warmer than 1961–1990. It reports that, in Greater London, days above 30°C and nights above 18°C were more than four times as frequent in 2016–2025 as in 1961–1990. These are observed temperature indicators over stated periods, not evidence that every region or hazard changed in the same way.
Rainfall has strong year-to-year and regional variation. The Met Office reports that UK winter-half-year rainfall in 2016–2025 was 13% higher than in 1961–1990 and that very wet October–March months occurred about twice as often in the most recent decade compared with that earlier baseline. It also states that six of the ten wettest UK years since 1862 occurred from 1998 onwards. Such evidence supports a conclusion that some kinds of wet conditions have become more common, while short-duration extremes and regional patterns require careful analysis. A change in annual average rainfall cannot be substituted for a trend in hourly downpours.
Detection asks whether an observed variable has changed. Long, quality-controlled weather-station records, consistent definitions and a stated baseline help answer it. Attribution asks how much climate change altered the chance or intensity of an event; it may compare simulations of the current climate with a counterfactual climate without human influence. Projection asks what could happen under future emissions and warming scenarios. These tasks have different evidence and uncertainty.
The Met Office’s study of winter 2013–14 concluded that unusual tropical and stratospheric conditions largely produced the succession of storms. Its pressure-pattern analysis suggested that climate change contributed a secondary amount—about 10–15% of the excess rainfall in that event—by increasing atmospheric moisture. The authors also noted limits: the analysis did not capture every possible change to circulation patterns. This is a stronger answer than saying either “climate change caused the entire flood” or “climate change had nothing to do with it.”
Flood trends are especially difficult to infer from river impacts alone. Flooding depends on rainfall, river flow, soils, drainage, catchment land use, buildings, defences, river maintenance and reporting. A flood can become more damaging because more homes or infrastructure are exposed even if the weather hazard is unchanged. Conversely, improved warnings and defences can reduce impacts while rainfall extremes increase. The 2025 climate summary also records rising UK sea level; higher mean water levels can raise the baseline for coastal flooding and storm surges, although local land movement and tides matter.
For a balanced conclusion, identify which variable has clear evidence of change, which regions and seasons are involved, and what remains uncertain. There is strong evidence that UK temperatures have risen and heat extremes have increased. UK winter-half-year rainfall has also increased relative to earlier baselines, though rainfall varies greatly by year and region. Attribution of a specific flood or storm needs more than observation of the event. Avoid claiming that every UK weather hazard is becoming more frequent at the same rate.
11. Building a strong weather-hazard answer
For a process question, write a linked sequence rather than a list: warm ocean → evaporation and moist rising air → condensation and latent heat release → falling pressure and stronger inflow → organised rotating storm. Explain the role of Coriolis effect and low wind shear, then state that land, cool water or disruptive shear can weaken the system.
For a case study, organise the evidence as place and date → physical causes → hazard types → social/economic/environmental impacts → immediate and long-term responses → judgement. Use at least one statistic with a named source and definition. Explain why impacts vary within the region; do not say that “the whole country was affected equally.” For UK rainfall, distinguish the event’s atmospheric cause from its catchment and human vulnerability.
For an evaluation, compare the intended risk reduction with its limits. A forecast may provide time, a warning may trigger evacuation, and a building standard may reduce damage, but each depends on access and implementation. Finish by weighing effectiveness, equity, cost and residual risk. If asked about a trend, use a baseline and a long period, then distinguish observed change from attribution.
Short evidence-planning grid
| Task | Evidence to select | Explanation to add |
|---|---|---|
| Explain circulation | latitude, pressure belt, surface wind, air movement | connect heating, rising or sinking air and prevailing wind |
| Explain cyclone formation | ocean temperature, convergence, wind shear, latitude | trace the sequence from disturbance to rotating low pressure |
| Explain cyclone impacts | wind, surge, rain, affected settlement | connect hazard to exposure and vulnerability |
| Analyse UK floods | rainfall, catchment, river level, relief and tide | show how rainfall became runoff, high flow and inundation |
| Evaluate management | warning, evacuation, defences, pumps or recovery | identify the risk factor changed and the limit or trade-off |
| Assess a trend | dataset, region, baseline, time period and uncertainty | separate detection, attribution and projection |
Common misconception
- “A tropical cyclone can form anywhere if the sea is hot.” It also needs a suitable atmospheric disturbance, moist air, low wind shear, convergence and enough Coriolis effect; formation is very uncommon close to the Equator.
- “The eye is the most dangerous part because it is the centre.” The eyewall often has the strongest winds. The eye can be temporarily calm, followed by renewed danger as the opposite eyewall arrives.
- “The storm category tells us the whole risk.” Category is based mainly on sustained wind. Rainfall, surge, storm size, speed, tide, coast shape and vulnerability create other risks.
- “The track cone shows the area that will be hit.” It shows uncertainty in the predicted centre track. Hazardous wind and rain can extend beyond it, and the centre is not the only impact.
- “A cyclone stops being dangerous when it reaches land.” It usually weakens without ocean energy and with more friction, but can still cause destructive inland rain, floods and landslides.
- “Climate change means more tropical cyclones every year everywhere.” Global frequency trends and basin-level changes are uncertain; intensity, rainfall and coastal water levels are distinct measures.
- “The Somerset floods happened only because rivers were not dredged.” Prolonged rainfall, catchment runoff, low relief, high river levels, tide, soils, drainage, storage and defences interacted. Dredging changes channel capacity but cannot remove all flood risk.
- “One flood or heatwave proves the climate is changing.” Long observations and attribution methods are needed; one event shows what happened at a time and place, not a trend on its own.
- “More rain automatically means a larger flood.” Soil saturation, catchment size, river shape, drainage, tide, land cover and defences influence how rainfall becomes river flow and inundation.
- “A forecast is either perfectly right or useless.” Forecasts provide probabilities and update over time. Their usefulness depends on lead time, communication, trust and feasible actions.
Self-check
- What is the difference between weather and climate?
- Where does the ITCZ usually form, and what happens to air there?
- Name the three circulation cells in each hemisphere.
- How does the Coriolis effect change the direction of moving air in each hemisphere?
- What type of surface wind generally affects the UK in the mid-latitudes?
- Give four atmospheric or ocean conditions needed for tropical-cyclone formation.
- Why do tropical cyclones rarely form directly on the Equator?
- Describe how condensation can help a tropical cyclone intensify.
- Name and describe three parts of a mature tropical cyclone.
- State two reasons why a tropical cyclone may weaken.
- Explain one difference between storm surge and storm tide.
- Give two primary and two secondary effects a tropical cyclone could cause.
- Why is a forecast cone not an impact boundary?
- Distinguish frequency from intensity when discussing climate change and cyclones.
- Why should the claim “climate change makes more cyclones every year” be qualified?
- Name two ways satellite or ocean observations support cyclone forecasts.
- Give one reason a warning may fail to protect someone.
- How can mangroves help reduce risk, and why are they not a complete defence?
- What physical processes contributed to flooding on the Somerset Levels in 2013–14?
- Give one social, one economic and one environmental impact of the Somerset floods.
- Why can one not attribute all the 2013–14 rainfall to climate change?
- Name two management actions used on the Somerset Levels after the flood.
- Give one statistic showing the exceptional rain during Storm Babet.
- What evidence does the Met Office report for UK temperature or rainfall extremes changing?
- How should you distinguish detection, attribution and projection?
Self-check answers
- Weather describes atmospheric conditions at a place and time; climate summarises patterns over a long period.
- The ITCZ is a near-equatorial low-pressure zone where trade winds converge and warm moist air rises, producing frequent cloud and rain.
- Hadley, Ferrel and Polar cells.
- Moving air is deflected to the right in the Northern Hemisphere and left in the Southern Hemisphere.
- Westerlies, often arriving from the Atlantic and steered by depressions and the jet stream.
- Warm ocean water, moist unstable air, low-level convergence, low vertical wind shear, sufficient Coriolis effect and an initial disturbance; any four.
- Coriolis effect is too weak close to the Equator to organise the storm’s rotation effectively.
- Rising moist air cools and condenses; released latent heat warms the air column, supports uplift and can help lower pressure and strengthen inflowing winds.
- Eye: relatively calm centre with sinking air. Eyewall: ring of intense thunderstorms and often the strongest winds. Rainbands: curved storm bands that bring squalls and heavy rain.
- It may move over land or cooler water, experience strong wind shear, or lose favourable upper-level outflow.
- Storm surge is the abnormal rise pushed towards a coast by the storm; storm tide is total water level when surge combines with the astronomical tide and local effects.
- Primary: wind damage, surge inundation or immediate rain flooding. Secondary: loss of water or power, disrupted income, disease risk, isolation or later landslides.
- It shows uncertainty in predicted centre positions. Wind, surge and rain may extend beyond it, and impacts do not stop at the cone boundary.
- Frequency counts storms in a defined place and period; intensity measures a property such as sustained wind, minimum pressure or rainfall rate.
- Observations differ by basin and period; models project that intensity may increase while total global frequency may stay similar or decrease, with regional uncertainty.
- Satellites observe cloud and storm structure; buoys and ships measure ocean or pressure conditions; radar measures rainfall near land. Any two.
- Someone may not receive or understand it, trust it, have transport, reach a safe shelter, or be able to leave because of care or mobility needs.
- Healthy mangroves can reduce some wave energy and support coastal ecosystems and livelihoods. Their effectiveness depends on local conditions and they cannot guarantee safety during an extreme surge.
- Prolonged heavy rain saturated catchments; runoff raised flows in the Parrett and Tone; flat low-lying land drained slowly; tides near Bridgwater restricted outflow. Processes interacted.
- Social: residents evacuated or cut off. Economic: crops, livestock, roads or businesses disrupted. Environmental: prolonged inundation affected soils, water quality or habitats.
- The Met Office analysis found unusual tropical and stratospheric circulation was the main driver, while climate change made a secondary contribution by adding atmospheric moisture; the analysis also had stated limitations.
- Targeted dredging, repairs to flood banks, pumping stations, mobile pumps, raised roads, control structures, warning trigger plans, flood action coordination or the planned tidal barrier; any two.
- The Met Office reports 150–200 mm in the wettest areas of eastern Scotland, or Angus recorded 98.5 mm on 19 October 2023—the wettest day in its series from 1891.
- The State of the UK Climate 2025 reports 2025 as the warmest year since 1884 and increased very wet winter-half-year months relative to the 1961–1990 baseline. Answers must name the period and measure.
- Detection tests whether observations changed; attribution estimates causes or how climate change altered likelihood or intensity; projection models possible future conditions under scenarios.
Revision points
Use process sequence for formation; group event evidence clearly; assess long-term claims using records and a suitable baseline.
Curriculum alignment
- Curriculum coverage IDs:
aqa.3.1.1.weather-hazards - Related practice packs:
gcse_geo_p1_physical_environment_june_2022,gcse_geo_p1_physical_environment_june_2023,gcse_geo_p1_physical_environment_june_2024,gcse_geo_p1_physical_environment_november_2020,gcse_geo_p1_physical_environment_november_2021 - Shared concept tags:
weather-hazards,tropical-storms,uk-weather,risk-management
Sources
- Curriculum: AQA GCSE Geography 8035, Section 3.1.1.3 Weather hazards
- Global circulation and ITCZ: Met Office: Global circulation patterns, Met Office: Intertropical Convergence Zone
- Tropical-cyclone formation and structure: Met Office: Development of tropical cyclones, Met Office: Tropical cyclone facts
- Tropical cyclones and climate uncertainty: Met Office: Tropical cyclone facts and climate-change discussion
- Haiyan impacts and health response: World Health Organization: Typhoon Haiyan (Yolanda)
- Haiyan wind estimate: World Meteorological Organization: State of the Climate in Asia 2016
- Haiyan surge, evacuation, mangroves and recovery: UNDRR: Ten years after Haiyan, UNDRR: Tacloban lessons on warning and evacuation
- Haiyan recovery finance and community infrastructure: World Bank: Reconstruction after Typhoon Haiyan
- Somerset land, flood extent and current management: Environment Agency: Somerset Levels and Moors flood-risk reduction
- Somerset winter 2013–14 operational response, pumps, isolation and action plan: Environment Agency: Managing flood and coastal erosion risk, 2013–14
- Somerset dredging and residual risk: Environment Agency: 8 km Parrett and Tone dredge, Somerset Council: Bridgwater Tidal Barrier Scheme
- Causes of winter 2013–14 UK rainfall and attribution: Met Office: What caused the record UK winter rainfall of 2013–14?, Met Office: State of the UK Climate 2014
- Recent UK example, Storm Babet: Met Office: Storm Babet event summary, Scottish Government: Storm Babet impacts
- UK climate evidence: Met Office: State of the UK Climate
- Case-study totals depend on reporting date, event boundary, geographic area and category. Use the example taught by your school, especially if it requires a UK event more recent than Somerset 2013–14.