 FoxChild@Learn
5. Ecosystems
Curriculum status: Required core content.
This guide follows AQA GCSE Geography 8035, Section 3.1.2.1. It explains how living and non-living parts of an ecosystem interact, how energy and nutrients move, how to read a food chain and web, and how changes can affect a small UK ecosystem. It also introduces the broad distribution and characteristics of large-scale global ecosystems. The tropical rainforest and hot desert or cold environment chapters develop their own specification content in greater depth.
How to use this book
An ecosystem is best understood as a connected system, not as a list of species. Begin with a boundary: which place are you studying, at what scale, and over what period? Identify the abiotic conditions and living organisms. Trace the movement of energy and nutrients. Then explain how one change can affect other parts of the system.
The small-scale example in this guide is an illustrative UK pond. It is a model for how to investigate a natural system, not a claim that every pond contains the same species or has already been measured. A school or teacher may choose a woodland, dune, stream, grassland or pond instead. If you use a different site, replace the illustrative species and processes with evidence from that place.
The global section uses broad biome patterns. A biome is not a single ecosystem and its boundaries are not perfectly sharp. Climate helps explain broad distributions, but local relief, soils, water and human activity create variation within every biome.
Required knowledge
- Explain that ecosystems exist at different scales and include interacting biotic and abiotic components.
- Use producers, consumers, decomposers, food chains, food webs and nutrient cycling.
- Explain the balance between ecosystem components and the impact of changing one component.
- Give an overview of the distribution and characteristics of large-scale natural global ecosystems.
How the geography works
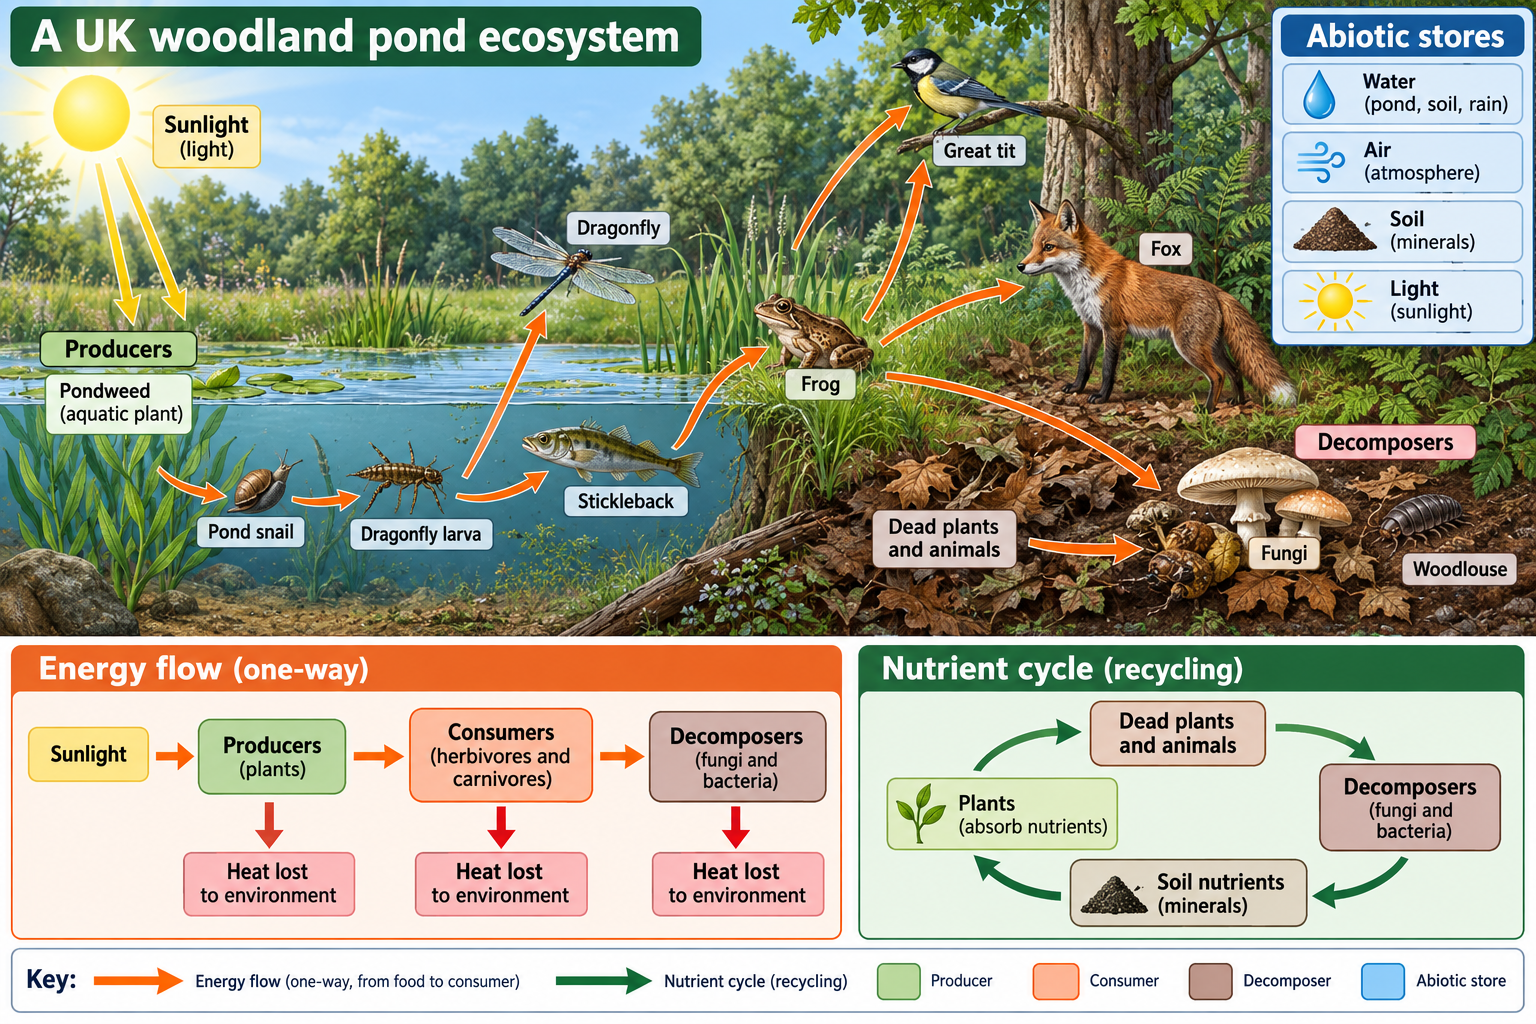
An ecosystem is an interacting system made up of living organisms and their physical environment. Sunlight is the main energy input for most ecosystems. Producers capture part of that energy through photosynthesis and store it in biomass. Consumers feed on producers or other consumers. Decomposers break down dead material and waste, returning nutrients to soil or water. Energy flows through the system and is gradually lost as heat; nutrients are transferred between stores and can be reused.
Abiotic conditions such as temperature, light, water, soil, oxygen and pH influence which organisms can survive. Organisms also change their surroundings: plants shade soil and slow wind, roots stabilise ground, and decomposers alter litter and soil. Interactions make the ecosystem dynamic. A change in one component can ripple through the food web, but the size and direction of the effect depend on what else is present, how connected the system is, and how quickly conditions change.
At a larger scale, patterns in temperature and precipitation help explain the distribution of biomes. At a smaller scale, a pond, wood or field margin contains local variation in depth, light, shelter and soil. Geography links those scales by asking how broad climate interacts with local physical conditions and with human use.
1. Ecosystems and geographical scale
An ecosystem is a community of organisms interacting with each other and with the non-living environment. The term can describe a tiny patch of moss on a wall, a pond, a woodland, a river catchment, or a very large region. Scale affects what is visible and what counts as a relevant process. In a small pond, a change in shade may matter over a few metres. Across a biome, broad temperature and rainfall patterns help determine vegetation and animal adaptations.
The boundary of an ecosystem is selected for a question. It may follow a shoreline, woodland edge, catchment divide, survey plot or habitat map. Natural flows often cross the chosen boundary. Water enters a pond from rain, groundwater and streams; birds and insects may move between habitats; seeds and nutrients can travel in wind or runoff. A boundary is a useful study tool, not necessarily a wall around a closed system.
Open systems
Many ecosystems are treated as open systems because matter and energy cross their boundaries. A system model helps organise evidence:
- Inputs bring energy or material into the system. Examples include sunlight, rainfall, wind-blown seeds and dissolved minerals in incoming water.
- Stores hold energy or materials for a time. Examples include living biomass, leaf litter, soil, water and stored organic matter.
- Transfers move energy or material between stores. Examples include feeding, litter fall, decomposition, runoff and nutrient uptake by roots.
- Outputs carry energy or material away. Examples include heat, water vapour, stream outflow, migrating animals and eroded soil.
Some school diagrams use a box to represent the ecosystem and arrows to show inputs, outputs and transfers. The diagram becomes more useful when each arrow is labelled with what is moving and in which direction. An unlabeled arrow does not explain a process.
The same item may be in different system categories at different times. A leaf is part of plant biomass while attached to a tree, becomes litter after it falls, and contributes dissolved nutrients to soil or water as it decomposes. Carbon and minerals move through the sequence, but the energy originally stored by photosynthesis is released as organisms respire and decomposers break down material.
Boundary and scale change the answer
Suppose the question is whether a pond receives nutrients. If the boundary follows the water’s edge, runoff from nearby land is an input. If the study area includes the whole catchment, that same movement may occur inside the larger system, while fertiliser arriving from beyond the catchment boundary is the input. Always make the study area clear before explaining system flows.
Scale also changes which time period matters. Light levels can change between morning and afternoon; pond temperatures vary seasonally; a woodland takes decades to mature; a biome boundary may shift over many generations. A one-day survey cannot show a long-term population trend. A useful account states the scale, place and time window.
2. Biotic and abiotic components
Biotic components are living parts of an ecosystem. They include plants, animals, fungi, bacteria and other microorganisms. Abiotic components are non-living physical and chemical conditions, including temperature, sunlight, rainfall, wind, soil, water depth, dissolved oxygen, salinity and acidity.
The distinction is useful, but biotic and abiotic components are connected. Plants need light, water, carbon dioxide and mineral nutrients. Their leaves provide food and shelter. Their roots take up water and nutrients, hold soil, and can create spaces used by other organisms. Animals pollinate flowers, disperse seeds, graze plants, prey on other animals and return nutrients through waste. Decomposers transform dead material. As organisms alter their surroundings, a biological process can change an abiotic condition.
Abiotic factors that influence organisms
Light provides energy for photosynthesis. Its intensity and duration vary with latitude, season, cloud, water depth and vegetation cover. Dense vegetation shades the ground. In water, light declines with depth and turbidity, so photosynthesis is often concentrated near the surface or in shallow margins.
Temperature affects the rate of chemical reactions, growth and activity. Very low temperatures can slow growth and freeze water; high temperatures can increase evaporation, cause heat stress and reduce oxygen dissolved in water. Organisms have different tolerances, so a temperature change may benefit some species while disadvantaging others.
Water availability affects plant growth, soil conditions and the activity of animals and microbes. Rainfall, evaporation, drainage, slope and permeability influence how much water remains available. In a pond, water depth and seasonal changes create different habitats from open water to the damp bank.
Soil provides anchorage, water and mineral nutrients for plants, and habitat for many organisms. Soil texture affects drainage and water storage; organic matter supplies nutrients and influences soil structure. Soil pH and chemistry affect which nutrients are available and which plants can tolerate the conditions.
Oxygen is needed for aerobic respiration. In water, dissolved oxygen can vary with temperature, mixing, photosynthesis and decomposition. Very low oxygen can stress or kill animals that depend on it. In waterlogged soils, oxygen may be limited, changing which decomposers and plants can function.
pH describes how acidic or alkaline water or soil is. It affects chemical reactions and nutrient availability. Species differ in their tolerance, so pH can influence the community composition.
Wind and exposure affect evaporation, pollination, seed dispersal, temperature and the physical stress experienced by plants. A sheltered pond edge may support different vegetation from an exposed bank.
These factors interact. A warm, sunny day can increase photosynthesis if water and nutrients are available. If water is scarce, the same warmth may increase water stress. High rainfall can replenish a pond but may also wash sediment and nutrients into it. Avoid explaining an organism’s distribution with only one abiotic factor unless the evidence supports that simplification.
Habitat, niche, population and community
A habitat is the place where an organism lives. Its ecological niche describes how it uses resources and interacts with other organisms and physical conditions. Two species can share a habitat but occupy different niches by feeding at different times, using different parts of a tree, or eating different food.
A population is a group of organisms of the same species in a place. A community is the populations of different species living and interacting there. A community changes through birth, death, migration, competition and environmental change. Ecosystems are not static collections; their populations fluctuate naturally.
Biodiversity can mean the variety of species, genetic differences within species and habitats or ecosystems in an area. A place with many species is not automatically stable in every sense, and species richness is only one way to describe biodiversity. The relationships among organisms and the condition of their habitats also matter.
3. Producers, consumers and decomposers
Producers
Producers make organic material from inorganic substances. In most ecosystems, green plants and algae use sunlight to turn carbon dioxide and water into sugars through photosynthesis. They store some of the captured energy in chemical form and provide the base of many food chains. In aquatic ecosystems, microscopic phytoplankton and larger aquatic plants can both be producers.
Photosynthesis can be summarised as:
carbon dioxide + water + light energy → glucose + oxygen
The equation is simplified: plants use glucose to build other substances, and photosynthesis depends on water, light, carbon dioxide, temperature and mineral nutrients. A factor in short supply can limit growth even when the others are abundant. For example, bright light does not guarantee high plant growth if the soil is dry or lacks a necessary nutrient.
Consumers
Consumers obtain energy and nutrients by eating other organisms or organic material.
- Primary consumers feed directly on producers; examples include a caterpillar eating a leaf or a tadpole grazing algae.
- Secondary consumers feed on primary consumers; a beetle larva may eat a caterpillar.
- Tertiary consumers feed on secondary consumers; a bird of prey may take a smaller predatory bird or mammal.
- Omnivores eat both plant and animal material, so they may occupy more than one feeding level.
The levels are simplifications. A species may eat different food at different life stages or seasons. A young amphibian may feed differently from an adult. A fox may eat plants, invertebrates and mammals. A food web shows these overlapping diets better than a single chain.
Decomposers and detritivores
Fungi and bacteria can act as decomposers. They break down dead plants and animals and organic waste, releasing mineral nutrients into soil or water. Decomposition depends on conditions such as moisture, temperature, oxygen and the chemical make-up of the material. Warm, moist, oxygenated conditions often support rapid decomposition, although the rate varies between substances and habitats.
Earthworms, woodlice and many other animals are detritivores: they feed on dead organic material and break it into smaller pieces. This can make it easier for fungi and bacteria to act on the material. Some organisms have more than one ecological role. A woodlouse consumes decaying leaves, while fungi and bacteria chemically decompose them.
Decomposition is essential to nutrient cycling. If nutrients remained locked in dead tissue indefinitely, plants would have less access to them. Decomposition does not create new atoms of mineral nutrients; it releases and transforms material so it can be taken up again. Nutrients can still leave a local ecosystem through runoff, erosion, harvesting or animal movement.
4. Food chains and food webs
A food chain represents one feeding pathway. Arrows point from the food to the organism that eats it, showing the direction in which energy and material are transferred. For an illustrative pond edge:
algae → water flea → small fish → kingfisher
The chain is a teaching model, not a complete account of any particular pond. A water flea may eat several types of algae; a small fish may feed on invertebrates; a kingfisher may take different fish. Other predators and prey are present, and organisms also compete.
A food web links multiple food chains. It shows that most species have several food sources and several potential consumers. Food webs can help predict where an effect might spread if one population changes. However, a diagram rarely includes every species, seasonal shift, movement or feeding interaction. Treat it as a model of selected relationships rather than a complete picture.
Trophic levels
A trophic level is a feeding position in a food chain. Producers occupy the first level. Primary consumers occupy the next; secondary consumers follow; and higher consumers may feed further up the chain. Omnivores can feed at more than one level.
Energy is transferred from food, but not all of it reaches the next trophic level. Organisms use energy in respiration and movement; some material is indigestible and leaves as waste; some organisms or body parts are not eaten; and some energy leaves as heat. Therefore, less energy is generally available to support biomass at higher trophic levels.
This helps explain why food chains are often short and why large predators need extensive prey populations. It does not mean that exactly ten per cent of energy passes between every trophic level in every ecosystem. Transfer efficiency varies by species, food quality, temperature, activity and other conditions. If a question supplies figures, calculate from those data rather than applying a memorised percentage.
Biomass and productivity
Biomass is the mass of living material in a place or at a trophic level. A biomass pyramid can show how the mass of organisms changes through feeding levels at a particular time. It is not the same as an energy pyramid, and the shape of a biomass pyramid depends on the organisms and how the measurements were made.
Primary productivity describes the rate at which producers create biomass. Growth is influenced by the amount of sunlight, temperature, water and mineral nutrients. High productivity can support more consumers, but the relationship is not a simple one-to-one rule. Consumers depend on habitat, food quality, seasonal timing and interactions with predators and competitors.
In a pond, a period of high algal growth can provide food for grazers. If nutrients become excessive, however, algal growth may become a problem rather than a benefit because dense algae can reduce light for submerged plants and decomposition can lower dissolved oxygen. The effect depends on the amount and type of nutrients, water circulation, depth, season and other conditions.
5. Nutrient cycling
Nutrients are chemical elements and compounds organisms need to grow. They include nitrogen and phosphorus compounds, as well as minerals such as potassium. Nutrients move between organisms and non-living stores. At GCSE level, the central idea is that plants take minerals from soil or water; nutrients move through feeding; and decomposition returns nutrients to the environment.
A simplified nutrient cycle includes these stores:
- Biomass: living plants, animals and microorganisms.
- Litter: dead leaves, wood, animals and organic waste on or in the ground.
- Soil or sediment: mineral nutrients, organic matter and decomposer organisms.
- Water: dissolved nutrients and organic material in ponds, rivers or groundwater.
Transfers include plant uptake, feeding, litter fall, death, waste, decomposition, dissolved transport and sedimentation. Weathering of rock can add mineral nutrients to soil or water. Runoff and erosion can remove them. Harvesting crops, clearing vegetation and drainage can alter the balance of stores and transfers.
Imagine a tree taking up dissolved nitrate through its roots. The nutrient becomes part of the tree’s leaves and wood. A caterpillar eats a leaf, and a bird eats the caterpillar. Waste and dead organisms return organic matter to the ground. Fungi and bacteria decompose it, releasing minerals that plants can take up. Some nutrients remain in soil; some are washed into a stream. This is a cycle with losses and inputs, not a perfectly closed loop.
Litter and decomposition
Leaf fall and deadwood create litter. Small animals fragment leaves and wood, while fungi and bacteria break down organic compounds. The nutrients released can be used by plants and microorganisms. The rate depends on the material: tough, chemically resistant leaves can decompose more slowly than softer material. Moisture, temperature and oxygen also affect the process.
In woodland, deadwood is not simply waste. It provides food, shelter and breeding habitat for many organisms while releasing nutrients as it decays. Removing all fallen wood may simplify the habitat and interrupt part of the nutrient cycle. On a managed site, some wood may be removed for safety or other uses, so a conservation plan weighs those goals against the ecological value of deadwood.
Nutrient loss and soil fertility
Nutrients can be lost from a site when dissolved material is carried away in runoff or when soil is eroded. Heavy rainfall on bare ground can move soil downslope. Leaching occurs when water carries soluble nutrients downward through soil. Harvesting removes nutrients stored in crops or timber. In contrast, decomposing litter and weathering can add nutrients to soil.
Fertility depends on the balance among these processes and on soil structure, acidity, organic matter, water and land use. A fertile soil is not merely one containing a high concentration of every nutrient. Some nutrients can be limiting, and excess nutrients entering a pond or river can damage water quality.
Place example
The illustrative small-scale UK ecosystem in this guide is a pond. It demonstrates interdependence, food webs, nutrient cycling and the effects of change. It is not a named or measured pond; use a school-selected ecosystem and its field evidence if your course specifies one.
6. A small-scale UK pond ecosystem
A pond is a useful example because it contains interacting land, water, air, plants and animals within a space small enough to observe. UK ponds differ in geology, shade, depth, water source, age, management and surrounding land. The species below are illustrative possibilities, not a checklist for every site. A real field study records what is actually present and avoids disturbing wildlife.
Abiotic conditions in and around a pond
Water depth creates variation. The centre may be deeper and receive less light at the bottom; shallow margins warm more quickly and allow emergent plants to grow. The bank may be damp rather than submerged. A shaded pond may receive less direct light than one in an open meadow.
Water temperature changes through the day and seasons. Warmer water generally holds less dissolved oxygen than cooler water. Wind can mix surface water and influence evaporation. Rainfall changes water level and can bring sediment or nutrients from nearby ground. Inflow and groundwater may supply water and dissolved minerals; an outlet can carry them away.
The surrounding land affects the pond. Trees and hedges provide shade, leaf litter and habitat links. A paved surface may speed runoff; a grass margin may trap some sediment. A nearby road, field or garden can affect pollution and nutrient input. These are hypotheses to examine with site evidence, not assumptions to state as facts.
Living components and feeding relationships
Producers can include algae, microscopic phytoplankton, submerged pondweed and emergent plants such as rushes or reeds where conditions suit them. They use light to photosynthesise and provide food or shelter. Invertebrates may graze algae, feed on detritus or hunt other invertebrates. Tadpoles may graze algae or organic material; their diets vary by species and development stage.
Small fish, amphibians, water beetles, dragonfly larvae and birds may act as consumers, depending on pond size and local conditions. A heron or kingfisher can feed on fish or amphibians. A food web would show several possible paths, for example:
- algae and aquatic plants support grazers and plant-eating invertebrates;
- grazers are food for predatory insect larvae, fish or amphibians;
- predatory invertebrates and small vertebrates can be eaten by larger fish or birds;
- dead plants and animals enter the detrital pathway and are broken down.
Do not infer a species is present from a textbook diagram. A survey should use a field guide and record identification confidence. Some organisms are microscopic; others are active only in certain seasons or times of day.
Interdependence
Interdependence means that components rely on or affect one another. Plants depend on light, water and nutrients, but also create shade, shelter and leaf litter. Grazers depend on producers for food and may influence plant abundance. Predators affect prey populations, while prey availability can influence predator survival and breeding.
Decomposers link the living and non-living components by returning nutrients to water or sediment. If decomposition consumes oxygen in a small, still body of water, oxygen conditions can affect fish and invertebrates. The process may be stronger when large amounts of organic material decompose rapidly. The outcome depends on pond depth, mixing and temperature.
The links are not always straightforward. If one prey species declines, a predator may switch to another food source. If a plant grows more densely, it may provide more shelter but shade other plants. A food-web relationship is therefore a route through which change could spread, not a guarantee that a particular population will change by a fixed amount.
Nutrient cycling in the pond
Mineral nutrients may enter with inflowing water, weathering, leaf litter or animal waste. Aquatic plants and algae absorb dissolved nutrients and incorporate them into biomass. Grazers consume producers; predators consume grazers. When organisms excrete waste or die, organic material enters the sediment or water. Bacteria and fungi decompose it, releasing nutrients that producers may reuse.
Some nutrients settle into bottom sediment and may remain there for a long time. Disturbance can resuspend sediment. Nutrients can leave through an outlet, seep into groundwater, or be carried out with harvested plants or animals. Nutrients can also accumulate if inputs exceed the rate at which they are taken up, buried or exported. This is why a pond’s catchment matters: activities beyond the shoreline may influence the water.
How a change can affect the pond
Consider increased nutrient input from fertiliser or waste. More nutrients may allow algae to grow rapidly. A dense algal bloom can block light from submerged plants; some algae may also create water-quality problems. When large amounts of algae die, decomposers use oxygen as they break down the material. Lower dissolved oxygen can stress or kill fish and invertebrates. The result may be a shift in the community, not simply “more plants”.
This chain is conditional. Not every nutrient increase causes a severe bloom. Water movement, depth, season, nutrient type, sunlight and grazing all influence the response. An answer should use words such as “may” when a mechanism depends on local conditions, and it should identify what evidence would test the explanation.
Other changes can also spread:
- Shade increases: less light may reduce some aquatic plant growth; cooler water and new shelter conditions may favour different organisms.
- Water level falls in a drought: shallow margins shrink, water warms, concentration of dissolved substances may change and habitat is lost.
- Sediment input rises: water may become more turbid, reducing light; sediment can cover eggs or habitat at the bed.
- A predator population falls: some prey may increase, potentially changing grazing or pressure on other prey.
- The pond is drained or filled: aquatic habitat and its food web are removed, and water storage and local drainage change.
- An invasive non-native organism arrives: it may compete, prey on native species or alter habitat, although the effect varies by species and place.
Balance, resilience and change
The “balance” of an ecosystem does not mean that every population remains exactly constant. Numbers fluctuate with seasons, weather, reproduction and predation. Balance refers to how components and processes interact over time. A system may absorb a small disturbance and recover; repeated or rapid pressure may push it into a different state.
Resilience describes a system’s ability to absorb disturbance while retaining important structures and functions. A pond with several plant species and connected habitats may have more recovery pathways than an isolated pond with few species, but species count alone does not measure resilience. Water quality, habitat condition, surrounding land use and the nature of the disturbance also matter.
A change can produce a feedback. If plants are removed from a bank, exposed soil may erode into the pond; increased sediment may reduce light for plants; fewer roots then hold less soil in place. This is a reinforcing pathway. Conversely, healthy plants can slow runoff and trap sediment, reducing the pressure on water quality. A feedback explanation should make clear whether the first change is amplified or reduced.
7. Global ecosystems and biome distribution
A global ecosystem in the AQA specification refers to a very large ecological area with characteristic plants and animals adapted to its environment. The term biome is often used for these broad regions. Biomes are not drawn with perfectly sharp lines. They form broad patterns across continents, while altitude, aspect, ocean currents, soils, fire and human land use create local differences.
The distribution of major terrestrial biomes is strongly related to temperature and precipitation. These factors influence growing seasons, water availability, soil development and vegetation structure. Plants are especially useful indicators because they are stationary and respond to long-term conditions. Animals often depend on plants for food or shelter, but also migrate or adapt behaviourally.
The role of latitude and atmospheric circulation
Latitude affects the angle and duration of incoming sunlight. Near the Equator, high solar energy and rising moist air help produce warm, wet climates in many regions. Around the subtropics, descending air is commonly dry, contributing to the broad belt of hot deserts. Farther poleward, energy is lower and seasons are more pronounced. In high latitudes, long cold winters and short summers limit plant growth.
These are broad tendencies, not rules that predict every local climate. Ocean currents, prevailing winds, mountains and distance from the sea alter temperature and rainfall. A mountain can create wetter conditions on its windward slope and drier conditions on its leeward side. A coastal location may have a smaller annual temperature range than an inland location at the same latitude.
Tropical rainforest
Tropical rainforests occur mainly near the Equator, where warmth and rainfall are high through much of the year. Dense vegetation, many species and several layers of plant growth are common characteristics. The physical and human systems of rainforest are studied in detail in the next chapter. For the global overview, remember the broad link: warmth and available water support high plant growth, while soils and nutrient stores depend on rapid biological cycling.
Rainforest does not occupy every equatorial location. Some areas have seasonal drought, different soils, high elevation or human land cover. The biome map is therefore a broad guide, not a precise land-use map.
Tropical grassland and savanna
Savanna ecosystems are common in tropical regions with a distinct wet season and dry season. Grasses may dominate, with trees and shrubs scattered where water, fire, grazing and soils allow. Many plants and animals are adapted to seasonal water availability. Fire can be a natural ecological process, but its frequency and intensity can be altered by people.
Savanna should not be thought of as degraded rainforest. It is a distinct ecosystem with its own climate, plant communities, animal relationships and management issues. Rainfall seasonality, soil and land use all influence the local pattern.
Hot deserts
Hot deserts are concentrated around subtropical latitudes but also occur in continental interiors and rain-shadow locations. Precipitation is low and unreliable, evaporation is high and vegetation is sparse compared with wetter biomes. Plants and animals show adaptations to water scarcity and heat. Desert environments are developed in the optional hot-desert chapter. In a global overview, connect sparse biomass to limited water while recognising that desert ecosystems can still contain specially adapted life.
Deserts are not all identical. Some are coastal, some high-altitude or continental; temperatures and rainfall seasonality differ. A desert map does not imply that the entire area is bare sand. Rock, gravel, salt flats, seasonal streams and vegetated patches can all occur.
Mediterranean woodland and shrubland
Mediterranean-type ecosystems occur on western sides of continents in subtropical latitudes, including around the Mediterranean Sea and in parts of California, central Chile, South Africa and south-western Australia. They tend to have hot, dry summers and mild, wetter winters. Shrubs and trees may have adaptations such as small or waxy leaves and deep roots. Drought and fire influence the landscape, while farming, settlement and tourism add human pressures.
The name describes a climatic pattern, not only the area around the Mediterranean. Similar conditions occur in other world regions. The pattern also varies with elevation and local exposure.
Temperate deciduous woodland and mixed forest
Temperate deciduous forests occur in parts of western and central Europe, eastern North America and East Asia, where rainfall is often spread through the year and seasons are distinct. Many broadleaved trees shed leaves during colder or drier periods, reducing water loss and physical damage. Mixed forests include both broadleaved and coniferous species.
Fertile soils and moderate climates have supported dense settlement and farming, so much original woodland has been cleared or fragmented in some regions. Remaining woods vary in age, species, management and connectivity. A modern land-cover map may therefore show a mosaic rather than uninterrupted forest.
Temperate grassland
Temperate grasslands are found in continental interiors, including prairies, steppes and pampas. Seasonal temperature differences can be large, rainfall is usually lower than in many forests, and grasses dominate. Deep roots can store nutrients and survive seasonal conditions. Fertile soils have encouraged extensive agriculture, so natural grassland is often heavily altered.
The regional names refer to different places and histories; do not assume they have exactly the same species, rainfall or soil. Farming can replace native vegetation and change the habitat, water balance and nutrient cycle.
Boreal forest and taiga
Boreal forest, or taiga, forms a broad belt across high northern latitudes in North America and Eurasia. Long cold winters, short growing seasons and coniferous forests are common. Needle-like leaves and evergreen growth can help some conifers function in cold conditions, while animal activity and migration respond to seasonal change. Peatlands and lakes may be important parts of the wider landscape.
Temperature, soils, fire, insects and forestry affect the boreal system. A map of tree cover does not show whether a forest is old, recently burned, managed or fragmented. The same biome label can contain different local ecosystem conditions.
Tundra and polar environments
Tundra occurs at high latitudes and above the tree line on some mountains. Very low temperatures, short growing seasons and often waterlogged summer soils limit tall tree growth. Low vegetation such as mosses, lichens, sedges and dwarf shrubs is common. Permafrost, where present, influences drainage and soil processes.
Polar ice sheets and cold deserts contain very limited plant growth, though life persists in marine, ice-free and microbial environments. The boundary between tundra, boreal forest and polar conditions varies with latitude, altitude and exposure.
Mountains and altitude
Mountain environments occur across climate zones. Temperature generally falls with elevation, while precipitation and vegetation change with altitude and slope aspect. A mountain can contain several habitat zones over a short horizontal distance. This makes altitude a useful way to observe how physical conditions influence ecosystems.
Mountain ecosystems should not be forced into a single global biome category. A mountain in a tropical region and one in a temperate region begin with different climates and species; altitude interacts with latitude, relief and local moisture.
Freshwater and marine systems
Freshwater ecosystems include rivers, lakes, ponds, wetlands and streams. Their conditions vary with flow, depth, temperature, sediment, oxygen and nutrient input. Rivers connect catchments: material from upstream can affect downstream habitats. Wetlands can store water, support species and slow some flows, although their role depends on habitat condition and landscape position.
Marine ecosystems include open ocean, coastal margins, estuaries, seagrass, kelp forests and coral reefs. Salinity, depth, light, currents, temperature and nutrients influence marine life. The AQA global ecosystem overview focuses on large natural ecosystems; water systems remind us that a terrestrial biome map is only one way to classify ecosystems.
Reading a global biome map
Use the title, key, projection and date. Ask whether the map shows potential natural vegetation, current land cover or broad climate zones. Many maps show simplified dominant biomes; they can hide urban areas, agriculture, mountain zones and transitions. The shape of continents is distorted by map projections, so visual area comparisons may be misleading.
When you explain a distribution, connect a pattern to a process:
latitude and circulation → temperature and rainfall → growing season and water availability → vegetation structure → animal habitat and food.
Then add local variation: soil, relief, fire, ocean influence, disturbance and people. This produces a more accurate explanation than saying that a biome exists simply because it is at a particular latitude.
8. How changing one component affects a system
When one component changes, trace the pathways through the rest of the ecosystem. Identify whether the changed component is biotic or abiotic, whether the change is an input, transfer, store or output, and which organisms depend on it. Then consider feedback, recovery and scale.
A simple prediction framework
Use these steps:
- State the initial change precisely. For example, “dissolved nutrient input to a pond increases” is more precise than “pollution happens”.
- Identify the first component or process affected, such as algal productivity or light reaching submerged plants.
- Follow at least two links through the food web or nutrient cycle.
- Explain whether the change may be temporary, seasonal or long-term.
- Consider other conditions that could strengthen or weaken the effect.
- Identify evidence needed to test the prediction.
Remove a producer
If a producer declines, less food energy may enter that part of the food web. Primary consumers that depend strongly on it may decline or switch food sources. Predators may then face reduced prey availability. But an effect may be limited if other producers or prey can replace it. A food web’s structure and species flexibility influence the outcome.
Remove or reduce a predator
If a predator declines, some prey may increase. More grazers may reduce plant biomass, which can alter shelter, light and nutrient uptake. The effect is not guaranteed: prey may be controlled by another predator, disease, competition or food supply. A trophic cascade is a sequence of effects that spreads through feeding levels, but evidence is needed before labelling every chain of changes as a cascade.
Change an abiotic factor
If water depth falls, shallow and deeper habitats change in different ways. A pond may warm more quickly, expose sediment and lose habitat for organisms that need deeper water. Some plants may expand in newly shallow areas while other species decline. Rainfall, shade, inflow and the duration of low water affect the response.
If temperature rises, metabolism and decomposition may speed up within a species’ tolerable range. However, warmer water holds less dissolved oxygen, so animals may become stressed even as biological activity increases. A single abiotic change can therefore create both positive and negative effects.
Introduce a new species
An introduced species is not automatically invasive or harmful. It becomes a concern if it spreads and has significant effects on native species, habitats or people. A new predator may consume native prey; a fast-growing plant may shade others; a disease may affect species with little resistance. The actual effect depends on ecological relationships and management.
Disturbance, succession and recovery
Ecosystems can recover after disturbance through regrowth, recolonisation and changes in species composition. A cleared patch may be recolonised first by fast-growing plants, followed by shrubs and trees if conditions allow. This sequence is called succession. AQA’s ecosystems overview does not require a detailed succession model, but the idea helps explain how an ecosystem can change over time.
Recovery depends on the size and duration of disturbance, remaining seed sources, soil condition, dispersal, water, climate and further human use. A pond restored after pollution may not return to exactly the same species composition if nearby habitats have changed or a new species has arrived.
9. People and ecosystem services
People depend on ecosystems for food, timber, freshwater, fuel, materials, recreation and cultural meaning. Ecosystems also regulate processes such as water flow, soil formation, pollination and climate, and support other ecological processes. These benefits are often called ecosystem services. The idea can help explain why a habitat matters to people as well as to wildlife.
The categories are commonly grouped as:
- Provisioning services: material outputs such as crops, fish, timber and freshwater.
- Regulating services: processes such as carbon storage, pollination, water purification and flood regulation.
- Cultural services: recreation, learning, identity, spiritual value and landscape enjoyment.
- Supporting processes: processes such as soil formation and nutrient cycling that underpin other services.
These categories overlap and should not imply that every part of nature has a simple monetary price. A wetland may provide habitat, store water, support recreation and hold cultural value at the same time. A decision that protects one service may damage another. For example, draining a wetland may create land for construction but reduce habitat and water storage.
Ecosystem services can also be distributed unequally. A downstream town may benefit from upstream woodland reducing some rapid runoff, while the landowner bears the cost of changing land management. A park can improve health and cooling but may be less accessible to residents without safe routes or free entry. Ask who benefits and who carries costs.
10. Investigating a small ecosystem
Fieldwork can test relationships, describe variation and compare sites. It cannot capture every organism or prove a cause from one observation. A good investigation begins with a focused geographical question and uses a method suited to the question.
Possible questions include:
- How does plant cover vary from a pond edge to the water margin?
- Does the number of visible invertebrate groups differ between shaded and open pond margins?
- How does light intensity vary around the edge of a small woodland?
- Is leaf-litter depth associated with the type of ground vegetation in two woodland areas?
These are examples, not a requirement to use any particular site. A question should specify the place, variables and comparison. “What lives here?” can be a useful first survey, but it is too broad for a test of a specific relationship.
Sampling plants with quadrats
A quadrat is a square frame used to define a sample area. A student can identify plant species, estimate percentage cover or count individuals within each quadrat. The method works best for stationary organisms or ground cover; it is not suitable for counting mobile birds accurately.
Place quadrats at random locations if you want an unbiased estimate of the whole study area. Random coordinates can be generated along two measured lines. If the question concerns a gradient, place quadrats at fixed intervals along a transect. Systematic spacing shows change along the line, but may match a repeating pattern by chance.
Take enough samples to represent variation. One quadrat is rarely enough. Record the quadrat size, location, date, weather and method. Use the same species-identification guide and cover-estimation approach at every site.
Sampling change along a transect
A transect records change along a line. A line transect notes which species touch the line; a belt transect uses quadrats at intervals along the line. A pond-edge transect may run from dry bank to shallow water, but it should be placed safely and without damaging habitat.
The transect should represent the gradient being studied. If it crosses a footpath, a different soil or a patch of shade, those factors may also influence the pattern. Record them rather than assuming distance from the water is the only cause.
Investigating animals
Mobile animals are harder to sample because they move, hide and respond to observers. A timed observation, sweep net, kick sample or pitfall trap may collect different organisms and create different disturbance. Use methods that are safe, legal and approved by the teacher. Release organisms promptly and avoid handling protected or unfamiliar species.
Repeated observation at the same time of day and under similar weather can improve comparability. A zero count does not prove that a species is absent; it may have been hidden, inactive or outside the sampled area.
Comparing two sites
To compare a shaded and open pond edge, keep the sample area, number of quadrats, identification method and survey timing as similar as possible. Record differences such as water depth, nearby trees, bank management and recent rainfall. A simple table can show counts or percentage cover.
An association does not prove that shade caused a difference. The shaded site may also be deeper, cooler, more sheltered or less disturbed. To strengthen a causal explanation, collect information about alternative factors and compare several samples at each condition.
Ethics, safety and conservation
Fieldwork should not damage the ecosystem being studied. Avoid trampling vegetation, removing organisms unnecessarily, disturbing nests or contaminating water. Use gloves or tools where appropriate, follow site rules and wash hands after sampling.
Water edges can be slippery and deep; fieldwork needs supervision, a risk assessment and clear boundaries. Do not enter water unless the activity has been specifically assessed and approved. Avoid collecting personal information about visitors without a clear educational reason and permission.
Maps, data and evidence
Construct a food web
Start with a list of organisms observed or supplied in a question. Identify which are producers, consumers and decomposers. Draw arrows from each food source to the organism that eats it. Add several links, including omnivores where evidence supports them. A correct diagram may look less tidy than a single chain because real feeding relationships overlap.
Check that arrows point in the direction of energy transfer, not toward the food. A plant eaten by a caterpillar is shown as plant → caterpillar. Label the organisms clearly. If a species’ diet is uncertain, mark it as a possible link rather than presenting it as certain.
Interpret a quadrat table
Check whether the data show counts, frequency or percentage cover. Frequency is the proportion of quadrats in which a species appears; percentage cover estimates the area covered. These measures answer different questions. A single large plant may cover a lot of space but count as one individual.
Describe the pattern with evidence: “percentage cover of rushes was greater at the two wetter sampling points” is stronger than “rushes like water.” Then explain a possible mechanism and identify other conditions that may influence the result.
Interpret a biome map or climate graph
Use the map key and scale, and state whether it shows a broad biome zone or actual vegetation cover. For a climate graph, compare temperature and precipitation through the year. Rainfall total and seasonality both matter. Two sites can receive a similar annual rainfall but have different dry seasons, producing different water availability for plants.
Do not infer soil, species or exact productivity from climate alone. Soil history, relief, disturbance and land use influence local ecosystem patterns. A map suggests a relationship to investigate; it does not provide every causal detail.
Common misconception
An ecosystem is not a sealed container. Most ecosystems exchange energy and materials with the surroundings, and species move between habitats.
Energy and nutrients do not move in the same way. Energy enters mainly through sunlight, passes through organisms and is eventually lost as heat. Nutrients are transferred among biomass, litter, soil and water and may be reused, although some leave the local system.
A food chain is a simplified pathway, not a complete inventory. A food web may include many connections and seasonal changes. Arrows show what is eaten by what; they do not show an animal chasing its prey.
Decomposers do not create nutrients from nothing. They break down organic matter and release materials that may be reused by producers. Nutrients can still be washed out, eroded or removed in a harvest.
The largest organism is not necessarily the top consumer, and a predator does not always keep every prey population at a fixed level. Populations fluctuate and have multiple controls.
More nutrients do not always mean a healthier ecosystem. Excess nutrients may trigger rapid algal growth and reduce oxygen or light, harming some organisms.
A biome is not a single ecosystem. It is a broad regional classification; many different local ecosystems occur within it.
Key vocabulary
| Term | Meaning |
|---|---|
| Abiotic | Non-living physical or chemical part of an ecosystem |
| Adaptation | A feature or behaviour that helps an organism function in its environment |
| Biomass | Mass of living material in a defined area or trophic level |
| Biome | A very large ecological region with broad characteristic climate, vegetation and animal life |
| Biotic | Living component of an ecosystem |
| Community | Populations of different species living and interacting in a place |
| Consumer | Organism that obtains energy by eating other organisms or organic material |
| Decomposer | Organism, often a fungus or bacterium, that breaks down dead material and waste |
| Detritivore | Animal that feeds on dead organic matter and fragments it |
| Ecosystem | A community of organisms interacting with their physical environment |
| Food chain | A simplified sequence showing feeding links and energy transfer |
| Food web | Interconnected food chains within an ecosystem |
| Habitat | Place where an organism lives |
| Interdependence | Mutual or linked dependence among ecosystem components |
| Niche | How an organism uses resources and interacts with conditions and other species |
| Nutrient cycle | Movement of nutrients among organisms and environmental stores |
| Population | Organisms of the same species living in a defined place |
| Producer | Organism that makes organic material, usually using sunlight through photosynthesis |
| Productivity | Rate at which biomass is produced |
| Resilience | Ability to absorb disturbance while retaining important system functions or structures |
| Trophic level | Feeding position within a food chain or web |
Self-check
Try the questions from memory. Sketch a small diagram where it helps. In longer responses, explain the direction of each effect and support your reasoning with a place or data example.
- Define an ecosystem and give one example at a small scale and one at a large scale.
- What is the difference between a biotic and abiotic component?
- Give three abiotic factors that could influence organisms in a pond.
- Explain the difference between a habitat and a niche.
- What does an arrow in a food chain represent?
- Give one example each of a producer, primary consumer and decomposer in a pond.
- Why are food chains usually short?
- Explain the difference between energy flow and nutrient cycling.
- Describe two ways that nutrients can enter or leave a pond ecosystem.
- How does decomposition make nutrients available to plants?
- Explain one way temperature can influence dissolved oxygen in water.
- Trace two possible effects of increased nutrient input into a pond.
- Why might the effects of reducing a predator vary between two ponds?
- What is a trophic cascade?
- Name two limitations of a one-day species survey.
- How would you sample plant cover along a pond margin?
- Why should quadrats be repeated?
- What is the difference between random and systematic sampling?
- Name two factors besides shade that might explain differences between two pond edges.
- Describe the broad climate pattern associated with tropical rainforest.
- Why are hot deserts concentrated in broad subtropical belts?
- How does seasonal rainfall distinguish many savannas from rainforests?
- Give one reason a biome boundary may not match a latitude line.
- Explain one benefit and one limitation of using a biome map.
- Why is high species richness not a complete measure of ecosystem health?
Short answer guide
- An ecosystem is a community of organisms interacting with the physical environment; examples include a pond and the tropical rainforest biome.
- Biotic means living components; abiotic means non-living physical or chemical conditions.
- Any three such as light, water depth, temperature, pH, dissolved oxygen, soil or nutrient availability.
- Habitat is where an organism lives; niche describes how it uses resources and interacts with the environment and other species.
- It shows the direction in which energy and material move from food to the organism eating it.
- Producer: algae or pondweed; primary consumer: an organism grazing producers; decomposer: bacteria or fungi.
- Energy is lost at each transfer through respiration, heat, waste and uneaten material, so less is available at higher levels.
- Energy flows through organisms and leaves as heat; nutrients move between stores and can be reused.
- Rain, inflow, runoff or leaf litter may add nutrients; outflow, groundwater leakage, erosion or harvesting can remove them.
- Decomposers break down organic matter and release mineral nutrients into soil or water, where producers may take them up.
- Warmer water generally holds less dissolved oxygen; decomposition and respiration may also influence oxygen levels.
- More nutrients may increase algal growth; dense algae may block light; decomposition of dead algae can lower oxygen. The outcome depends on local conditions.
- Food webs, alternative prey, pond conditions, species and other predators may differ.
- A sequence of effects that spreads through different feeding levels after a change in a predator or other component.
- It may miss seasonal species, hidden or mobile organisms, and long-term change; one sample may not represent the whole site.
- Use repeated quadrats at measured intervals along a transect from bank to water, record percentage cover with the same method and note site conditions.
- Repeats capture spatial variation and make an estimate less dependent on one unusual sample.
- Random samples reduce deliberate placement bias; systematic samples follow fixed intervals and can describe a gradient but may align with a repeating pattern.
- Water depth, temperature, soil or sediment, disturbance, bank slope, recent rain, nutrients or wind exposure.
- Warm temperatures and high rainfall through much of the year, although local and seasonal differences occur.
- Descending air in subtropical high-pressure belts is often dry, limiting cloud and rainfall; local circulation and coastlines modify the pattern.
- Many savannas have a marked wet season and dry season; tropical rainforests are generally wet through much more of the year.
- Relief, ocean currents, prevailing winds, rain shadows and land cover modify conditions.
- It summarises broad patterns for comparison; it simplifies transitions and hides local variation, current land use and map-projection distortion.
- Health also depends on species identities, habitat condition, interactions, resilience and pressures; species count alone misses these.
Revision points
- Define the boundary and scale before describing system inputs, outputs, stores and transfers.
- Separate biotic and abiotic components, then explain how each affects the other.
- Draw food-chain arrows from food to consumer; use food webs to show overlapping relationships.
- State that energy flows and is lost as heat, while nutrients cycle among stores and may leave a local system.
- Explain how decomposers release nutrients and why excess nutrients can harm water ecosystems.
- For a change, identify the first affected component, trace linked effects, then consider feedback and local conditions.
- Describe global biome patterns through temperature and rainfall, then qualify them with relief, soils, circulation and human land use.
- In fieldwork, use repeat samples, consistent methods, site context and a clear question; correlation alone does not prove cause.
- Use observed species and supplied data for a real case study. Do not present an illustrative food web as a measured survey.
Curriculum alignment
- Curriculum coverage ID: aqa.3.1.2.ecosystems
- Related practice packs: gcse_geo_p1_physical_environment_june_2022, gcse_geo_p1_physical_environment_june_2023, gcse_geo_p1_physical_environment_june_2024, gcse_geo_p1_physical_environment_november_2020, gcse_geo_p1_physical_environment_november_2021
- Shared concept tags: ecosystems, food-webs, nutrient-cycles, biomes, interdependence, fieldwork
Sources and further reading
- AQA GCSE Geography 8035, Living with the physical environment: Specification content
- AQA: Subject-specific vocabulary for GCSE Geography
- Natural England: State of Natural Capital Report 2024
- Office for National Statistics: Habitat extent and condition, natural capital, UK
- DEFRA: Enabling a Natural Capital Approach guidance
- GOV.UK: How to benefit species and habitats in your woodland
- Woodland Trust: Deadwood and nutrient recycling
- GOV.UK: Natural Capital and Ecosystem Assessment programme
The pond and food-web examples are conceptual teaching models. Species, measured values and interactions should be checked against the actual site if you use local fieldwork.