 FoxChild@Learn
1. Natural hazards and risk
Curriculum status: Required core content.
This guide follows AQA GCSE Geography 8035. All themes in Section 3.1.1.1 are compulsory. The specific tectonic and weather hazard processes, named examples and management strategies are developed in Chapters 2 and 3. This chapter gives you the framework to compare those examples without assuming that the same physical event produces the same human impact everywhere. Any place described as a teaching model below is illustrative, not a claim about a real disaster.
Required knowledge
- Define a natural hazard and compare tectonic, atmospheric and hydrological hazards.
- Explain hazard risk through event characteristics, exposure, vulnerability and capacity to cope.
- Distinguish a hazardous process, a hazard event, an emergency and a disaster.
- Classify effects by their direct or indirect relationship to the event and by their social, economic and environmental consequences.
- Use evidence to compare impacts and explain why risk and recovery vary between places and groups.
- Explain how monitoring, prediction, protection, planning, preparedness, response and recovery can reduce different parts of risk while recognising their limits.
Key vocabulary
| Term | Meaning |
|---|---|
| natural process | physical process occurring in or on Earth or in the atmosphere, such as tectonic movement or rainfall |
| natural hazard | natural process or event that threatens people, property, livelihoods, services or environments |
| hazard event | particular occurrence of a hazard, with a location, time and set of physical characteristics |
| hazard risk | potential for harm or loss arising from the interaction of hazard, exposure, vulnerability and capacity |
| disaster | serious disruption when a hazardous event interacts with exposed and vulnerable people or systems and overwhelms their ability to cope |
| exposure | people, buildings, infrastructure, livelihoods or ecosystems located where a hazard may affect them |
| vulnerability | physical, social, economic or environmental conditions that increase susceptibility to harm |
| capacity to cope | skills, resources, institutions and relationships available to prepare for and manage adverse conditions |
| resilience | ability of a system, community or society to resist, cope, adapt, recover and learn after a hazard impact |
| magnitude | measure of the size or energy of a particular hazard process, defined in relation to the hazard type |
| intensity | strength or severity of an effect at a particular place, measured using a hazard-appropriate method |
| frequency | how often events of a specified kind occur within a stated place, period and definition |
| probability | likelihood of an event or defined outcome within a stated time period or set of conditions |
| return period | statistical average interval associated with a defined event threshold in a specified record or model; not a timetable |
| primary effect | direct impact caused by the hazard event itself |
| secondary effect | later or indirect consequence triggered or worsened by the primary event or disruption |
| immediate response | action during an event or soon afterwards to save lives and meet urgent needs |
| long-term response | action over weeks, months or years to restore services, livelihoods and infrastructure or reduce future risk |
| monitoring | systematic observation of conditions or signals associated with a hazard |
| prediction | forecast about a hazard's likely timing, location, path or severity; its precision varies by hazard and method |
| protection | measures that reduce the physical effects of a hazard on people, property or infrastructure |
| planning | land-use, building, evacuation, service and emergency arrangements designed to manage risk |
| preparedness | knowledge, training, supplies and coordination developed before an event so people can respond effectively |
| mitigation | action that reduces or limits adverse impacts; it may target hazard drivers or consequences, according to context |
| residual risk | risk that remains after prevention and protection measures have been applied |
| multi-hazard risk | risk from several hazards that may occur together, in sequence or cumulatively and interact |
| cascading impact | disruption that spreads from one damaged system or service to others |
How the geography works
A natural process does not automatically become a disaster. The physical event matters, but so does where it happens, who and what are in its path, how susceptible they are to harm, and what resources and institutions are available before, during and after the event. Risk can be reduced without stopping the natural process: a warning, safer building, accessible evacuation route or reliable emergency service can lower likely consequences. At the same time, risk can rise when people or assets move into hazard-prone locations, protection deteriorates, or existing inequalities limit the ability to prepare and recover.
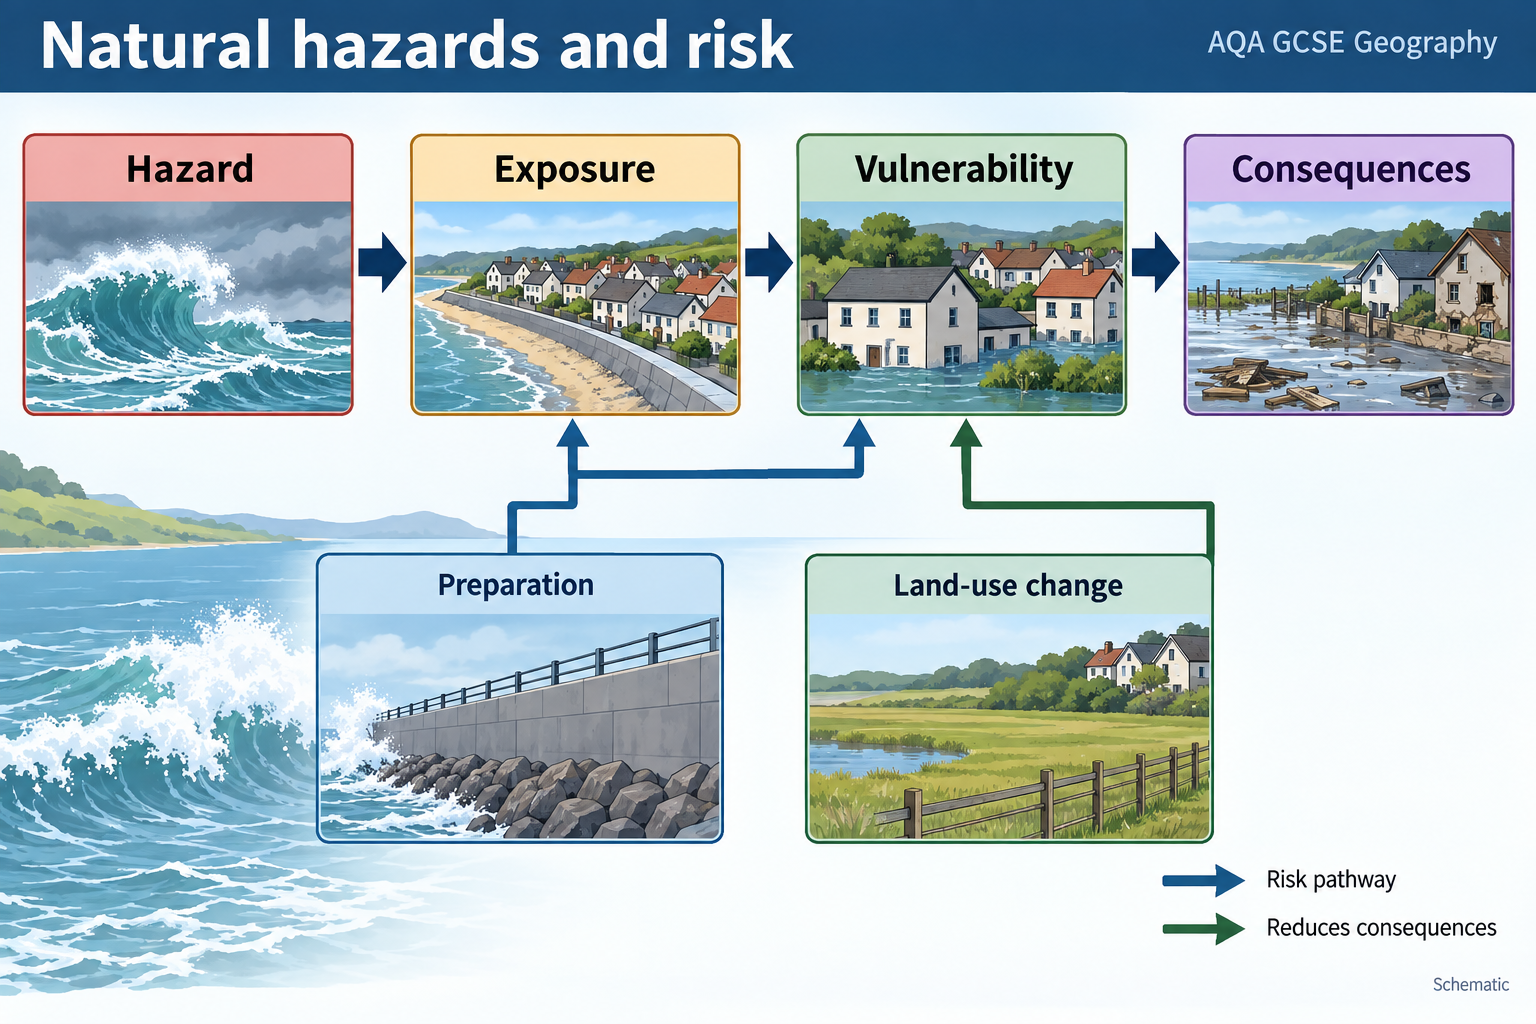
One helpful way to organise an answer is to trace four connected elements: hazard characteristics → exposure → vulnerability and capacity → likely consequences. This is a thinking framework, not a universal numerical equation. Different organisations define and calculate risk for different purposes, and the variables are not always reducible to one score. Explain the links in words, use evidence and state uncertainty.
1. Natural processes, hazards and disasters
From physical process to human consequence
Earthquakes, volcanic eruptions, tropical storms, heavy rainfall, river floods, heatwaves, drought and landslides are examples of natural processes that can create hazards. A process is not inherently a disaster. A powerful earthquake beneath an uninhabited area can release energy without causing direct human loss, although a tsunami or landslide could carry impacts elsewhere. A smaller event near a densely populated, poorly protected settlement may cause extensive disruption. The process establishes the physical possibility of harm; geography explains how that possibility meets society and place.
A natural hazard is commonly described in school geography as a natural event that threatens people or property. A wider disaster-risk definition also considers injury, health, livelihoods, essential services, the economy and the environment. The physical source can be geological, hydrological, atmospheric or biological. Some hazards cross these categories. A tsunami is triggered by processes such as an undersea earthquake, but its damaging movement is a water hazard along coasts. A landslide can be caused by gravity and geology but triggered by prolonged rainfall or an earthquake. Classification helps organise a topic; it does not mean hazards occur in isolation.
A hazard event has specific characteristics: where and when it occurs, how large or intense it is, how long it lasts, how quickly it begins, what area it affects, and whether it triggers other processes. A disaster describes the serious consequences when an event interacts with a society's exposure and vulnerability and disrupts its ability to function. The word “disaster” is not simply a synonym for a large natural event. It focuses attention on people, systems and the scale of disruption.
An emergency may be handled by existing local services and plans; a disaster can exceed available capacity and require broader support. There is no single magnitude threshold that turns an event into a disaster. The same storm category or earthquake magnitude can lead to different outcomes because building strength, settlement location, warning, population needs and access to help differ. Conversely, a moderate event can create a severe crisis if it hits a highly exposed, vulnerable system or compounds an existing emergency.
Types of natural hazard
For this AQA unit, tectonic and weather hazards receive detailed treatment in the next chapters. Across geography, hazards can be grouped by the physical processes that create them:
- Tectonic or geophysical hazards arise from processes within the Earth, including earthquakes and volcanic activity. Related coastal and slope hazards can follow, such as tsunamis, landslides and ash fall.
- Atmospheric hazards arise from weather and climate processes, including tropical storms, intense rainfall, heatwaves, cold spells, strong winds and drought.
- Hydrological hazards involve the movement or availability of water: river flooding, flash flooding, coastal flooding, storm surge and water scarcity. Rainfall, snowmelt, catchment conditions, tides and land use can interact.
- Geomorphological hazards involve landform processes such as landslides, rockfalls and debris flows. Their triggers may include rainfall, earthquakes, erosion or human changes to a slope.
- Biological hazards involve harmful organisms or vectors, for example disease outbreaks. They are included in broader hazard classifications, although the named hazard themes in this AQA chapter concentrate on tectonic and weather processes.
Categories overlap. A tropical storm is atmospheric but can produce rainfall, river floods, landslides and coastal surge. An earthquake is tectonic but can cause fires, dam failure, liquefaction or a tsunami. Where a chain of events affects another system, identify both the trigger and the resulting hazard rather than placing the whole event in one box.
When does an event become a disaster?
Consider a hypothetical earthquake under a remote desert plateau. If no people, infrastructure or ecosystems are affected, there may be a measurable geological event but little immediate human disaster. Now place a smaller earthquake beneath an urban district containing fragile buildings, hospitals, water pipes and crowded transport routes. Even if the shaking is weaker, collapsed structures may cause casualties and broken water mains may interrupt health care. The difference is not that the second event is “more natural”; it is that exposure and vulnerability are different.
The boundary between emergency and disaster depends partly on consequences and capacity. A town may recover from a flood using local resources; if the same flood cuts the only access road, disables power and prevents external assistance, consequences may spread. A useful geographical answer asks what was disrupted, for whom, at what scale, for how long, and whether normal services could manage the impacts.
The terms also depend on purpose. A news report may call an event a disaster based on immediate destruction, while an official dataset may apply a threshold for recording deaths or economic losses. Compare sources carefully. If two databases give different totals, check their definitions, cut-off dates, boundaries, missing data and whether they count direct or indirect impacts. A difference does not automatically mean one figure is fabricated; the measurements may answer different questions.
2. The geography of hazard risk
Hazard characteristics
The hazard component concerns the chance and physical nature of the event. Relevant characteristics can include probability, magnitude or intensity, duration, speed of onset, spatial extent, path, seasonality and the likelihood of secondary hazards. The useful measures depend on the process. Earthquake magnitude describes the earthquake source; shaking intensity varies between places. A storm's wind speed, rainfall, track, size and duration describe different aspects of the same system. For drought, duration, rainfall deficit, temperature, soil moisture and water demand may all matter.
Do not use one characteristic as a complete risk score. A high-magnitude event does not specify how many people are exposed or whether buildings can withstand it. A low-probability event can still require planning if its potential consequences are severe. A short event can have long effects when infrastructure is damaged; a slower-onset hazard can be serious because its gradual development is overlooked or because people lack alternatives. Compare like with like and explain what each measure represents.
Exposure
Exposure describes people, assets, activities or ecosystems located in an area where a hazard could affect them. A floodplain may contain homes, a school, a railway, farmland and a water-treatment plant. All are exposed in different ways. Population exposure changes by time: a city-centre street may be crowded in the afternoon and almost empty overnight. A seasonal resort may have a much larger visitor population in summer than resident population statistics suggest.
The number exposed can rise through urban growth, coastal development, transport investment or expansion onto a floodplain. This does not mean development is always irrational: the site may offer jobs, fertile land, a port or affordable housing, and the hazard may be infrequent. The geographical question is what choices and constraints shape the decision, who receives the benefits, who carries the risk, and what safeguards exist.
Exposure is spatial. A national average can hide a high-risk neighbourhood or a vulnerable facility. Maps of hazard extent, population, land use and essential infrastructure can help identify possible intersections. However, data are often aggregated to areas such as districts or census units. A polygon average does not show where each household is; an apparently low-risk average may conceal a small community in the most exposed location. Keep map scale and boundary choice in view.
Vulnerability
Vulnerability describes conditions that make people or systems more likely to be harmed. It can be physical, social, economic, environmental and institutional, and these factors interact.
- Physical vulnerability: buildings may be weak, poorly maintained or located in hazardous ground. Critical services may have no backup, and roads or bridges may have few alternatives.
- Social vulnerability: age, disability, illness, language barriers, social isolation or unequal access to information can affect warning, evacuation and recovery. These conditions do not make people inherently helpless; they indicate where systems must provide accessible support.
- Economic vulnerability: low savings, insecure work, lack of insurance or dependence on one livelihood can make it difficult to prepare, leave, repair and recover. Wealth varies within countries and neighbourhoods.
- Environmental vulnerability: degraded wetlands, deforestation, unstable slopes or loss of protective ecosystems may increase exposure or reduce natural buffering. Ecosystems can also be affected by an event and take time to recover.
- Institutional vulnerability: weak enforcement of building standards, unclear responsibilities, limited public trust or under-resourced services can impede preparation and response.
Vulnerability is not a label for a whole country or a fixed trait of an individual. It is shaped by circumstances, choices and institutions, and can change. A person may have strong local knowledge and social support but live in a building that is unsafe. Another may have a strong house but depend on a road that floods. Good analysis identifies the specific conditions rather than simply calling a place “vulnerable.”
Capacity to cope and resilience
Capacity includes strengths and resources people can use to manage risk. Examples include hazard knowledge, reliable warnings, evacuation transport, trusted local networks, accessible shelters, trained emergency teams, strong health systems, building regulations, contingency funds and safe infrastructure. Capacity exists before the event as well as during the response. A well-maintained drain or a community warning group may reduce harm without attracting attention when no disaster occurs.
Coping capacity and resilience are related but not identical in every use. Coping refers to managing an adverse event with available resources. Resilience is often used for the ability to resist, absorb, adapt, recover and learn. Recovery can restore the previous situation, but that situation may have contained high risk. A recovery plan can instead improve building safety, service access or land-use choices. However, “build back better” requires funding, consent, skills, suitable land and decisions about who pays and who benefits.
Capacity is uneven within a place. A warning is useful only if it reaches people in a language and format they can understand, arrives with enough lead time, and connects to a feasible action. An evacuation order is less effective for a household without transport or for a person who needs assistance, unless transport and accessible support are planned. A flood barrier can protect one area but transfer water or encourage development behind it. Evaluate the outcome and distribution of a strategy, not just its construction.
Putting the factors together
Risk is a potential for future harm, not simply the list of damage that has already occurred. The UN disaster-risk framework describes risk as a function of hazard, exposure, vulnerability and capacity. At GCSE, use the framework to explain relationships rather than memorising a formula as if it produced a precise universal answer. Different hazards have different measures, and physical and social factors cannot all be collapsed into one number without assumptions.
A clear chain might be: intense rainfall increases river levels; homes on the floodplain are exposed; some residents live in ground-floor accommodation and have no transport; warning access and evacuation capacity vary; therefore expected harm differs between households even within one settlement. Each link is geographically meaningful. To evaluate risk reduction, ask which link a proposed strategy changes: does it lower exposure, reduce vulnerability, strengthen capacity, protect assets, or change the hazard itself?
Risk is dynamic. It can increase when housing, infrastructure or population grows in an exposed area. It can fall when building standards improve, warnings reach more people, drainage is maintained or a community gains resources. Climate and environmental change can alter the frequency or intensity of some hazards, while economic change and migration alter who is exposed. A map or risk assessment is therefore time-specific: its date and assumptions matter.
3. Measuring hazard characteristics
Magnitude and intensity are different
Magnitude describes the size of an event at its source using a hazard-specific measurement. For an earthquake, magnitude scales estimate source size or energy; a particular earthquake has one magnitude estimate for a named scale and method, although agencies may report slightly different values as data and methods differ. Intensity describes the strength of effects at a particular location. Shaking intensity can vary with distance from the source, depth, local ground conditions and building response. One earthquake therefore has many local intensities.
This distinction matters because a map of earthquake magnitudes is not the same as a map of shaking, damage or deaths. A larger magnitude can release much more energy, but consequences depend on depth, distance, exposure and vulnerability. Compare magnitude values only when the scale type and source are clear. Do not say that an earthquake “measured a certain intensity at the epicentre” unless the evidence uses an intensity scale and location.
For a tropical storm, category scales may refer to a wind-speed range, not total rainfall, flood depth or overall damage. A storm of a lower wind category can still cause serious flooding through heavy rainfall, surge and prolonged exposure. A category can also change along a track, so state where and when it was recorded. Hazard classification helps comparison but should not replace a description of local impacts.
Frequency, probability and return periods
Frequency counts how often a defined event occurs in a stated period. Comparisons require the same threshold and recording method. “More floods” might mean more recorded flood days, more places flooded or more events above a chosen depth. Better monitoring can increase the number of events recorded even if the underlying process has not changed. An annual count can also fluctuate naturally, so a short run of years may not show a long-term trend.
Probability expresses likelihood under a stated set of conditions. A “1% annual probability flood” means a one-in-one-hundred chance in any particular year under the model assumptions; it does not mean one flood will happen every hundred years. The chance applies independently each year only under particular statistical assumptions, and actual risk may change as climate, river catchments, land use and protection change. Two such floods could occur close together, or none during a century.
A return period is a statistical way of describing the average interval associated with an event threshold in a record or model. It is not a schedule and does not ensure a quiet period afterwards. Ask what event size the threshold describes, what dataset or model underpins it, how uncertainty is handled and whether conditions are assumed to stay constant. A return-period figure is not the same as the number of years since a previous event.
Duration, speed of onset and spatial extent
Some hazards develop rapidly: earthquakes may begin with little warning; flash floods can rise quickly after intense rainfall. Others develop over hours or days, such as a tropical storm approaching a coast, or over months, such as drought. Speed of onset influences the type of warning, evacuation and preparation that may be possible. It does not tell us how serious the event will be: a slower event can affect many people for a long time, and a rapid event may be small in extent.
Duration refers to how long the hazard condition lasts, not necessarily the full recovery period. A heatwave may last several days, but health services can experience effects afterwards. A brief earthquake can trigger fires or disrupt water networks for months. Spatial extent describes the area affected, but a large footprint does not mean impacts are equal everywhere. Rainfall, slope, land cover, construction and service access can vary across that area.
A multi-hazard event can combine processes. Heavy rainfall can saturate slopes and contribute to landslides; an earthquake may damage a dam, creating downstream flood risk; storm surge can coincide with high tide and heavy river flow. Cumulative hazards occur when repeated smaller events affect a community before it has recovered from earlier losses. In an answer, identify the sequence and the systems affected, rather than listing every process as an unrelated event.
4. Effects and impacts
Primary and secondary effects
Primary effects are direct results of the hazard: buildings collapse during shaking, a storm's winds damage roofs, floodwater inundates fields, or ash covers roads. Secondary effects happen later or indirectly: water contamination after pipes break, disease risk where sanitation fails, businesses closing because transport is disrupted, or food prices rising after crops are lost. The same consequence can be primary in one event and secondary in another depending on the causal sequence; explain the link.
Separate the immediate physical effect from the wider chain. For example: intense rain raises river discharge; water overtops a bank and floods a road (direct physical effect); the closed road prevents workers reaching a hospital (cascading social effect); delayed treatment creates a further health consequence. A causal chain helps show why a seemingly local hazard can have effects well beyond the area directly flooded.
Immediate response means actions during or soon after an event, such as search and rescue, first aid, evacuation, temporary shelter, food, water and restoring critical access. Long-term response may include rebuilding housing, repairing utilities, supporting livelihoods, restoring ecosystems, improving warning systems or changing land-use plans. The timescales overlap: a temporary shelter may be needed for months, and planning for reconstruction can begin early.
Social, economic and environmental impacts
Social impacts affect people and communities: deaths, injuries, displacement, health, education, cultural sites, household security and social networks. Economic impacts include damage to homes and workplaces, lost income, interrupted trade, repair costs, public spending and insurance losses. Environmental impacts include contamination, erosion, habitat damage, water-quality change and effects on ecosystems. Categories overlap. A damaged water treatment plant is infrastructure loss and can create a social health effect; an estimate of rebuilding cost does not measure every cultural or ecological loss.
Impacts vary over time and space. A hazard may affect one district more severely because it is closer to the source or has weaker protection. Within that district, a hospital, school or care home may have different needs from a warehouse. The event can affect groups differently according to age, health, occupation, housing, language, mobility and access to money or networks. Avoid treating all residents as experiencing one identical outcome.
Loss data have limits. Direct economic damage is easier to price than unpaid care, cultural heritage, ecological loss or long-term mental health effects. A country with more expensive buildings can record higher monetary losses even if fewer people die. A place with limited reporting may show fewer recorded losses than actually occurred. Compare deaths, people affected, homes damaged, services disrupted and financial cost separately, and say how the figures were measured.
5. Why risk and recovery differ between places
Physical location and local conditions
The same hazard can affect different places differently because of topography, geology, soil, drainage, distance from the sea or source, vegetation and construction. Shaking can be amplified by soft sediment; flood depth varies with elevation and flow route; a steep slope may respond differently to rainfall than a gently sloping area. Local site conditions sit alongside regional event characteristics. A hazard map at national scale can show broad patterns but miss neighbourhood-level differences.
Settlement location is shaped by opportunity and constraint. A floodplain may provide flat land, water, transport routes or productive soils; a coast can support trade, fishing or tourism. People may remain in hazard-prone areas because of jobs, family, land rights, cultural attachment, housing cost or lack of alternatives. “They chose to live there” is not a complete explanation if a move is unaffordable or would end a livelihood. At the same time, people and governments make decisions that can raise or reduce future exposure.
Wealth, inequality and services
Income and resources influence construction, insurance, warning access, health care, transport and speed of repair, but wealth alone does not determine outcomes. A high-income country may have strong building standards and emergency services yet expose many people through dense development. A lower-income place can have effective local knowledge, community support and preparedness, while lacking funds for resilient infrastructure. Avoid ranking countries as if each person has the same vulnerability.
Inequality within a country is important. A wealthy household may live in a protected building with transport, savings and insurance, while a low-income household nearby may rent a poorly maintained home and depend on a daily wage. A national average for income or health says little about how that difference is distributed. Disaggregate evidence by neighbourhood or group where data allow; protect privacy and avoid stereotyping.
Some groups need additional support to receive warnings or evacuate, including young children, older people, people with disabilities, people who are unwell, visitors unfamiliar with the area, and those who do not receive messages in an accessible language or format. These are not fixed deficits in people: accessible services and inclusive planning can remove barriers. A good comparison explains both the barrier and the available support.
Governance and preparedness
Governance influences whether risk information becomes action. Authorities can enforce safe building rules, manage land use, maintain drains and protective infrastructure, coordinate emergency services and communicate warnings. Outcomes depend on funding, staff, public trust, coordination between agencies, access to information and whether rules apply in practice. A plan on paper does not show how well it is understood, maintained or resourced.
Preparedness includes public knowledge, drills, warning systems, evacuation plans, emergency supplies, trained responders and arrangements for health care, shelter and communications. Its effectiveness depends on lead time, trust and feasibility. A warning may be accurate but inaccessible; an evacuation route may be blocked; shelters may not accommodate all needs. Measure preparation by what people can actually do, not simply whether a document or siren exists.
A fair event comparison
A comparison should use events that are described with similar categories. A useful structure is: hazard type and physical characteristics; number and location of people/assets exposed; vulnerability and capacity before the event; primary and secondary impacts; immediate and long-term responses; and how far the evidence supports the comparison. State dates, units and sources, and recognise differences in reporting.
Do not compare only headline death totals and conclude that one country is “better prepared.” Event magnitude, depth, location, time of day, exposed population, building standards, warning time and measurement methods may differ. A fair answer can still make a judgement, but it should identify the strongest factors and explain what evidence would make the judgement more secure.
This chapter does not prescribe one pair of examples. Use the event case studies selected by your school in Chapter 2 for contrasting tectonic events and Chapter 3 for a tropical storm and a recent UK extreme-weather event. Keep the framework consistent when you compare them, but learn each event's verified dates, locations, figures and named responses separately.
6. Reducing risk before, during and after an event
Monitoring and prediction
Monitoring records conditions associated with hazards: seismic activity, volcanic gases, ground movement, rainfall, river levels, sea temperature or storm position, depending on the process. Monitoring can improve understanding and sometimes provide warning signals. It cannot guarantee exact prediction. Earthquakes, for example, cannot currently be predicted to an exact time, location and magnitude in the simple sense of a reliable timetable. A scientific forecast usually has uncertainty and should be interpreted with its definitions and time window.
Prediction and warning should not be confused. A forecast estimates what may happen; a warning communicates an assessment and recommends action. A useful warning needs a trusted source, clear language, an understood signal, coverage of the exposed area, sufficient lead time and a feasible protective action. Too many false alarms can reduce trust; missed warnings can increase harm. Communication plans should consider power failure, mobile network loss, language, disability and people without internet access.
Protection and land-use planning
Protection can include stronger buildings, flood barriers, drainage, shelters, safe routes, fire breaks, slope stabilisation or backup utilities. Each strategy targets particular consequences and has costs, maintenance needs and possible trade-offs. A barrier may reduce frequent flooding in one area but create residual risk if it is overtopped or fails. A building code may lower collapse risk but be less effective if poorly enforced, unaffordable or applied only to new buildings.
Land-use planning can avoid placing new homes, schools or critical services in the highest-risk areas, or require suitable design where development proceeds. Relocation can reduce exposure, but can disrupt livelihoods, cultural ties and access to work. Planning must consider alternatives and fairness: whose property is protected, whose is not, and who pays? A map is useful only if hazard boundaries, future conditions, population and planned development are represented as accurately as possible.
Preparedness, response and recovery
Preparedness turns plans into practical capability through training, drills, supplies, communication and coordination. Immediate response prioritises life safety and urgent needs; it may include rescue, medical care, water, food, temporary shelter and restoring access. Long-term recovery can rebuild infrastructure, reopen schools and health services, replace livelihoods, provide compensation and address future risk. The approaches are linked, and the distinction is about the main purpose and timing rather than a precise date.
Recovery is not experienced equally. People with savings, insurance, secure housing and supportive networks may repair more quickly. Renters, informal workers or those with health needs can face barriers even when public infrastructure is restored. Reconstruction can reduce risk through safer siting and standards, but it can also reproduce the same exposure if affordable land and support are unavailable. Ask who participates in decisions and who can return.
No strategy eliminates all risk. Residual risk remains because physical systems are uncertain, protection may fail, people can be exposed in unexpected ways, and resources are limited. Risk reduction therefore involves a portfolio of measures, maintenance, public understanding and the ability to respond when prevention is insufficient. A strategy should be evaluated against the hazard it addresses, people it protects, cost and maintenance, environmental effects, accessibility and possible transfer of risk elsewhere.
Place example
Worked risk assessment: a hypothetical coastal settlement
The following is an invented teaching scenario, not a real location or forecast. A coastal settlement has a low-lying harbour neighbourhood, a higher inland neighbourhood, a care home, a school, a road, a power substation and small businesses. A severe storm may coincide with high tide and heavy river flow. The storm is the hazard system; coastal water and river flooding are interacting processes.
Hazard characteristics: the relevant questions are the storm track and timing, wind and rainfall forecasts, tide conditions, likely surge, expected water depth and duration, and the uncertainty range. A single label such as “severe storm” is insufficient to estimate local consequences. The forecast should be checked as it changes, and a map should show the date and model assumptions.
Exposure: homes and businesses in the harbour area, the road and substation could be in the potential flood zone. The school and care home may be exposed depending on their exact elevation and access routes. The inland neighbourhood may have lower direct flood exposure but could still lose services if the substation or road is affected. Visitors and workers could increase daytime exposure beyond the number of residents.
Vulnerability and capacity: building condition, mobility, health needs, warning access, household transport, evacuation support, flood doors, backup electricity and the number of alternative roads affect expected consequences. The care home needs an accessible evacuation and continuity plan. A warning that relies only on a mobile app may not reach everyone. A reliable community contact network and transport arrangement can strengthen capacity.
Likely effects: direct floodwater may damage homes and stock, close the road and affect the substation. Secondary impacts could include power loss, disrupted care, closed shops, contaminated water or delayed emergency access. A dry inland home could still face indirect disruption if services depend on the low-lying infrastructure. These outcomes are possibilities for planning, not facts about an actual settlement.
Possible actions: planning could identify safe routes and temporary shelters; accessible warnings could reach residents, workers and visitors; protection might reduce frequent inundation; utilities could have suitable backup; and emergency teams could coordinate with the care home. A barrier alone would not solve the problem if access, electricity and residual flood risk remain unmanaged. A strategy should be tested against different storm paths and failure conditions.
Conclusion: risk is concentrated where flood pathways intersect with homes, critical services and limited evacuation choices. The inland area may have lower direct exposure but is not independent of the coast if it relies on the same road or power supply. The most useful response combines up-to-date monitoring, inclusive warnings, safe routes, infrastructure planning and targeted protection. The scenario shows how to reason from evidence; a real decision would require local data, community input and technical assessment.
Maps, data and evidence
Reading hazard maps and impact data
A hazard map may show past events, a modelled probability, a forecast track, a hazard zone or recorded impacts. These products answer different questions. Read its title, date, source, legend, scale, projection, boundary and definition. A map showing past earthquake epicentres does not directly show future probability or building vulnerability. A flood outline from one event does not show every possible flood depth. A forecast cone is an uncertainty range for a storm's centre path, not a map of the exact area that will experience damaging conditions.
Overlaying hazard and exposure information can reveal potential intersections: flood extent with homes, hospitals and roads; storm paths with population; or earthquake shaking with building types. But the output depends on data quality and scale. A national population grid can miss household-level differences. Boundaries can change. A model may omit informal housing or people temporarily present. State whether the map describes recorded, estimated, modelled or forecast information.
For tables, check the unit, period, denominator and count definition. “People affected” can include displacement, injury, livelihood loss or exposure depending on the source. “Damage” may refer to assessed buildings or an estimated monetary value. Fatality totals can change as missing people are identified. If two sources disagree, compare their definitions, update dates, geographical boundaries and methods before choosing a figure.
A useful event summary table can separate categories:
| Dimension | Questions to ask |
|---|---|
| Hazard | What process occurred? Where, when, how large or intense, and for how long? |
| Exposure | Which people, assets, livelihoods and services were in the affected area? |
| Vulnerability | What conditions increased susceptibility to harm? Were effects unequal within the area? |
| Capacity | What warnings, preparations, resources and response systems were available? |
| Impacts | Which effects were direct or indirect, immediate or longer term, social, economic or environmental? |
| Response | Which actions happened, who led them, who could access them and what changed? |
| Evidence | What is the source, date, unit, boundary and limitation of each figure? |
This structure helps prevent a case-study answer from becoming a list of statistics. Select a small number of accurate figures and explain what they demonstrate. One reliable measurement with context is more useful than several memorable but unverified numbers.
Common misconception
- “A natural event is automatically a hazard.” Without potential harm to people, property, livelihoods or environments, it may be only a physical event in the place considered. Effects can still travel to another exposed area.
- “A hazard and a disaster are the same thing.” A hazard describes potential threat; a disaster describes serious disruption arising through interaction with people and systems.
- “A bigger magnitude always causes more deaths.” Magnitude is only one event characteristic; exposure, vulnerability, local conditions and capacity shape human consequences.
- “A high-income country has no vulnerability.” Wealth can support protection and response, but exposure and inequality remain, and systems can fail.
- “A low-income country is always helpless.” Capacity, local knowledge and community networks can be strong; resource constraints and exposure vary within and between places.
- “Everyone in a disaster area is affected equally.” Needs and consequences differ with location, housing, health, income, age, mobility, work and access to information.
- “A one-in-one-hundred-year event happens once every century.” A return period describes a statistical average under assumptions, not a calendar.
- “A warning is enough to prevent harm.” It must reach people, be trusted and connect to an action they can take.
- “A flood defence removes risk.” It may reduce probability or impact for a design range, but residual risk remains and consequences can be transferred.
- “The costliest event is the most damaging overall.” Monetary losses do not measure every death, health impact, livelihood disruption, cultural loss or ecological effect.
- “One disaster proves that hazards are becoming more frequent.” Long-term claims need consistent records, definitions, time periods and suitable climate evidence.
- “Response begins only after impact.” Preparedness, monitoring and planning shape consequences before the event; recovery can also reduce future risk.
Self-check
- What makes a natural process a hazard in human geography?
- Explain the difference between a hazard event and a disaster.
- Name three broad types of natural hazard and give an example of each.
- Why can one event trigger a chain of different hazards?
- What does exposure describe?
- Give two physical and two social or economic factors that can affect vulnerability.
- How can local knowledge or community networks strengthen capacity?
- Why is risk better analysed as an interaction than as a single magnitude value?
- Distinguish earthquake magnitude from shaking intensity.
- Why does a return period not provide a timetable?
- How can a warning fail to reduce risk even when its forecast is accurate?
- Distinguish primary from secondary effects using a flood example.
- Give one social, one economic and one environmental effect that could follow a severe storm.
- Why might a national average hide important local differences in risk?
- What should you compare before accepting two sources' casualty figures?
- Name two strategies that reduce exposure and two that strengthen capacity.
- What is residual risk?
- How might a protective structure transfer or redistribute risk?
- In the hypothetical coastal settlement, why might the inland area still be affected?
- What makes an event comparison fair and geographically useful?
Self-check answers
- A process becomes a hazard when it may threaten people, property, livelihoods, services or environments in a particular place.
- A hazard event is a specific occurrence with physical characteristics; a disaster is serious disruption when that event interacts with exposure and vulnerability and overwhelms capacity.
- Tectonic: earthquake or eruption; atmospheric: tropical storm or heatwave; hydrological: river or coastal flood. Geomorphological hazards such as landslides are also valid.
- One process can trigger or intensify another: an earthquake may damage a dam or trigger a tsunami; heavy rain may trigger slope failure and floods.
- People, assets, livelihoods or ecosystems located where a hazard could affect them.
- Physical: weak construction and unstable ground; social/economic: limited transport, inaccessible warnings, illness, insecure income or lack of savings. Other justified examples are valid.
- Local knowledge can identify routes and needs; trusted networks can spread warnings, check on neighbours and connect people with support.
- Magnitude describes only one physical characteristic; risk also depends on who and what are exposed, their susceptibility and the resources available to cope.
- Magnitude measures event size at its source; intensity measures shaking at a particular location and therefore varies across the affected area.
- It is a statistical average associated with a threshold and assumptions. An event can occur sooner, later, more than once or not during the average interval.
- It may not reach people, be understood or trusted, arrive with enough time, or offer a feasible safe action.
- Floodwater entering homes is a direct effect; contaminated water, road closures, interrupted schooling or lost income can be secondary effects.
- Social: displacement or injury; economic: business damage or lost income; environmental: contaminated water, erosion or habitat damage.
- It averages across areas and groups, hiding exposed neighbourhoods, uneven building quality, different service access or people present only at certain times.
- Definitions, update dates, geographic boundaries, reporting methods and whether direct and indirect deaths or missing people are included.
- Exposure: land-use planning and relocation from highest-risk zones; capacity: accessible warnings and trained response teams. Many other examples are valid.
- The risk that remains after prevention, preparedness and protection measures.
- It may protect one community while redirecting floodwater, erosion or other impacts towards another place, or encourage development behind a defence that can still fail.
- It could depend on the same road, electricity supply, health service or shops as the coastal neighbourhood, creating indirect or cascading effects.
- Use comparable hazard definitions and event measures; include place, date, exposure, vulnerability, capacity, impact categories and source limitations; explain differences rather than attributing them to wealth alone.
Revision points
For a risk question, define the hazard and locate it; describe event characteristics; identify who and what are exposed; explain specific vulnerability and capacity factors; trace primary and secondary impacts; and evaluate how far management changes likely consequences. For comparisons, use consistent categories and dated evidence. Explain at least one causal link for each claim, distinguish measured data from interpretation, and avoid treating country income or event magnitude as a complete explanation.
Curriculum alignment
- Curriculum coverage IDs:
aqa.3.1.1.natural-hazards - Related practice packs:
gcse_geo_p1_physical_environment_june_2022,gcse_geo_p1_physical_environment_june_2023,gcse_geo_p1_physical_environment_june_2024,gcse_geo_p1_physical_environment_november_2020,gcse_geo_p1_physical_environment_november_2021 - Shared concept tags:
natural-hazards,risk,vulnerability,resilience
Sources
- AQA specification, compulsory content for the challenge of natural hazards: AQA GCSE Geography 8035, Living with the physical environment
- Definitions of hazard and disaster risk, including exposure, vulnerability and capacity: UNDRR: Disaster Risk Reduction Terminology
- Risk as a function of hazard, exposure, vulnerability and capacity: UNDRR: Disaster risk
- Definitions of susceptibility and capacity to cope: UNDRR: Vulnerability, UNDRR: Capacity
- Earthquake source magnitude and location-specific intensity: USGS: Difference between earthquake magnitude and intensity
- Named event figures and responses should come from the original scientific, government or humanitarian sources selected for the school’s case studies; dates, totals and impact definitions vary between datasets.