 FoxChild@Learn
4. Climate change
Curriculum status: Required core content.
This guide follows AQA GCSE Geography 8035, Section 3.1.1.4. It develops the evidence, natural and human causes, effects, mitigation and adaptation named by the specification. Case examples are teaching examples, not a required national list. Use the examples and statistics chosen by your teacher in assessed work.
How to use this book
Climate change is a large subject, but a clear chain of reasoning makes it manageable. Start with a claim: what is changing, where, over what time period, and how do we know? Explain a cause through a physical mechanism. Trace the consequences for people and environments. Then assess a response by stating what it changes, which groups benefit, what limits it, and whether it reduces causes or manages effects.
This chapter follows that sequence. The first part explains how scientists reconstruct Quaternary climates and recognise recent change. The second part compares natural drivers with human drivers. The third part explores impacts and unequal risk. The final part evaluates ways to reduce emissions and prepare for change.
Climate has changed throughout Earth history. That fact is compatible with the conclusion that present warming is mainly caused by people. To reason well, compare the rate, timing, physical evidence and known causes of different episodes. A past explanation should not be transferred to the present without checking whether it fits the evidence.
Required knowledge
- Describe evidence for climate change from the beginning of the Quaternary period to the present.
- Explain possible natural causes: orbital changes, volcanic activity and changes in solar output.
- Explain human influences, including fossil-fuel use, agriculture and deforestation.
- Describe effects on people and the natural environment.
- Distinguish mitigation, which reduces the causes of climate change, from adaptation, which reduces harm from actual or expected effects.
- Explain examples of mitigation: alternative energy production, carbon capture, planting trees and international agreements.
- Explain examples of adaptation: changing farming systems, managing water supplies and reducing risks from sea-level rise.
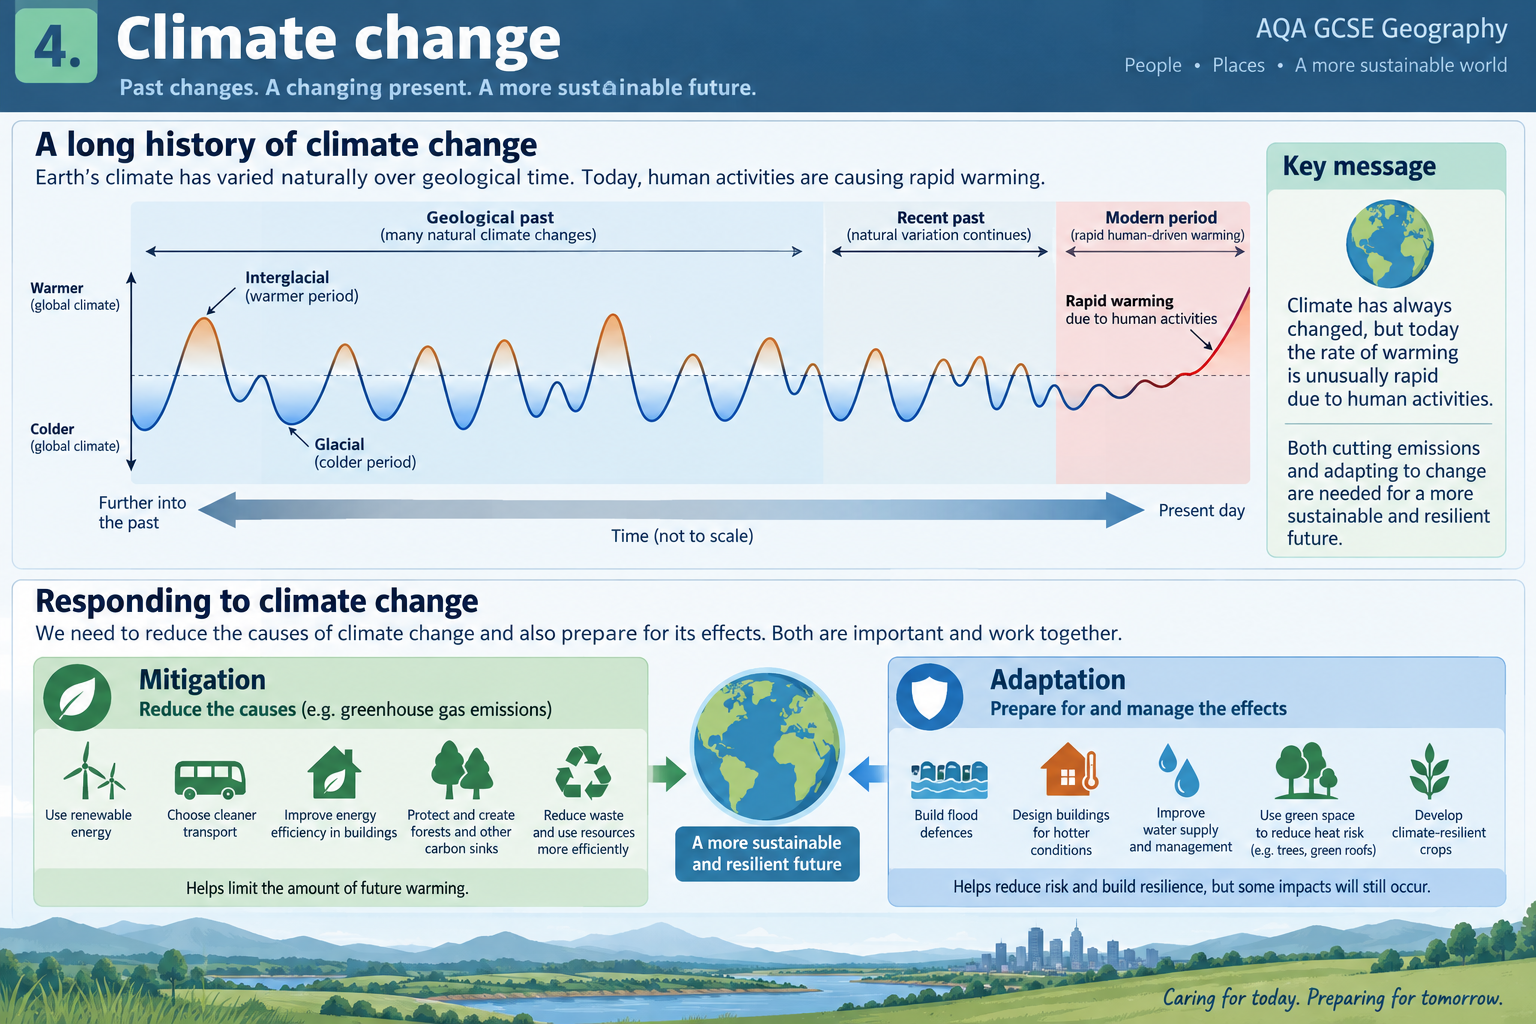
How the geography works
Climate change is explained by connecting a driver to a physical process and then to a place. A change in incoming sunlight, reflected energy or greenhouse-gas concentration changes the climate system’s energy balance. Atmosphere and oceans redistribute that energy; ice, vegetation, soil and water respond over different timescales. The resulting temperature and rainfall changes affect people and ecosystems through exposure and vulnerability.
For the Quaternary, slow changes in Earth’s orbit altered where and when sunlight reached the surface. Ice-albedo and greenhouse-gas feedbacks helped turn relatively small seasonal changes into large glacial cycles. In the present industrial era, human activity is adding greenhouse gases much faster than natural orbital cycles operate. Multiple observations support this attribution; natural variability still changes the year-to-year pattern.
Responses address different links in the chain. Mitigation reduces emissions or strengthens carbon storage, limiting future forcing. Adaptation changes buildings, services, livelihoods or ecosystems so that they cope better with impacts. Neither removes every risk: mitigation takes time to influence the climate system, while adaptation can become expensive or reach physical and social limits. The strongest explanations state the mechanism, timescale, place and people affected.
1. Climate, weather and timescale
Weather is the state of the atmosphere over a short period at a particular place: for example, the temperature, wind, cloud and precipitation on a particular day. Climate is the long-term pattern and range of weather, usually described using several decades of observations. A cold winter does not disprove a warming climate, just as one hot day does not prove it. The important evidence is a pattern across a sufficiently long time, compared with a clear baseline.
Climate is not just mean temperature. It includes average and extreme rainfall, wind, snow and seasonal patterns, as well as ocean conditions, ice and the timing of biological events. A change in a climate average can alter the probability of extremes even if the weather remains variable. For example, a warmer atmosphere can hold more water vapour, which can raise the potential intensity of heavy rainfall, while local rainfall still depends on storm tracks, topography, season and circulation.
The climate system connects the atmosphere, oceans, land, ice and living things. Energy from the Sun enters mainly as short-wave radiation. Earth’s surface absorbs some of it and emits energy as long-wave infrared radiation. Greenhouse gases absorb and re-emit some outgoing infrared energy, warming the lower atmosphere and surface. Oceans store and transport heat. Ice and snow reflect a large share of sunlight. Forests, soils and the ocean exchange carbon with the atmosphere. A change in one part can affect others.
Two terms help explain the difference between cause and response:
- A forcing changes the energy balance or carbon balance from outside the process being described. Increased greenhouse gases from fossil-fuel burning are a forcing.
- A feedback is a response that amplifies or reduces an initial change. Melting reflective ice exposes darker surfaces, which absorb more solar energy and amplify warming. Increased plant growth could remove more carbon in some places, but heat and drought can instead weaken forests and reduce that uptake.
Feedbacks do not all have the same strength or direction everywhere. A useful explanation names the first change, describes the feedback mechanism, then says whether it reinforces or moderates the original change.
2. Evidence across the Quaternary
The Quaternary began about 2.6 million years ago and continues today. It contains repeated cold glacial periods and warmer interglacial periods. Large ice sheets expanded over parts of North America and northern Europe during glacial periods, and retreated during warmer intervals. The present is an interglacial period known as the Holocene, which began about 11,700 years ago. The Quaternary record is not a simple thermometer chart: evidence comes from different places, measures different parts of climate and has different levels of precision.
Direct measurements
Instrumental records use thermometers, rain gauges, ships, buoys and, more recently, satellites. Instruments provide numerical observations that can be checked and compared. However, measurements are much denser in some regions than others, and instruments and observing practices change. Scientists quality-check records, combine observations and use stated methods to make long records comparable.
Direct global measurements extend back only a small fraction of the Quaternary. They are very useful for recent decades and centuries, but cannot show the whole history of repeated ice ages. Scientists therefore use proxy records: natural evidence that preserves information about past climate.
Ice cores
Ice sheets and mountain glaciers build up layers over time as snow falls and is compressed. A core drilled through the ice contains annual or near-annual layers in some locations, though layers become harder to distinguish deeper down as ice flows and compresses. Dust, volcanic ash and chemical properties can reveal past conditions. Bubbles trapped in ancient ice contain samples of past air, allowing scientists to estimate earlier concentrations of gases such as carbon dioxide and methane.
Ice cores provide unusually valuable evidence because they can contain both climate clues and samples of past atmosphere. They show that greenhouse-gas concentrations varied during glacial cycles and that gases and temperature changed together. Interpreting that relationship requires care: in the transition out of an ice age, orbital changes helped initiate warming, oceans and ice responded, and changing greenhouse gases then amplified global temperature change. The timing and causal sequence are important. A correlation between two records is evidence of a relationship, but by itself does not identify which process started a change.
Ice-core evidence is not a perfect record of every location. The core comes from one site; snowfall, wind-blown dust, ice flow and the chemistry of the snow influence the signal. Air becomes sealed in bubbles after snow is deposited, so the gas in a bubble can be younger than the ice around it. Scientists account for this age difference and compare different cores rather than treating one sample as the whole planet.
Ocean sediments and fossils
Tiny marine organisms build shells from chemicals in seawater. When the organisms die, their shells settle in layers on the seabed. The mix of species and the chemical composition of shells can indicate ocean temperature, ice volume or water conditions. Sediment cores can reach far back in time and provide evidence across multiple glacial cycles. Their strengths are long time coverage and a broad ocean record; their limitations include dating uncertainty, mixing by organisms and the fact that a local sediment site represents a particular marine environment.
Fossils also show which plants and animals lived in a place. Their ranges depend partly on temperature, rainfall, soil and habitat. A fossil assemblage can therefore indicate whether conditions were warmer, colder, wetter or drier than today. The inference is strongest when many types of evidence support the same interpretation.
Tree rings, pollen and other natural records
Many trees produce one growth ring each year. Ring width, density and chemistry can respond to temperature, moisture, growing-season length, disease and competition. When a ring pattern is matched across living trees and preserved wood, scientists can extend a chronology further back in time. Tree rings can provide very detailed year-to-year clues, but the signal is local and may be affected by factors other than climate. A narrow ring does not automatically mean a year was globally cold.
Pollen grains are preserved in peat and lake sediments. Different plants grow under different climatic conditions, so changing pollen proportions can indicate shifts in vegetation and local climate. Pollen also records land use: a rise in crop pollen may reflect farming rather than a climate shift. Coral growth bands, cave deposits, lake sediments, glacier extent and raised beaches provide further evidence. Each proxy has a distinct geography, timescale and sensitivity.
Historical evidence and reconstruction
Written accounts, harvest dates, paintings, ship logs and records of river freezing can add context for recent centuries. They can reveal seasonal conditions, but they were not collected using one standard method. People recorded unusual events more often than ordinary ones, and surviving records are unevenly distributed. Such evidence can be compared with tree rings, ice cores and instrument records, rather than used alone.
Climate reconstructions combine records because each proxy has gaps. Scientists date layers using annual patterns, volcanic ash markers, known historical events, radiometric methods and cross-matching between sites. Every date and estimate has an uncertainty range. A graph should therefore be read as a measured estimate over a stated period, not as an exact reading from every day in the past.
Reading a climate graph responsibly
When you interpret a temperature graph, check these items before describing a trend:
- Variable: Is it temperature, rainfall, sea level or a proxy such as an isotope ratio?
- Unit: Is temperature shown in degrees or as an anomaly? Is precipitation shown in millimetres?
- Baseline: An anomaly is a difference from a stated reference average. A zero anomaly means equal to that baseline, not no temperature.
- Timespan: A graph of decades cannot demonstrate the same pattern as a graph of thousands of years.
- Geography: Is it one station, a region, land only, the ocean, or a global average?
- Resolution and uncertainty: Are individual years shown, smoothed averages, confidence ranges or gaps?
- Pattern: Describe the direction, rate and any fluctuations before suggesting a cause.
Avoid comparing two anomaly graphs that use different baselines without converting them. Their zero lines differ even if they refer to the same physical temperature. Likewise, a short period may be dominated by natural variability and does not by itself establish or overturn a longer trend.
3. The Quaternary climate pattern
During the Quaternary, cold glacial periods alternated with warmer interglacials. Evidence from ice and ocean sediments shows repeated cycles, but not a perfectly regular clock. The most recent major glacial period ended as the Northern Hemisphere warmed and ice sheets retreated. The present Holocene has included natural variations in regional climate, while recent industrial-era warming has occurred at a markedly different pace and has a different main cause.
Orbital variations change how Earth moves around the Sun and how its axis is oriented. Three changes are usually grouped as Milankovitch cycles:
- Eccentricity describes changes in the shape of Earth’s orbit, from more circular to more elliptical, on timescales of roughly one hundred thousand years.
- Obliquity is the tilt of Earth’s axis. The tilt changes over a cycle of roughly forty-one thousand years and affects the contrast between seasons and the distribution of sunlight by latitude.
- Precession is a slow change in the direction of Earth’s axis and the timing of the seasons relative to Earth’s position in its orbit, with important cycles of around twenty thousand years.
These changes do not simply turn the Sun up or down. They alter the seasonal and latitudinal distribution of incoming solar energy. Summer sunlight at high northern latitudes is especially relevant to whether winter snow melts completely. If several cool summers allow snow to survive, each winter may add more snow than the next summer removes. Snow compresses into ice; growing ice sheets reflect more sunlight, creating a positive ice-albedo feedback. As ice sheets grow, more water is stored on land and global sea level falls. When orbital conditions favour warmer summers, melting can begin, but feedbacks in ice, oceans and greenhouse gases also shape the pace and extent of change.
Orbital cycles explain important aspects of the timing of glacial-interglacial cycles, not every detail. Feedbacks and the internal movement of heat through the ocean-atmosphere system help explain the size, sequence and regional expression of change. The evidence also teaches a vital distinction: a cause that was important over tens of thousands of years does not automatically explain a rapid change over a century.
An interglacial is not a period with an unchanging climate. The Holocene includes regional changes in rainfall, temperature, vegetation, glaciers and sea level. Coastlines moved as land ice melted and ocean water expanded. Some shifts were gradual and others relatively abrupt in particular regions. Farmers and societies adapted to changing local conditions, but historical accounts do not offer the global, instrument-standard record now available.
4. Natural causes of climate change
Natural drivers operate through different mechanisms and timescales. Their effects can be global or regional, short or long, warming or cooling. A strong explanation compares the timescale and physical fingerprint of a proposed cause with the observed pattern.
Orbital changes
Orbital changes redistribute sunlight between seasons and latitudes over thousands of years. They are a major control on the repeated glacial cycles of the Quaternary. In a cold period, expanded snow and ice increase reflection; changes in ocean circulation and greenhouse gases then interact with the initial orbital forcing. A full account describes this sequence instead of stating that orbit alone caused all the warming or cooling.
The current rapid warming cannot be explained by orbital cycles. The cycles are slow, their present configuration would not produce the observed rapid rise, and measurements of the Sun and atmosphere show other influences. NASA explains that orbital variations do not account for recent warming; the direct addition of carbon dioxide from human activity changes atmospheric composition on a much shorter timescale. The main lesson is to test a cause against rate, direction, timing and independent observations.
Volcanic activity
Explosive volcanic eruptions can send ash and sulphur dioxide high into the atmosphere. Sulphur dioxide reacts to form tiny sulphate aerosols in the stratosphere. These particles scatter some incoming sunlight back to space, producing temporary cooling at the surface. The effect may last a year or several years, depending on eruption size, atmospheric circulation and how quickly particles settle out.
Volcanic ash usually falls out relatively quickly. The fine aerosols in the stratosphere can spread much farther and persist longer. The response differs by region and season; a global average may conceal local changes in rainfall or temperature. Volcanoes therefore provide evidence that natural forcing can alter climate, but their typical cooling effect is temporary rather than the sustained global warming observed across recent decades.
Volcanoes can also release carbon dioxide, but their emissions are much smaller than the carbon dioxide released by human activities. Do not confuse a large, dramatic eruption with a larger long-term carbon source. The visible ash cloud and the longer-lived aerosol effect also have different timescales.
Solar output
The Sun supplies nearly all the energy that drives Earth’s climate. Solar energy varies over cycles and over longer periods, and a sustained change in solar output can influence climate. The roughly eleven-year sunspot cycle produces small fluctuations in energy received. It is one factor in natural variability, but it does not explain the ongoing rapid rise in global temperatures.
If increasing solar output were the main reason for recent warming, scientists would expect a pattern consistent with increased solar energy reaching Earth. Instead, satellite records over recent decades do not show a rising solar trend large enough to explain the observed warming. Other measurements show the lower atmosphere warming while the stratosphere has cooled, a pattern consistent with an enhanced greenhouse effect rather than simply a brighter Sun. These independent fingerprints help distinguish causes.
Natural variability and attribution
The climate system varies without an external forcing. Ocean-atmosphere patterns such as El Niño and La Niña redistribute heat and can shift global mean temperature for a few years. They do not create the long-term energy imbalance that explains the sustained rise. Weather noise can make one year warmer or cooler than the trend.
Attribution is the process of assessing how much observed change is linked to particular causes. It uses observations, physical understanding and climate-model experiments. Researchers compare simulations with human influences, natural influences, or both. A cause is more convincing when it explains multiple observations at once: warming of the lower atmosphere and ocean, shrinking land ice, rising sea level, changing seasons, increasing greenhouse-gas concentrations, and the pattern of warming through the atmosphere.
The IPCC’s Sixth Assessment Report concluded that human activities, principally greenhouse-gas emissions, have unequivocally caused global warming. For 2011–2020, its assessed global surface temperature was about 1.1°C above 1850–1900. These are report-period values rather than a live thermometer reading. WMO later assessed 2024 as the first single calendar year likely to exceed 1.5°C above that pre-industrial reference, while stressing that long-term warming averaged over decades remained below 1.5°C. One year above a threshold is not the same as a long-term average above it. Always attach a number to its period, dataset and baseline.
5. Human causes and the enhanced greenhouse effect
The natural greenhouse effect makes Earth much warmer than it would be without heat-absorbing gases. Water vapour, carbon dioxide, methane and other gases absorb some outgoing infrared radiation and emit energy in all directions. This process warms the lower atmosphere and surface. The current problem is an enhanced greenhouse effect: human activity has increased concentrations of several greenhouse gases, changing the energy balance.
Carbon dioxide is released when coal, oil and natural gas are burned for electricity, heating, transport and industry. Fossil fuels contain carbon that had been stored underground over geological timescales. Combustion transfers much of that carbon into the atmosphere as carbon dioxide. Cement-making also releases carbon dioxide through a chemical process as well as through its energy use.
Methane is emitted by livestock digestion, rice cultivation, waste sites and fossil-fuel production and transport. Nitrous oxide is associated with nitrogen fertilisers, manure and some industrial processes. Deforestation and land-use change release carbon stored in trees and soils and reduce the amount of carbon that forests can remove from the atmosphere. Different gases remain in the atmosphere for different lengths of time and trap heat with different strength, so climate scientists compare them using a common measure such as carbon-dioxide equivalent.
Fossil fuels: from energy demand to climate forcing
Fossil fuels have been central to industrialisation because they provide concentrated, transportable energy. Coal powered factories and electricity generation; oil transformed transport; natural gas supplies electricity, heat and industrial feedstock. Population growth, rising incomes, urbanisation and production have raised demand for energy and goods in many regions.
The causal chain is:
- A power station, vehicle, furnace or boiler burns a fossil fuel.
- Carbon that was stored in the fuel combines with oxygen and enters the air mainly as carbon dioxide.
- The increased concentration means more outgoing infrared energy is absorbed and re-emitted within the climate system.
- The energy imbalance warms the atmosphere and oceans until energy leaving the system increases enough to approach a new balance.
- Warming alters the probability and intensity of many climate-related effects, with local outcomes depending on geography and society.
The ocean and land absorb part of the carbon dioxide people emit. That uptake slows the atmospheric increase, but has consequences: the ocean becomes more acidic as it absorbs carbon dioxide, and land carbon stores can be weakened by warming, drought, fire and land clearance. A sink is not an unlimited bin; it can saturate or become a source under changed conditions.
Agriculture and land use
Agriculture changes climate through both emissions and land cover. Cattle and other ruminants produce methane during digestion. Manure can emit methane and nitrous oxide. Flooded rice paddies create low-oxygen conditions in which microbes produce methane. Nitrogen fertiliser improves crop yields but can lead to nitrous oxide release from soils, particularly when application exceeds what crops can use.
Land is also cleared for pasture, crops, plantations, settlements and infrastructure. Burning or decomposition of felled vegetation releases carbon. Removing forests reduces future carbon uptake and can change evapotranspiration, local humidity and rainfall recycling. Soil carbon may be lost when land is ploughed, drained or eroded. The effect differs by ecosystem and practice; restoring degraded land and improving soil management can increase carbon storage, but not every tree-planting project stores carbon permanently.
Agriculture is also affected by climate, which creates a two-way relationship. Heat, drought, floods and changing seasons influence yields; farming emissions and land conversion influence climate. This link can create feedbacks. For example, drought can reduce harvests, encourage further land clearance, and weaken vegetation that would otherwise store carbon. The chain may be interrupted by efficient irrigation, crop choices, soil protection or secure land rights.
Deforestation
Forests store carbon in trunks, branches, leaves, roots and soils. When a forest is cleared and burned, some stored carbon is released quickly; remaining wood may decompose or be used in ways that release carbon later. The cleared land also loses future carbon uptake. If forest is replaced by pasture or crops, soil structure, local water cycling and habitats can change as well.
The causes of deforestation include commercial agriculture, cattle ranching, timber, mining, roads and settlement. These drivers reflect demand, land ownership, government policy and livelihoods. A map may show forest loss in a particular region, but explaining it requires asking who is clearing land, for which market, and with what alternatives. A response that protects a forest without considering local rights and income may shift clearing elsewhere or impose costs on residents with little power.
Comparing human and natural influences
| Feature | Natural drivers | Human drivers in the current era |
|---|---|---|
| Examples in the specification | Orbital changes, volcanic activity, solar output | Fossil fuels, agriculture, deforestation |
| Typical timescale | From months or years for aerosols to tens of thousands of years for orbital cycles | Rapid increases over decades to centuries |
| Mechanism | Changes in incoming sunlight, reflection or long-term seasonal distribution | Adds greenhouse gases, changes carbon stores and the surface energy balance |
| Evidence to compare | Volcanic aerosol signatures; orbital patterns in ice and sediment records; solar measurements | Rising greenhouse-gas concentrations; observed warming patterns; carbon from fossil sources |
| Main assessment question | Does the timing, direction and duration fit the observed change? | Do emissions and multiple climate fingerprints explain the measured trend? |
This comparison should not imply that all natural and human influences are equal today. Both can affect climate, but the evidence points to human greenhouse-gas emissions as the dominant cause of recent global warming. A balanced answer recognises natural variability while evaluating whether it can explain the observed long-term pattern.
6. Effects on people and the environment
Climate change changes hazards and background conditions, but a hazard does not automatically produce equal harm everywhere. Exposure is the people and assets in harm’s way. Vulnerability depends on sensitivity and ability to prepare, respond and recover. A heatwave affects an older person in a poorly ventilated home differently from a healthy person with access to shade, cooling and healthcare. The same rainfall total can have different consequences in a steep catchment, a floodplain, a paved city or a well-drained upland.
The IPCC finds that human-caused climate change is already affecting weather and climate extremes across all regions. The strength of evidence varies by hazard and location. Some impacts are directly observed, while future projections depend on emissions, natural variability, development choices and adaptation. Distinguish an observed trend from a projection and a climate influence from the only cause of a particular event.
Heat and health
Higher average temperatures increase the likelihood of very hot conditions. Heat stress can cause dehydration, worsen cardiovascular and respiratory illness, reduce sleep and affect people working outdoors. Risk is often higher for older adults, infants, people with existing health conditions, outdoor workers and residents of poorly ventilated or crowded housing.
Cities can be warmer than surrounding countryside because buildings and roads absorb and store heat; there may be less vegetation and less evaporative cooling. Dense development, waste heat and limited night-time cooling can make heat more persistent. Trees, parks, shaded streets, cool roofs and ventilation can lower local heat exposure, but planting needs water and maintenance and benefits may be unevenly distributed.
Hotter conditions may lengthen some growing seasons and reduce cold-related impacts, but benefits are not uniform. Heat can lower labour productivity and crop yields once temperatures exceed thresholds. Averages can hide dangerous extremes, so health planning uses forecasts and heat-warning systems as well as climate trends.
Rainfall, drought and water
Warming increases evaporation and allows the atmosphere to hold more water vapour. In places and seasons where air rises and moisture is available, this can increase the potential for intense precipitation. But rainfall changes are not uniform: circulation, monsoon behaviour, topography and local weather systems influence whether a particular area becomes wetter or drier.
Drought can develop when rainfall deficits persist, soils dry, rivers fall and reservoirs or groundwater are not replenished. Higher temperatures can accelerate evaporation and increase demand from people, farms and ecosystems. Water shortages may affect household supply, sanitation, food production, industry, energy generation and river habitats at the same time. Competition rises when water is allocated among sectors with different needs.
Flood and drought can both become more difficult to manage as extremes change, yet the link between one flood and climate change needs event-specific evidence. A flood may reflect intense rainfall, saturated ground, a high tide, river engineering, urban drainage and settlement exposure. Climate change can alter some probabilities without being the sole cause of that event.
Food and agriculture
Crop growth depends on temperature, water, soil, pests, pollinators and the timing of seasons. A longer frost-free season may benefit some crops at higher latitudes. Elsewhere, heat stress during flowering can reduce yields; drought limits water for crops and livestock; heavy rain can waterlog fields, wash away topsoil or delay planting and harvest.
Changes to growing conditions can shift where crops are viable, but farmers need suitable soils, water, infrastructure, capital, knowledge and markets. A crop that becomes climatically possible may still be uneconomic or require irrigation that competes with household use. Warmer conditions can alter pests and disease ranges, and livestock can experience heat stress.
Food security is not identical to total food production. It also depends on access, affordability, stability and nutrition. A country may have adequate national production while some households cannot afford food; a global harvest can be affected by simultaneous crop failures across key producing regions. Storage, transport, trade, crop diversity, social protection and farmer support influence resilience.
Sea-level rise and coastal areas
Global mean sea level rises mainly because warmer ocean water expands and land ice melts. Changes in land water storage and vertical land movement also matter locally. The sea does not rise by the same amount at every coast: currents, winds, gravitational effects, land uplift or subsidence and regional ocean conditions shape relative sea level.
Higher mean sea level raises the starting point for high tides and storm surges. This can make damaging coastal flooding more likely, increase erosion in exposed places and push salt water into estuaries, soils or freshwater stores. Saltwater intrusion can affect drinking water and crops. Low-lying islands, deltas, ports and coastal cities are exposed, but risk varies with elevation, geology, defences, housing and evacuation capacity.
Coastal adaptation involves difficult choices. A community may protect a dense city with hard defences, restore wetlands that absorb wave energy, change building rules, elevate infrastructure or plan for managed realignment. A sea wall can reduce risk in one place while shifting erosion or flood pressure elsewhere; it may also disconnect residents from the coast or alter habitats. The most suitable mix depends on the value of the area, sediment movement, ecosystem role and future sea-level pathway.
Ecosystems and biodiversity
Species are adapted to particular ranges of temperature, rainfall, seasons and habitats. As conditions change, some species may move poleward or upslope, change migration or flowering dates, or decline where movement is blocked. A mountain species can lose habitat as suitable climate shifts upward and available land shrinks. A coral reef can experience heat stress and bleaching when water remains unusually warm.
Species do not respond at the same rate. Some can move or adapt behaviourally; others have slow reproduction, specialised habitats or barriers to migration. Ecosystems are connected: a change in one species can affect pollination, food webs, nutrient cycling and people who depend on those services. Habitat fragmentation, overfishing, pollution and land conversion can combine with climate pressure, so it is misleading to attribute every biodiversity loss to warming alone.
Some ecosystems can provide adaptation and mitigation benefits. Wetlands, mangroves and healthy forests store carbon, regulate water and support livelihoods. Protecting them can reduce multiple risks, but conservation plans must account for local communities and avoid treating ecosystems as interchangeable carbon units.
Unequal impacts and climate justice
Climate risk is shaped by physical exposure and social conditions. Wealth may help a government build infrastructure and fund recovery, but income alone does not determine vulnerability. Inequality exists within every country. Informal settlements may have insecure housing and limited drainage; rural communities may depend on rain-fed crops; people with disabilities may face evacuation barriers; older residents may be isolated during heat.
Historical emissions and current vulnerability are unevenly distributed. Some communities that have contributed relatively little to cumulative greenhouse-gas emissions face serious threats to homes, health and livelihoods. This raises questions of climate justice: who caused the problem, who is harmed, who has the resources to respond, and who participates in decisions? A geographic answer connects these questions to place, not just to national averages.
Impacts can cascade. A drought may reduce hydropower and crop output; higher electricity prices can raise food processing costs; households may then cut spending on other needs. Flooding can damage roads, power networks and health services, slowing recovery. These linked effects mean adaptation plans should consider systems and vulnerable groups, rather than protecting one asset in isolation.
7. Mitigation: reducing the causes
Mitigation means limiting the amount of greenhouse gases added to the atmosphere or increasing the removal and long-term storage of carbon. It acts on causes. It can also bring co-benefits such as cleaner air, energy security, new skills and lower fuel costs. A response is not automatically effective because it has a green label: assess how much emissions it avoids, how quickly, for whom, and with what environmental or social costs.
Alternative energy production
Wind, solar, hydroelectricity, geothermal and tidal power can produce electricity with much lower direct carbon emissions than fossil-fuel power stations. Nuclear power is also low-carbon during operation, although it is not renewable. Replacing coal generation is often an important opportunity because coal has high carbon emissions per unit of electricity.
Renewables have different geographical patterns. Solar output is greatest in sunny conditions; wind farms need suitable wind and locations; hydroelectricity depends on river flow and relief; geothermal energy is concentrated where underground heat is accessible. Energy systems therefore require transmission, storage, flexible demand and a reliable mix. A renewable source can have low operating emissions but still require materials, land, construction and end-of-life management.
Wind turbines can affect landscapes and wildlife; hydropower dams can displace people and alter river ecosystems; mining for battery or turbine materials has local impacts; solar farms can compete with land uses. These trade-offs do not make low-carbon technologies ineffective, but they show why planning, lifecycle analysis and public participation matter.
Efficiency and demand reduction
Using less energy for the same service can reduce emissions and household bills. Insulation reduces heat lost from buildings. Efficient appliances, public transport, walking and cycling, compact urban design and industrial improvements can reduce energy demand. Electrification of heating and transport can lower emissions when electricity is increasingly generated from low-carbon sources.
Efficiency alone may not lower total emissions if cheaper services cause people to use more energy, a response known as a rebound effect. Demand reduction also needs to be fair. Households cannot choose efficient heating if they lack money or live in rented homes with poor insulation. Governments and landlords influence standards, finance and infrastructure.
Carbon capture and storage
Carbon capture and storage aims to separate carbon dioxide from large industrial or power sources, transport it and store it deep underground in suitable geological formations. It may be useful for some industrial processes where emissions are difficult to eliminate, such as certain chemical or cement production. Capturing carbon requires energy, infrastructure and long-term monitoring. Storage must be secure, and capture does not remove all environmental impacts of the activity producing the gas.
Carbon removal is different from preventing an emission at the source. Methods that remove carbon from the atmosphere include restoring forests, improving soil carbon and engineered direct-air capture with permanent storage. A forest is only a durable sink if it continues to grow and is protected from fire, pests, drought and later clearance. A project should not be used as a licence to continue avoidable emissions.
Planting and protecting trees
Trees absorb carbon dioxide as they grow and store carbon in wood and soils. Afforestation creates woodland where it was not recently present; reforestation restores forest that has been cleared or degraded. Protecting existing forests prevents large carbon releases and supports biodiversity, water regulation and livelihoods.
Tree planting has limits. A young plantation takes time to store substantial carbon; monocultures support less biodiversity than many natural forests; planting in the wrong habitat can damage grasslands, peatlands or wetlands; drought and fire can return stored carbon to the atmosphere. Good schemes use appropriate native species, protect soil and water, respect land rights, and measure survival and long-term storage. Avoid double-counting the same carbon benefit.
International agreements
Greenhouse gases mix through the atmosphere, so climate change requires international cooperation. The Kyoto Protocol set quantified emission-reduction commitments for many industrialised countries, with different obligations across groups. The 2015 Paris Agreement established a framework in which countries submit nationally determined contributions, report progress and strengthen commitments over time. Its temperature goals are long-term global goals, not an annual limit for every country.
International agreements can set shared direction, support reporting and finance, and encourage policy changes. Their success depends on ambition, delivery, transparency, cooperation and fairness. National targets do not automatically equal real-world emissions cuts; countries may meet targets through policies, accounting rules, land sinks or purchased credits with differing quality. An agreement may also be weakened when targets are delayed, funding is inadequate or countries disagree over responsibilities.
Climate finance matters because lower-income countries may need support for low-carbon infrastructure and adaptation, while some face climate impacts despite low historical emissions. Technology, debt, trade and ownership influence who gains from a transition. A just transition supports workers and regions that depend on high-carbon industries while shifting investment, jobs and training toward lower-carbon options.
8. Adaptation: reducing harm from effects
Adaptation means adjusting human or natural systems to actual or expected climate conditions. It does not stop the greenhouse effect from strengthening; it changes exposure, vulnerability or sensitivity. Some adaptation is anticipatory, undertaken before a damaging event. Other adaptation follows an impact, such as rebuilding a home on raised foundations after repeated floods.
Adaptation can be:
- Structural: physical works such as flood defences, shade structures, raised buildings or reservoirs.
- Ecosystem-based: restoring wetlands, mangroves, forests and urban green space so natural processes reduce risk.
- Technological: heat-warning systems, drought-resistant crops, water-efficient irrigation and improved forecasts.
- Behavioural and social: changing working hours, evacuation routes, emergency plans, public-health advice and community networks.
- Institutional: land-use planning, building standards, water allocation rules, insurance systems and investment plans.
Changing agricultural systems
Farmers can change crop varieties, planting dates, crop mixes and livestock breeds to suit warmer or more variable conditions. Drought-tolerant varieties and efficient irrigation can reduce water stress; soil cover and crop rotation can conserve moisture and reduce erosion. Farmers may shift some crops to more suitable locations, but climate suitability is only one factor. Land tenure, markets, labour, roads, seed access and water rights shape whether change is possible.
Irrigation can protect a harvest during a dry period but may deplete aquifers or reduce downstream water availability if it is poorly managed. A shift to a drought-tolerant crop may protect income but affect nutrition or cultural practices. Diversification can reduce dependence on one crop, yet requires knowledge and access to markets. Evaluate both climate benefit and social consequences.
Managing water supply
Water-management adaptation can include repairing leaks, metering, rainwater storage, recycling wastewater, restoring catchments, protecting groundwater, desalination and transferring water between regions. Each option changes who receives water, how much energy is used, and which ecosystems are affected.
Demand management is often cheaper than building new supply, but restrictions can fall unfairly on households with fewer alternatives. Desalination can provide reliable water to coastal cities, but uses energy and produces concentrated brine that must be managed. Transfers can improve supply for one region while reducing flows in another. Long-term plans need to account for population, agriculture, ecosystems and drought uncertainty.
Reducing coastal and sea-level risks: Thames Estuary 2100
The Thames Estuary provides a detailed UK example of long-term adaptation planning. London and surrounding communities face tidal flood risk because the estuary is low-lying and densely developed. High tides, storm surges, river flow and sea level interact. Climate change raises the background sea level and therefore changes the conditions under which the existing defence system operates.
The Thames Barrier became operational in 1982. Its movable gates can be raised to block an exceptionally high tide from moving upstream into central London. It is one part of a broader system that includes embankments, flood walls, gates, planning and warning arrangements. The barrier reduces risk, but it does not remove every source of flooding or eliminate the need to maintain defences.
The Environment Agency’s Thames Estuary 2100 plan takes an adaptive pathway approach. It monitors sea-level change, population, homes, businesses, habitats and defence condition, and reviews the plan periodically. The 2021 monitoring review reported that the plan protects benefits for about 1.42 million people, 586,000 homes and £321 billion of residential property. The 2026 review says defences perform well but accelerating sea-level rise means long-term investment, better tidal forecasting and reassessment of future infrastructure are needed. These figures describe the plan’s coverage and review dates; they are not a promise that every future flood is prevented.
The plan stages decisions over time. The near-term approach maintains defences and prepares future upgrades. Later stages consider riverside redesign and options for the barrier beyond its current role. Keeping options open is valuable because projections and social priorities change. Waiting also has risk: large infrastructure takes time to plan, finance and construct. Monitoring can identify when a decision threshold is approaching, but uncertainty remains.
Hard defences protect valuable urban land but require maintenance and may alter river environments. Wetlands and riverside habitats can provide ecological benefits and absorb some water, but available space is limited in a dense city. Planning rules can limit new development in high-risk areas, yet housing demand and existing communities complicate retreat. A strong evaluation asks who is protected, who pays, which habitats are affected, and whether defences transfer risk to other locations.
Urban heat adaptation
Urban adaptation includes tree planting, green roofs, water features, reflective surfaces, shaded public spaces, building ventilation and heat-health alerts. Trees provide shade and evapotranspiration cooling, but take years to mature and need suitable water and maintenance. Green roofs can cool buildings and slow rainfall runoff, although retrofitting them has cost and structural limits. Reflective roofs reduce solar absorption but can create glare or shift heat toward pedestrians if poorly designed.
Public-health plans can open cool spaces, check on residents at risk, adjust outdoor work schedules and communicate advice in accessible languages. These actions can save lives during a heatwave, but they do not reduce global emissions. Urban design and emergency response are complementary: design reduces exposure over the long term, while warnings and care protect people during immediate events.
9. Mitigation and adaptation together
Mitigation and adaptation answer different questions:
| Approach | Main question | Example | What it cannot do alone |
|---|---|---|---|
| Mitigation | How can future climate change be limited? | Replace coal-fired electricity with low-carbon generation | It cannot immediately remove all warming already committed by past emissions |
| Adaptation | How can people and environments reduce harm? | Raise or upgrade flood defences as sea level changes | It does not prevent continued emissions or protect every location indefinitely |
Both are needed. The climate system responds slowly to some emissions, and sea level continues to rise as oceans warm and ice responds, so adaptation matters even when emissions fall. Adaptation also has limits: crops, coastal defences and species cannot cope with unlimited change. Mitigation reduces the scale of future change and the burden on adaptation.
Some measures do both: wetlands store carbon and reduce coastal risk; insulation cuts energy use and protects residents from heat or cold; urban trees provide shade and store carbon. Other measures create trade-offs. Air conditioning can reduce heat illness but use electricity; irrigation can protect crops but worsen water scarcity; biofuels can compete with food or habitat.
Maladaptation occurs when an action increases risk or inequality in the long run, often for another group or place. Building a high wall may encourage development behind it, increasing losses if the wall fails. A new water transfer could relieve one city but damage the donor basin. A tree-planting offset could restrict local land access while allowing fossil emissions to continue elsewhere. Evaluation should consider time, place, distribution and unintended effects.
Place example
The Thames Estuary 2100 plan is the named place example used in this guide. It shows how a low-lying, densely settled estuary can adapt to rising sea-level and tidal-flood risk through a staged combination of defences, monitoring, planning and future decision points. The example is illustrative; use the case study selected by your school if it differs.
10. Example of a climate impact and response
London and tidal flood risk
London is a useful example of exposure and adaptation, not a universal model for every coast. The Thames is a tidal river flowing through a major urban region with homes, transport, utilities, businesses and heritage sites. A high tide or storm surge can raise water levels; river flow and rainfall can add further pressure. Climate-related sea-level rise increases the baseline against which tides and surges occur.
The Thames Barrier is a visible protective measure. The wider TE2100 plan is more instructive for studying adaptation because it links infrastructure to long-term monitoring, planning and future choices. Rather than fixing one design for all future conditions, the plan records indicators and revisits decisions. Its 2021 review quantified the scale of people, homes and property covered; later monitoring has emphasised the need to respond to faster sea-level rise and future defence requirements.
The strategy has strengths: it combines an existing barrier with local defences, plans upgrades before they are needed, monitors environmental and social change, and leaves more than one long-term option open. It can coordinate decisions across local boundaries, since floodwater and tidal processes do not follow council borders.
It also has limits. The system must be maintained and funded. Sea-level projections have ranges, but the direction of long-term pressure is clear. Protecting one stretch can affect flow or risk elsewhere. Higher defences can change riverside character and habitat. Construction itself has carbon emissions. A managed pathway avoids premature investment in a single option, but requires regular review and the ability to act when triggers are reached.
Use the case study to show that adaptation is not a single structure. It is a combination of engineering, monitoring, planning, maintenance, public communication and choices about future land use. Avoid claiming that the barrier proves London is safe from every flood.
Using current climate indicators carefully
The World Meteorological Organization reported that 2024 was likely the first calendar year with a global mean temperature more than 1.5°C above 1850–1900, while long-term warming averaged over decades remained below 1.5°C. One annual value does not mean the Paris Agreement’s long-term goal was permanently exceeded. The UK Met Office reports that the 1991–2020 UK average temperature was more than 0.9°C higher than 1961–1990, while annual rainfall was 7.3% higher. These are national comparisons between 30-year periods, not uniform changes in every region or season.
In an examination, attach the period, location, variable and source to each figure.
Common misconception
Climate questions often contain a hidden category error: confusing weather with climate, a short-term fluctuation with a long-term trend, a natural influence with the only influence, or an adaptation with mitigation. Correct the category first, then explain the evidence and mechanism.
11. Common misconceptions and how to correct them
“Climate has changed naturally before, so humans cannot be changing it now.”
Past natural changes show that climate has multiple drivers. They do not identify the cause of the present change. Compare the mechanism and timing. Orbital cycles help explain glacial cycles over thousands of years; volcanic aerosols can produce short-lived cooling; measured greenhouse-gas increases and climate fingerprints explain the rapid, sustained modern warming.
“A cold spell disproves global warming.”
Weather varies from day to day and year to year. Climate evidence uses long-term averages and distributions. A cold winter at one location can occur in a warming world, especially when circulation patterns bring cold air. Ask whether a claim concerns one event or a long-term trend.
“The greenhouse effect is pollution and is entirely bad.”
The natural greenhouse effect makes Earth habitable. The problem is the enhanced effect from rapidly rising greenhouse-gas concentrations. Air pollution and greenhouse gases overlap in some sources but are not identical categories; some air pollutants have cooling effects while damaging health.
“One hot year proves that the 1.5°C target has been passed.”
The 1.5°C figure refers to a long-term global temperature goal. A single year can exceed it due to long-term warming plus natural variability, but it is not the same as a multi-decade mean. State which kind of measure you are describing.
“Mitigation and adaptation mean the same thing.”
Mitigation reduces drivers; adaptation manages effects. Solar electricity is mitigation. A heat-health warning or flood defence is adaptation. Some actions contribute to both, but explain the mechanism for each.
“Trees make any activity carbon neutral.”
Carbon storage depends on how many trees survive, how long they grow, the ecosystem replaced, and whether carbon is later released. Protecting existing carbon-rich ecosystems can be more effective than replacing them with plantations. Offsetting claims need transparent measurement and safeguards.
“If a flood happened after climate change, climate change caused it.”
Sequence is not proof of causation. Flood risk combines meteorology, land cover, catchment processes, drainage, settlement and protection. Climate change can alter the probability or intensity of some hazards, but a particular event needs attribution evidence.
“An adaptation structure removes risk.”
Defences lower risk for a design range, but can fail, be overtopped or become insufficient as conditions change. Maintenance, warning, evacuation, land-use planning and recovery capacity still matter.
Maps, data and evidence
Describe before you explain
If a map shows projected changes, first describe its spatial pattern: which regions show the largest change, which show a smaller change, and whether the pattern is continuous or uneven. Use named places and the map key. Then explain possible processes. Do not assume every region changes in the same direction.
Compare evidence types
An ice core can provide a long atmospheric and temperature proxy record from a polar site. A thermometer provides a direct local measurement. A satellite gives broad spatial coverage of particular variables for a shorter period. Historical diaries offer human descriptions but were not recorded consistently. Each record can contribute evidence, but each has limitations.
A strong answer evaluates representativeness, timespan, resolution and uncertainty. If two sources disagree, they might measure different variables, locations or periods rather than showing that one is automatically false.
Separate observation, attribution and projection
- Observation: a measured change, such as a rise in a temperature record or sea-level gauge.
- Attribution: an explanation of how much a driver contributed to the change.
- Projection: a conditional estimate of future change under stated assumptions and scenarios.
A projection is not a prediction that one precise outcome must happen. It is a way to examine possible futures given emissions, climate sensitivity and other choices. Quote ranges and scenarios accurately. Do not present uncertainty as ignorance: scientists may be confident about the direction of change while less certain about the exact regional amount.
Explain with a cause chain
For a human cause:
More fossil-fuel use → more carbon dioxide in the air → stronger absorption of outgoing infrared radiation → energy accumulates in the climate system → global temperature rises → impacts vary by location and vulnerability.
For an adaptation:
Higher relative sea level → high tides start from a higher baseline → larger area or depth may flood → monitor water levels and upgrade a defence pathway → reduce expected losses, while maintaining other preparedness measures.
Use precise linking words: because, therefore, which increases, as a result, however, and this depends on. A list of impacts is not yet an explanation.
Key vocabulary
| Term | Meaning |
|---|---|
| Adaptation | Adjustment to actual or expected climate conditions to reduce harm or use opportunities |
| Anomaly | Difference between a value and a stated average baseline |
| Atmosphere | The layer of gases surrounding Earth |
| Carbon sink | A store that absorbs more carbon than it releases over a stated period |
| Climate | Long-term patterns and ranges of weather conditions |
| Climate attribution | Assessment of the causes and contributions to observed climate change |
| Climate projection | Conditional estimate of future climate under stated scenarios |
| Feedback | A process that amplifies or reduces an initial change |
| Forcing | An influence that changes the climate system’s energy or carbon balance |
| Glacial period | A long cold interval when large ice sheets expand |
| Greenhouse effect | Warming caused when atmospheric gases absorb and re-emit outgoing infrared energy |
| Greenhouse gas | A gas that absorbs infrared radiation, such as carbon dioxide or methane |
| Holocene | The current interglacial epoch, beginning about 11,700 years ago |
| Interglacial | A warmer interval between glacial periods |
| Mitigation | Action that limits emissions or increases durable removal of greenhouse gases |
| Milankovitch cycles | Long-term changes in Earth’s orbit and axial orientation that redistribute solar energy |
| Palaeoclimate | Climate of the geological past |
| Proxy record | Indirect evidence used to infer earlier climate conditions |
| Quaternary | The geological period beginning about 2.6 million years ago and continuing today |
| Sea-level rise | Increase in mean sea level, with local relative change also affected by land movement |
| Vulnerability | How susceptible a person or system is to harm and how able it is to cope |
Self-check
Try these without looking back. For extended answers, support each point with a process, place or piece of evidence.
- Explain the difference between weather and climate.
- What is a proxy record, and why do geographers use one?
- Give one strength and one limitation of ice cores.
- Why should an anomaly graph be read with its baseline?
- What does evidence from the Quaternary show about glacial and interglacial periods?
- Describe the three main orbital variations and their timescales in broad terms.
- How can orbital changes affect the growth or retreat of ice sheets?
- How can a large volcanic eruption cause temporary cooling?
- How could solar output influence climate, and why does it not explain modern warming?
- Trace the pathway from fossil-fuel burning to a warmer global average.
- Explain two ways agriculture can add greenhouse gases.
- Explain how deforestation can affect both carbon storage and local water cycling.
- Name two observations that help scientists attribute recent warming to human activity.
- How does a warmer atmosphere affect the potential for heavy precipitation?
- Explain how climate change can affect food production without assuming every region loses yield.
- Describe two ways sea-level rise can affect a coastal community.
- Explain why climate-related risks are not equal between different groups of people.
- State one mitigation action and explain the mechanism by which it reduces climate change.
- Explain why planting trees is not an automatic substitute for reducing fossil-fuel emissions.
- What is carbon capture and storage, and what limits its role?
- Explain one strength and one limitation of an international climate agreement.
- Distinguish between a change in farming systems as adaptation and renewable electricity as mitigation.
- Describe how the Thames Estuary 2100 plan uses monitoring to guide future action.
- Give an example of maladaptation and explain who could be disadvantaged.
- Why is one calendar year above 1.5°C not the same as a long-term average above 1.5°C?
Short answer guide
- Weather is short-term atmospheric conditions; climate is the long-term pattern and range, commonly described across decades.
- A proxy is indirect natural evidence of past conditions. It extends climate knowledge beyond the short instrumental record.
- Ice cores preserve past snow layers and trapped air; they can be dated and linked to gases. A core samples one location, and layers become compressed or harder to date with depth.
- An anomaly is relative to a reference average; the zero point depends on the selected baseline.
- The Quaternary includes repeated colder glacial periods and warmer interglacials, with climate reconstructed from multiple proxies.
- Eccentricity changes orbit shape over roughly 100,000 years; obliquity changes axial tilt over roughly 41,000 years; precession changes axis orientation and seasonal timing over roughly 20,000 years.
- Orbital change affects summer sunlight at high latitudes. If snow survives successive summers, ice can accumulate; if summers are warmer, snow and ice can retreat. Albedo and greenhouse-gas feedbacks alter the response.
- Sulphur dioxide forms stratospheric aerosols that scatter sunlight, lowering surface temperatures temporarily.
- Solar output varies and can influence climate, but recent solar measurements do not show an increase large enough to explain observed warming; greenhouse-gas fingerprints fit better.
- Combustion releases stored carbon as carbon dioxide; more greenhouse gas absorbs and re-emits more outgoing infrared energy; the climate system warms.
- Ruminant livestock and flooded rice fields emit methane; fertilised soils and manure can emit nitrous oxide. Any two with mechanisms earn credit.
- Clearing releases stored carbon and reduces future uptake; loss of tree cover can alter evapotranspiration, humidity and rainfall recycling.
- Examples include rising greenhouse-gas concentrations, warming of oceans and lower atmosphere, shrinking land ice, sea-level rise, or observed patterns inconsistent with solar forcing alone.
- Warmer air can hold more water vapour, raising the potential intensity of precipitation when conditions cause air to rise; local storms and rainfall still depend on circulation and geography.
- Heat, drought and heavy rain may reduce yields in some areas, while longer growing seasons may benefit others. Crops, soils, water, season and access to adaptation matter.
- It raises the baseline for tides and storm surges and can increase flood, erosion or saltwater intrusion risk. Local land movement also affects relative sea level.
- Exposure, housing, income, health, services, rights, preparedness and recovery capacity differ, both within and between countries.
- Replacing fossil electricity with wind or solar reduces emissions from power generation because operation does not burn fuel.
- Forest carbon storage takes time and may be released by fire, drought or later clearance; avoiding emissions reduces the source directly.
- It captures carbon dioxide from a large source and stores it in suitable geological formations; cost, energy use, infrastructure and permanence are limits.
- An agreement can coordinate goals and reporting; its effect depends on delivery, ambition, fairness, finance and enforcement.
- Changing crops or planting dates manages impacts; renewable power reduces emissions driving warming.
- The plan tracks sea levels, population, property, habitats and defence condition and reviews pathways before future upgrades are needed.
- A flood wall may encourage development behind it or transfer risk downstream, disadvantaging residents or ecosystems outside the protected area.
- A single year includes natural variability; the 1.5°C goal is assessed over a long-term average. State the period and measure.
Revision points
- Use the full evidence chain: record → timespan → pattern → cause → consequence.
- Compare natural and human causes by mechanism, rate, direction and evidence.
- Explain the greenhouse effect accurately: gases absorb and re-emit outgoing infrared energy.
- Do not use a single weather event as proof of a climate trend; explain how event attribution differs from general climate evidence.
- Trace effects through physical systems and then to people, recognising differences in exposure and capacity.
- Use mitigation for causes and adaptation for effects; define the mechanism of each response.
- Evaluate a response using effectiveness, time, cost, scale, fairness, maintenance and unintended effects.
- Attach baselines, dates, units and places to statistics.
- In a longer answer, make a judgement that follows from the evidence instead of adding a final unsupported opinion.
Curriculum alignment
- Curriculum coverage ID: aqa.3.1.1.climate-change
- Related practice packs: gcse_geo_p1_physical_environment_june_2022, gcse_geo_p1_physical_environment_june_2023, gcse_geo_p1_physical_environment_june_2024, gcse_geo_p1_physical_environment_november_2020, gcse_geo_p1_physical_environment_november_2021
- Shared concept tags: climate-change, ice-ages, greenhouse-gases, mitigation-adaptation, climate-evidence, climate-impacts
Sources and further reading
- AQA GCSE Geography 8035, Living with the physical environment: Specification content
- IPCC, Sixth Assessment Report Synthesis Report: Headline statements
- IPCC, Working Group I: Human influence on the climate system
- NASA: Paleoclimate evidence
- NASA: Climate evidence
- NASA: Why orbital cycles cannot explain current warming
- NASA: Climate and Earth’s energy budget
- World Meteorological Organization: State of the Global Climate 2024
- Met Office: State of the UK Climate
- Met Office: UK Climate Projections
- Environment Agency and DEFRA: Thames Estuary 2100 15-year monitoring review
- Environment Agency and DEFRA: Taking an adaptive approach: Thames Estuary 2100
- Environment Agency: The Thames Barrier
Check each statistic’s date, baseline, spatial scale and method.