 FoxChild@Learn
2. Tectonic hazards
Curriculum status: Required core content.
This guide follows AQA GCSE Geography 8035, Section 3.1.1.2. It explains plate tectonics, the global pattern of earthquakes and volcanoes, and how physical processes operate at constructive, destructive and conservative margins. The specification also requires comparison of the effects and responses of two tectonic hazards in areas with contrasting levels of wealth, plus reasons people live in hazardous areas and ways monitoring, prediction, protection and planning reduce risk. Japan (2011) and Nepal (2015) are suggested examples for this guide; they are not mandated, so use the case studies taught by your school if different. Figures are dated and cited because reports may use different definitions or update totals.
Required knowledge
- Explain plate tectonics theory and the evidence used to develop it.
- Locate the global distribution of earthquakes and volcanoes, relating most activity to plate margins while recognising hotspot exceptions.
- Explain plate movement and the physical processes at constructive, destructive and conservative margins, including why earthquakes and volcanic activity occur.
- Compare primary and secondary effects and immediate and long-term responses for two named events in areas with contrasting levels of wealth.
- Explain why people continue to live in hazard-prone places.
- Evaluate how monitoring, prediction, protection and planning can reduce risk, including the limits and uneven access to each strategy.
Key vocabulary
| Term | Meaning |
|---|---|
| crust | Earth's outermost solid rocky layer; oceanic crust is generally thinner and denser than continental crust |
| lithosphere | rigid outer Earth layer consisting of crust and the uppermost mantle, divided into tectonic plates |
| asthenosphere | hotter, weaker upper mantle beneath the lithosphere, which deforms slowly over geological time |
| tectonic plate | large moving section of lithosphere |
| plate margin | zone where two plates meet and interact |
| convection | transfer of heat by movement within a fluid or deformable material; one process involved in mantle heat transfer |
| ridge push | gravitational force helping move oceanic lithosphere away from an elevated mid-ocean ridge |
| slab pull | force produced as dense, sinking oceanic lithosphere pulls the rest of its plate towards a subduction zone |
| constructive margin | divergent boundary where plates move apart and new crust forms |
| destructive margin | convergent boundary where denser oceanic lithosphere descends beneath another plate and crust is recycled |
| conservative margin | transform boundary where plates slide horizontally past one another |
| collision margin | convergent boundary where buoyant continental crust collides and compresses rather than readily subducting |
| subduction | descent of one plate beneath another into the mantle |
| fault | fracture or zone of fractures along which rock has moved |
| focus / hypocentre | point within Earth where an earthquake rupture begins |
| epicentre | point on the surface directly above the earthquake focus |
| seismic wave | energy travelling through Earth from an earthquake source |
| P wave | compressional seismic wave that travels through solids and liquids |
| S wave | shear seismic wave that travels through solids but not liquids |
| aftershock | smaller earthquake occurring in the same region after a larger mainshock as stress adjusts |
| magnitude | estimate of the size of an earthquake at its source using a specified scale, such as moment magnitude |
| intensity | measure of shaking or observed effects at a particular location |
| liquefaction | loss of strength in water-saturated sediment during shaking, causing it to behave more like a liquid |
| tsunami | series of long waves usually caused by sudden displacement of a large volume of water |
| magma | molten or partly molten rock beneath Earth's surface |
| lava | magma that reaches Earth's surface |
| viscosity | resistance of a fluid such as magma to flow |
| volcanic arc | curved chain of volcanoes commonly formed above an oceanic subduction zone |
| shield volcano | broad volcano built mainly from relatively fluid lava flows |
| composite volcano | steep-sided volcano built from alternating lava, ash and other deposits |
| monitoring | repeated observation of processes or warning signals, such as ground movement or seismicity |
| prediction | forecast of an event's timing, location or size; exact earthquake prediction is not currently reliable |
| protection | measures such as building design that reduce the physical consequences of a hazard |
| planning | land-use, preparation, communication and evacuation arrangements intended to reduce risk |
| building code | rules specifying minimum safety or performance standards for structures |
| retrofitting | strengthening or adapting an existing building or system |
| residual risk | risk remaining after management measures have been put in place |
How the geography works
Tectonic hazards arise because Earth's outer rocky layer is broken into moving plates. Most earthquakes and many volcanoes occur near plate boundaries, where plates separate, collide or slide past each other. The movement is slow on human timescales, commonly measured in centimetres per year, but it can store or release enormous amounts of energy. At a locked fault, stress can build for decades or centuries before a rapid rupture produces an earthquake. At a volcanic system, rising magma and gas can fracture surrounding rock and reach the surface.
The physical process sets the hazard, but it does not determine the size of a disaster. Earthquake depth, magnitude, ground conditions, tsunami generation, population exposure, building strength, warning, access to services and preparedness all influence consequences. This chapter therefore uses two linked questions: why did the hazard occur here? and why did its effects vary between people and places?
Place example
This guide compares the Gorkha earthquake in Nepal (2015) and the Great East Japan earthquake and tsunami (2011) as examples. They are a suggested HIC and lower-income/NEE pair, not a fixed AQA requirement. Nepal lies within the collision zone where the Indian Plate moves beneath and collides with Eurasia. Japan is an island arc at the meeting of several plates; the 2011 event occurred on the Japan Trench subduction interface off the Tohoku coast. The physical settings help explain why Nepal experienced damaging shaking across a mountainous region while Japan's offshore rupture displaced the sea floor and generated a destructive tsunami.
Use the pair to explore interaction rather than to rank countries. Nepal's resources, housing, terrain and access shaped its rescue and reconstruction needs. Japan's planning, construction, monitoring and response capacity reduced some risks, but coastal exposure and the tsunami-driven Fukushima emergency created long-term displacement. Each event has different boundaries and scales, so the later comparison section explains which figures can be paired and which require qualification.
Maps, data and evidence
Start with a global plate map to locate the collision belt through the Himalayas and the subduction zone at the Japan Trench. Add an earthquake-depth or epicentre map to test how events cluster around active margins; a volcano map can show subduction arcs and constructive margins. For a named event, a locator map should identify the epicentre, affected region, capital or major settlement, coastline, mountain relief, key routes and any tsunami or evacuation zone relevant to the question. A map that shows only a star for the epicentre cannot explain the full distribution of impacts.
Use the USGS Nepal event page for the earthquake's magnitude, depth and tectonic summary. For Nepal's effects and recovery needs, the government-led Post Disaster Needs Assessment is the more suitable source. For Japan, the Reconstruction Agency provides the published casualty, building-damage and evacuation summary; Japan Meteorological Agency material helps locate the offshore event and interpret tsunami observations. These sources answer different questions. Keep their event dates, definitions and reporting cut-offs attached to the numbers when making notes.
When reading any earthquake map or table, check its date range, magnitude threshold, coordinate system, scale, units and legend. An epicentre marks the surface point above the focus; it does not mark the boundary of damage. Tsunami observations vary by coastal location and measurement type, so a local maximum should not be described as a uniform height along an entire coastline. Pair mapped hazard evidence with population, buildings, services and access data to explain why consequences vary from place to place.
1. Earth's structure and plate tectonics theory
The layers relevant to plate movement
Earth has a dense metallic inner core and liquid outer core, surrounded by a silicate mantle and a thin outer crust. The crust and the rigid uppermost mantle together form the lithosphere. The lithosphere is broken into large and smaller plates. Beneath it, the asthenosphere is hot and weak enough to deform slowly over long periods, although it is solid over short timescales. Plates move over this deformable zone; they do not float on a global ocean of liquid magma.
Oceanic crust is generally thinner and denser than continental crust. New oceanic crust forms at spreading ridges and becomes older as it moves away. When it is sufficiently cold and dense, it can descend beneath another plate at a subduction zone. Continental crust is generally more buoyant and resists being pushed deep into the mantle. When two continental plates converge, they can crumple, thicken and uplift to form high mountain belts such as the Himalayas.
Tectonic plates move relative to one another. Their interiors are usually less tectonically active than their margins, although intraplate earthquakes and hotspot volcanoes show that activity does not occur only at boundaries. A boundary is a broad interacting zone in some places, not always a single neat line. Small plates and complex fault systems complicate maps of plate motion.
How plate movement is driven
Heat from Earth's interior drives slow movement in the mantle and helps power the plate system. In a simplified model, hot mantle material rises, spreads beneath the lithosphere, cools and sinks. However, it is misleading to imagine a single set of circular conveyor belts dragging every plate at the same speed. Plate motion is influenced by several forces, including slab pull, as a dense descending plate pulls on the rest of the slab, and ridge push, as elevated new crust at a ridge moves downslope under gravity. Mantle flow, resistance at plate boundaries and the shape of plates also matter. The balance varies between plate settings.
The theory became accepted after evidence accumulated from different sources. Alfred Wegener's early continental-drift argument noted that continental coastlines appear to fit, especially parts of South America and Africa. Matching fossils, rock formations and ancient climate evidence occur on continents now separated by oceans. These observations suggested that continents had once been joined, but Wegener could not explain a convincing mechanism for movement.
Later evidence from the ocean floor strengthened the theory. Sonar mapping revealed mid-ocean ridges and deep-sea trenches. Oceanic crust is youngest near spreading ridges and becomes older farther away. Symmetrical magnetic stripes on either side of some ridges record reversals in Earth's magnetic field as lava cooled; this supports repeated creation and outward movement of oceanic crust. Sediment tends to be thinner close to ridges than on older ocean floor. The pattern of shallow and deep earthquakes around subduction zones fits descending slabs.
Modern Global Navigation Satellite System (GNSS) measurements directly record plate motion over years. They confirm that plates move at different rates and directions. No single clue proves the whole theory on its own; the strength comes from evidence that fits together across geology, geophysics, oceanography and direct measurement. The USGS plate-tectonics resources and This Dynamic Earth: understanding plate motions explain the supporting evidence and different boundaries.
2. The global distribution of earthquakes and volcanoes
Earthquakes form belts and clusters
A world map of earthquake epicentres shows concentrations around the edges of the Pacific Ocean, through parts of the Mediterranean–Asia region, along mid-ocean ridges and in major continental rift zones. The circum-Pacific belt includes subduction zones, island arcs and transform margins. The Mediterranean–Himalayan belt records convergence from southern Europe towards the Himalayas. Mid-ocean ridges have frequent shallow earthquakes associated with plates moving apart. Continental collision belts contain earthquakes where crust is compressed, folded and faulted.
Most earthquakes occur where plate movement is concentrated. Friction can lock a fault even while plates continue to move. Stress increases in the surrounding rock until the fault suddenly slips. Seismic waves radiate out from the rupture. Not every earthquake lies precisely on the mapped boundary: the boundary may be broad, local faults can extend inland, and plate interiors can contain inherited zones of weakness. Some intraplate earthquakes occur far from active margins and can still cause damage.
Volcanoes are common at some, not all, margins
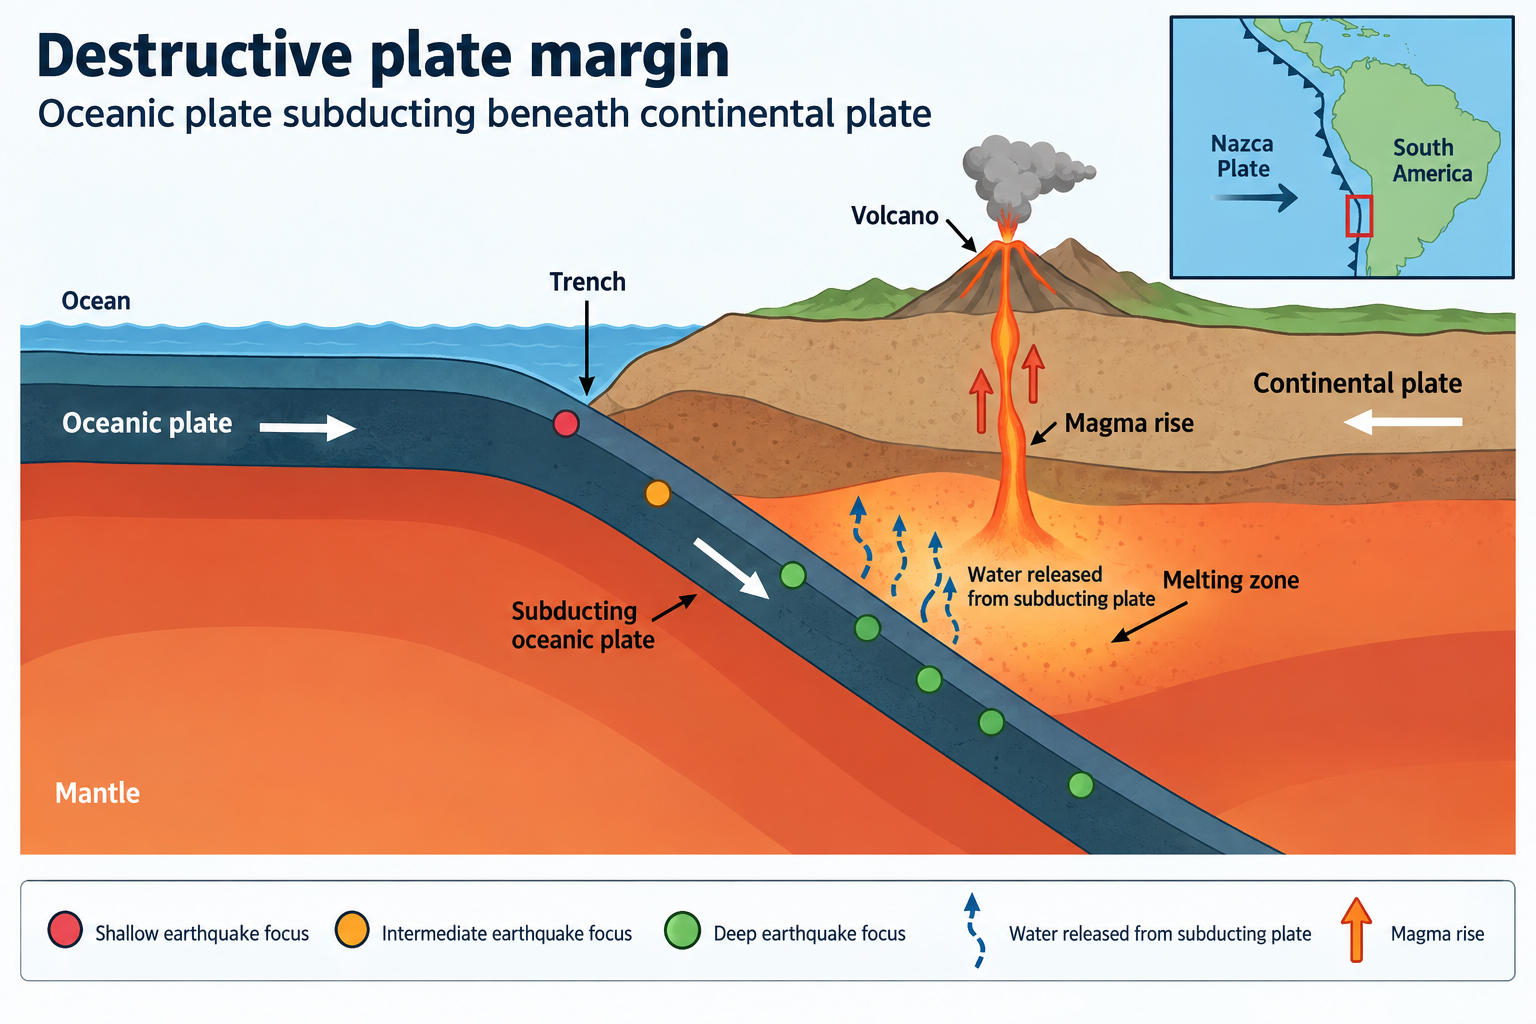
Volcanoes cluster strongly around the Pacific “Ring of Fire”, at some island arcs and continental margins above subduction zones, and at constructive boundaries such as ocean ridges and rift zones. At a destructive margin, water and other volatile materials released from the descending slab help melting in the mantle wedge above it. Magma can rise and feed volcanoes. At a constructive boundary, plates separate and magma rises to fill the gap, creating new crust. An eruption may occur at the surface or under the sea.
There are few volcanoes at conservative margins because plates slide past horizontally without a large volume of magma being produced by the boundary process. Continental collision margins such as the Himalayas are earthquake-active but generally lack the same subduction-related volcanic arc: buoyant continental crust resists sinking. These distinctions help explain why “all plate boundaries have volcanoes” is incorrect.
Some volcanoes form within plates above hotspots. A mantle plume or long-lived zone of melting can generate a chain of volcanoes as a plate moves over it; the Hawaiian Islands are a well-known example. Hotspots are not necessarily a simple static column of extremely hot material, and the details differ between systems. Their existence explains why volcanoes are not confined to plate boundaries.
Why maps need interpretation
A global epicentre map is a record of detected earthquakes during a selected period, not a complete forecast of future events. Instrument networks have improved, so more small events are detected now than in the past. A map showing all magnitudes will be dense near some active regions; filter thresholds, date range, depth and reporting agency affect its appearance. An absence of plotted points does not prove that an area has no hazard.
A map of volcanoes can combine active, dormant and extinct systems depending on the source's definitions. Volcano status is not a simple on/off switch: classification depends on recorded activity, geological evidence and a timescale. A student should read the map key and date, then describe clustering in relation to boundaries and hotspots. Do not infer a precise probability from a distribution map alone.
3. What happens at plate margins
Constructive (divergent) margins
At a constructive margin, plates move apart. The lithosphere stretches and fractures; pressure on mantle rock falls, encouraging partial melting. Basaltic magma rises through fissures and cools to form new oceanic crust. A long underwater mountain chain called a mid-ocean ridge develops. In a continental setting, rifting can create a valley system as crust thins and blocks move down along faults; if separation continues, a new ocean basin may eventually form.
Earthquakes at divergent margins are generally shallow. They are caused by faulting as the crust stretches and by movement of magma. Eruptions often involve relatively fluid basaltic lava that can travel some distance; gases can still create explosive events, so “constructive means harmless” is wrong. On land, fissure eruptions and volcanic fields may build broad shield volcanoes. Offshore eruptions can add new material to the sea floor.
Destructive (convergent) margins with subduction
At a destructive margin, plates move towards one another. Where oceanic lithosphere meets continental lithosphere, the denser oceanic plate descends beneath the more buoyant continental plate. The descending slab bends into a trench. It carries water and hydrated minerals downward; water released into the hot mantle wedge lowers the melting point and promotes partial melting. Magma forms in the mantle above the slab and can rise through the overriding plate. It is not simply “the whole plate melts because it rubs against the mantle.”
The plates do not glide smoothly along the boundary. Parts of the interface may lock because of friction while convergence continues. Elastic strain builds in rocks on and around the locked section; eventual rupture releases energy as an earthquake. The focus is the point where rupture starts; the epicentre is the surface point above it. The rupture can spread along a large area of the fault, and several sections may slip by different amounts. A shallow, long rupture beneath the sea can displace the seabed and produce a tsunami.
Earthquakes can occur along the descending slab at a range of depths, forming an inclined zone. Some subduction events are shallow near the trench; others occur deeper inside the slab. A shallow earthquake can be especially damaging near a populated coast, while a deep earthquake's surface shaking pattern can differ. Local geology and building response affect shaking intensity as well as source magnitude.
Magma at subduction zones can be more silica-rich and viscous than basaltic magma. Viscous magma resists flow and can trap gas, allowing pressure to build. Eruptions may be explosive, producing ash, pyroclastic flows, lava domes or lahars. Composition varies and this is a broad pattern, not a rule that every volcano at every subduction zone behaves identically. A chain of volcanoes above a subducting plate can form an island arc or continental volcanic arc.
Where two oceanic plates converge, the older or denser plate may subduct, forming a trench and an island arc. Where two continental plates converge after an ocean basin closes, neither plate sinks easily; crust shortens and thickens, creating fold mountains and strong earthquakes. These settings show why “destructive boundary always means a volcano” is incorrect.
Conservative (transform) margins
At a conservative boundary, plates slide horizontally past one another. Friction can lock sections of a fault, storing strain. A sudden slip releases that strain and sends out seismic waves. Because no large area of crust is being created or consumed at the boundary, conservative margins do not usually produce volcanoes through the boundary process. They can generate shallow and damaging earthquakes, particularly where faults pass beneath populated areas.
A transform boundary can link other boundary systems on the ocean floor. On land, a visible fault trace may be offset by streams, roads or ridges over geological time. Not every earthquake occurs on the main mapped fault, and a complex fault network can distribute rupture. A fault's surface expression, length, depth and locking behaviour influence hazard, but a map cannot reveal every detail.
Earthquakes: from rupture to ground shaking
An earthquake begins when rock on a fault suddenly slips after stress exceeds the frictional resistance. Energy travels away as seismic waves. P waves compress and expand the material in their path and can move through solids and liquids. S waves shear material and travel through solids but not through liquids. Surface waves travel near the ground and can produce prolonged movement. The sequence and strength of waves depend on the source and route through Earth.
The earthquake focus is the rupture's starting point; the epicentre is the point at the surface above it. These are not necessarily where the worst damage occurs. A rupture may extend for many kilometres, and local shaking can be intensified by soft sediments or basin shape. Distance from the source, depth, direction of rupture, building design and ground conditions all matter.
Earthquake magnitude measures the event at its source using a specified scale. Modern reports commonly use moment magnitude (Mw), based on properties of the fault rupture. A magnitude increase of one unit represents a large, logarithmic increase in source size/energy, rather than a simple one-unit linear increase. Intensity describes shaking or observed effects at a location, so it varies across the affected region. Agencies may publish slightly different magnitudes because methods and data differ; cite the scale and source rather than saying “the Richter scale” for every modern event.
Aftershocks occur as stress adjusts around a main rupture. They may continue for days, months or longer and can damage structures already weakened. The largest aftershock may itself be damaging. Scientists can estimate changing aftershock probabilities, but cannot name the exact time and place of the next earthquake. A foreshock is identified as such only after a larger earthquake follows; beforehand it cannot reliably be distinguished from other small events.
Secondary hazards linked to earthquakes
Strong shaking can cause building collapse, surface rupture and falling objects. It may trigger liquefaction where loose, water-saturated sediment loses strength, causing buildings to tilt or ground to settle. Slopes can fail, producing landslides or rockfalls. Fires can start when gas and electricity systems break. Dams, bridges, hospitals, ports and water or power networks can be damaged. These impacts can cascade: a damaged bridge cuts off rescue access; power loss stops water pumps; contaminated water raises health risks.
An undersea earthquake creates a tsunami only when it displaces a large volume of water, usually through vertical seabed movement. Many earthquakes beneath the sea do not produce a destructive tsunami. Tsunami waves in deep water can travel quickly with low height, then slow and grow in shallower coastal water. Warning time depends on distance from the source and the monitoring network. Coastal topography, tide, bays and river mouths change inundation patterns. A tsunami is not a single ordinary wind-generated wave and its danger can persist after the first arrival.
Volcanoes: magma, eruptions and hazard types
Magma contains molten rock, crystals and dissolved gases. Its viscosity and gas content influence how it moves. Low-viscosity basalt can flow readily and may create long lava flows. More viscous magma may trap gas; pressure can build and result in explosive fragmentation. However, volcanic behaviour is complex: magma supply, temperature, composition, water, conduits and interactions with groundwater influence eruption style.
Volcanic hazards include lava flows, ash or tephra fall, pyroclastic density currents, volcanic gases, landslides, lahars and sometimes tsunamis. A pyroclastic flow is a fast-moving hot mixture of gas, ash and rock that can travel down slopes. A lahar is a flow of water mixed with volcanic debris; it may occur during or long after an eruption when rain or melting snow mobilises ash. Ash can disrupt breathing, roofs, engines, aviation, water supplies and agriculture even far from the volcano. Gas can collect in low-lying areas or affect crops and health.
Volcanoes can also create useful land and resources. Weathered volcanic material can develop fertile soils; geothermal energy, minerals and tourism can support livelihoods. Benefits are not guaranteed or equally shared, and they do not cancel the hazard. A community may value employment and place attachment while facing evacuation and recovery costs.
4. Monitoring, prediction, protection and planning
AQA groups risk reduction into four useful themes. A strong answer explains what each method observes or changes, who can use it, and why the strategy cannot eliminate risk.
Monitoring
Monitoring records changes associated with tectonic activity. Seismometers detect ground motion and help locate earthquakes. A network can compare the arrival times of P and S waves to estimate an epicentre; three or more stations improve the location. GNSS instruments and satellites can measure gradual ground deformation. Tiltmeters detect changes in slope angle. Volcanologists may monitor gas composition, temperature, gravity, seismicity, crater lakes and surface emissions. Thermal and radar satellite imagery can detect changes where ground teams cannot safely travel.
Monitoring supports hazard assessment, research and sometimes warning. Rising seismicity or ground deformation may indicate magma movement, but a volcano can show unrest without erupting, and some eruptions occur with little obvious warning. Earthquake monitoring cannot provide an exact advance prediction of the next rupture. Data require trained analysis, maintenance and communications; a sensor without a functioning network does not protect people by itself.
For tsunamis, seismic networks, ocean-bottom pressure sensors, tide gauges and warning centres can detect earthquakes and monitor sea-level changes. A near-source tsunami can reach land before there is time for a distant agency to issue a warning. Natural signs—strong or long shaking, sudden sea retreat or a loud ocean roar—should be understood as a cue to move to higher ground where local guidance advises this. People should not wait at the shore to confirm a warning.
Prediction, forecasts and early warning
A prediction attempts to state when, where and how large a future earthquake will be. Exact earthquake prediction is not currently reliable. Scientists can map long-term hazard, estimate probabilities for a fault system, identify changing patterns and forecast likely aftershocks. These statements are useful for building standards and planning, but they do not provide a precise date for evacuation.
An earthquake early-warning system is different from earthquake prediction. It detects rupture after it has begun and may send an alert to locations that have not yet experienced the strongest shaking. Because electronic signals travel faster than damaging seismic waves, some users may gain seconds to take a protective action or automatically slow trains and shut equipment. People close to the epicentre may receive little or no lead time. Such warnings reduce exposure to some effects but cannot stop the earthquake or guarantee that everyone is alerted.
Volcanic forecasts can combine monitoring, past behaviour and physical models to estimate the likelihood of an eruption in a time window. Authorities may raise an alert level and order evacuation when evidence indicates increasing danger. Uncertainty creates difficult decisions: evacuating too early has economic and social costs; waiting too long can expose people. A clear public explanation and evacuation route are essential.
Tsunami warning systems estimate potential tsunami generation from earthquake location, depth, magnitude and seafloor movement, then update forecasts with sensor measurements. A forecast can communicate estimated arrival times and likely coastal effects; local variation remains. Warning messages need common terms, accessible formats, redundant communication and a clear instruction. A phone alert cannot help if the network or electricity is down or if the household lacks a safe route.
Protection: safer structures and infrastructure
Protection reduces the physical vulnerability of buildings and lifelines. Earthquake-resistant design aims to prevent collapse and protect life; it does not necessarily guarantee that a building will be undamaged or usable immediately after strong shaking. Engineers can use flexible frames, shear walls, cross-bracing, base isolation, dampers, ductile connections and secure foundations. Appropriate designs depend on shaking, soil, building height, use, cost and construction quality.
Building codes set minimum standards. Their effectiveness depends on whether they apply to new buildings and critical infrastructure, are updated using research, can be inspected, and are followed in construction. Retrofitting strengthens older buildings but can be costly and disruptive. Schools, hospitals, bridges and emergency operations centres may be prioritised because their failure would cause cascading effects.
Communities can protect water, gas, power and communications systems by using flexible joints, automatic shut-off valves, backup supplies and alternative routes. Fire protection, emergency access, safe shelters and tsunami vertical-evacuation buildings can also reduce harm. No design is universal: a tsunami-resistant coastal refuge must be high enough, accessible, structurally sound and maintained; warning and evacuation remain necessary.
Protection has limits. A structure is designed for a stated range of shaking or water level, and a rarer event may exceed it. Defences can create a false sense of security and encourage development in a hazardous area. A wall can block normal access to the sea or shift coastal impacts. A well-built home may still be surrounded by destroyed roads and utilities. Evaluate the full system, not just one building.
Planning and preparedness
Planning reduces exposure and improves the ability to act. Hazard maps can guide land-use decisions, locate schools and hospitals away from the most hazardous areas where possible, and identify evacuation routes and shelters. Risk-sensitive planning considers new development, future population, critical services, historic settlement patterns and the needs of people who cannot evacuate without assistance. Zoning is difficult when safe land is limited or when housing is unaffordable; relocation should include livelihoods, services and community consent.
Preparedness includes drills, public education, emergency kits, family contact plans, school evacuation practice, clear warning signals and agreements among agencies. Community exercises can reveal blocked routes, inaccessible shelter or gaps in communication before an event. People who know how to drop, cover and hold during strong shaking may reduce injury indoors; the correct action depends on location and official guidance. Near a coast, earthquake and tsunami education can help people act without waiting for a text alert.
Planning for response identifies who coordinates rescue, health care, temporary shelter, food and water, debris removal, transport and communications. Redundant routes and local supplies can help when the main network fails. Plans should include people with disabilities, older people, children, tourists and people who do not speak the main warning language. Risk communication should be trusted, concise and repeated through multiple channels.
Comparing strategy effectiveness
| Approach | What it can reduce | Main limitation or trade-off |
|---|---|---|
| Monitoring | uncertainty about current activity; may improve hazard assessment and warnings | signals can be ambiguous; networks need coverage, expertise and maintenance |
| Prediction / forecast | can estimate probabilities or evolving volcanic and tsunami conditions | exact earthquake timing cannot be forecast; false alarms and uncertainty affect decisions |
| Early warning | gives some people seconds or minutes to protect themselves, shut equipment or evacuate | warning time varies; people near the source may receive none; response must be feasible |
| Building protection | lowers collapse risk and protects lifelines | cost, old stock, poor enforcement and events beyond design limits |
| Land-use planning | can limit new exposure in the most hazardous areas | safe land, housing and livelihoods may be limited; existing settlements remain |
| Public preparedness | helps people interpret warnings and act quickly | training fades, access differs and a drill cannot prevent structural damage |
| Emergency response | can rescue survivors, provide care and restore services | access, supplies, aftershocks, terrain and scale can overwhelm capacity |
A balanced conclusion recognises that no method is a guarantee. The most effective programme layers measures: monitoring informs planning; codes strengthen buildings; warnings and routes enable evacuation; emergency services respond; recovery improves safety. Strategies need maintenance and community participation. Ask whether they reduce exposure, vulnerability, event consequences or recovery time, and who benefits.
5. Case study A: Nepal earthquake, 25 April 2015
Location and tectonic setting
Nepal lies where the Indian Plate moves northwards into the Eurasian Plate. The collision uplifted the Himalayas and continues to create tectonic stress. The USGS event summary records a moment magnitude 7.8 earthquake on 25 April 2015, about 80 km north-west of Kathmandu, at a depth of about 8 km. The earthquake resulted from thrust faulting on or near the Main Himalayan Thrust interface. USGS gives convergence of roughly 45 mm each year in the region; a portion contributes to Himalayan uplift. The rate and plate geometry vary locally.
A thrust fault forms under compression: one block moves up relative to another along a low-angle fault. The earthquake occurred within the collision zone, where the Indian plate underthrusts Eurasia. A major rupture released accumulated strain and produced strong shaking across central Nepal. A powerful magnitude 7.3 aftershock occurred on 12 May, and many smaller aftershocks followed. The sequence complicated rescue and reconstruction because damaged buildings and slopes could be shaken again.
The region's mountainous relief and fractured geology created secondary hazards. Landslides blocked roads and trails, isolated villages and changed river channels. Avalanches occurred in high mountain areas, including on Mount Everest. Kathmandu's urban buildings, historic structures, roads, water systems and population were exposed, while remote settlements faced difficult access. The earthquake therefore affected both a major city and high mountain districts, but not in the same way.
Effects: people, buildings and services
The Nepal Government's Post Disaster Needs Assessment (PDNA), supported by development partners, reported close to 9,000 deaths and more than 22,000 injuries across the 2015 earthquake sequence. The World Bank's summary of the PDNA records about 755,000 houses destroyed or significantly damaged, and total damage and losses of approximately US$7 billion. Recovery needs were estimated at about US$6.7 billion. Figures can differ slightly between sources because some combine the April mainshock with the May aftershock and use different reporting dates.
Social effects included deaths and injury, homelessness, disruption to schooling and health care, and loss of cultural heritage. Hundreds of historic buildings and temples were damaged or destroyed, including monuments in Kathmandu Valley. Families whose homes were unsafe or destroyed needed temporary shelter, while aftershocks and monsoon rainfall added danger for people living in tents or temporary structures. The PDNA estimated that millions of people were affected; “affected” includes more than fatalities and does not mean that every person experienced the same loss.
Housing damage was widespread. The PDNA found that many houses were built from unreinforced masonry and other construction that performed poorly under strong shaking. In some rural areas, heavy stone or brick walls and weak connections increased the chance of collapse. Building quality varied with materials, construction skills, maintenance, wealth and access to engineering. This physical vulnerability interacted with exposure: houses and people were located across a large mountainous region, including areas where relief made rescue and supply access difficult.
Economic effects included damage to homes, businesses, roads, bridges, irrigation, electricity and tourism assets. Landslides and damaged routes interrupted trade and access to markets. The US$7 billion estimate includes assessed damage and losses across sectors; the number is large relative to Nepal's economy and therefore constrained national recovery resources. It does not measure every cultural loss, household stress or unpaid care burden. Tourism and trekking were disrupted, but the effect differed by region and time.
Environmental and secondary effects included slope failure, river blockage, sediment movement and risks from aftershocks. When a landslide blocks a river, water can build behind the debris and later release suddenly. Such a process can create a downstream flood hazard. The main earthquake also triggered avalanches in high mountain areas. These effects show how an earthquake can start a cascade beyond the immediate shaking zone.
Immediate responses
Nepalese residents, local authorities, the Nepal Army, police, health workers and emergency services began rescue, first aid and evacuation. The government activated coordination and emergency arrangements. Search and rescue teams from other countries and humanitarian organisations arrived, alongside medical support, shelter, food, water and other relief. India launched Operation Maitri, providing rescue teams and assistance. These actions increased capacity, but the response faced constraints: landslides, damaged roads, poor weather, remote settlements, aftershocks and limited airport or storage capacity.
The international response depended on access. Tribhuvan International Airport in Kathmandu became an important entry point for personnel and supplies, but airfield capacity and logistics limited throughput. Mountain villages could be reached only by road, foot or helicopter, and weather could interrupt flights. A map distance of a few kilometres did not mean rapid access where a trail had collapsed or a valley was cut off. Recovery resources had to be moved through a transport system already under strain.
Emergency shelter was necessary for households whose homes had collapsed or were unsafe. Tents and temporary accommodation provided immediate protection but were not suitable long-term solutions, especially with monsoon weather approaching. Medical teams treated injuries and set up services, while agencies assessed damage and needs. The PDNA used sector teams to identify effects and estimate recovery priorities; this systematic assessment helped coordinate longer-term financial pledges and reconstruction planning.
Immediate response effectiveness should not be judged only by the amount of international assistance. Local knowledge and national institutions are essential; international teams can supplement capacity but require coordination, translation, access and a clear division of tasks. When many agencies arrive, overlapping supplies or mismatched priorities can occur. Nepal's mountainous conditions and damaged transport routes meant that the hardest-to-reach places could receive assistance later than the capital.
Long-term responses and recovery
The Government of Nepal established reconstruction arrangements and a National Reconstruction Authority. A donor conference in June 2015 organised international support; the World Bank describes pledges of around US$4.4 billion for recovery and reconstruction. A major goal was rebuilding houses more safely rather than simply replacing the same vulnerable structures. The government and partners used owner-driven reconstruction: eligible households received staged grants and technical guidance to construct or repair houses that met safer standards.
The World Bank's reconstruction programme report says its housing project supported more than 330,000 homeowners in affected districts, with resilient techniques, training for masons and engineers, and institutional support. This is a programme result, not a claim that every damaged home in Nepal was rebuilt or that all households received equal assistance. The eligibility process, land documentation, technical inspections and available labour affected access.
Reconstruction was slow for some families. A household may need to clear debris, prove eligibility, secure land rights, gather its share of costs, source materials and wait for technical checks. Remote sites can face transport costs, seasonal isolation and limited skilled labour. Some people initially rebuilt with temporary materials while waiting for grants or because they could not meet programme requirements. A safer house is valuable, but its benefits depend on water, sanitation, roads, schools, health care and livelihoods also being restored.
Long-term strategies included rebuilding public infrastructure, schools, health services, roads and heritage sites; strengthening building rules; training local construction workers; and supporting livelihoods. The PDNA recommended “build back better” measures, risk-sensitive settlement planning and inclusion. These plans created an opportunity to reduce future vulnerability, but implementation depended on administrative capacity, funding, political coordination, land availability and the participation of affected communities. A policy goal should not be confused with an achieved outcome.
Why impacts were severe and uneven
Nepal's tectonic setting meant powerful earthquakes were a known hazard, but the precise time and place could not be predicted. High exposure in Kathmandu and settlements across the affected districts met vulnerable building stock. Poverty and limited resources constrained retrofitting and emergency capacity, but income is not the sole explanation: building material, construction practice, local site conditions, time of day, relief and access to rescue all mattered. Many people in mountainous areas faced travel isolation; people in different districts experienced different shaking and damage.
The earthquake occurred on a Saturday at 11:56 local time. The time of day affected whether people were indoors, at school, at work or outside, but this is only one influence and does not alone explain the casualty total. A large aftershock on 12 May prolonged fear and created new impacts. A fair account uses physical evidence and social geography together rather than saying simply that Nepal was poor.
6. Case study B: Great East Japan earthquake, 11 March 2011
Location and tectonic setting
At 14:46 Japan Standard Time on 11 March 2011, a magnitude 9.0 earthquake occurred offshore from north-eastern Japan. The Japan Meteorological Agency records the hypocentre about 130 km east-south-east of the Oshika Peninsula at a depth near 24 km. The Japan Reconstruction Agency identifies this as the largest earthquake recorded in Japan. It took place at the Japan Trench, where the Pacific Plate subducts beneath the plate carrying north-eastern Japan. Long-term convergence had locked parts of the plate interface, allowing stress to build before a large megathrust rupture.
The rupture displaced a wide section of the sea floor and generated a destructive tsunami along the Pacific coast of the Tohoku region. Japan sits near several active plate boundaries and experiences frequent earthquakes; the country has invested in seismic monitoring, building standards, tsunami warnings, drills and emergency management. The Tohoku event nevertheless exceeded earlier assumptions about the size and extent of the tsunami in some areas. A large earthquake offshore can create several connected emergencies in a matter of minutes.
Effects of the earthquake, tsunami and nuclear accident
The Japanese Reconstruction Agency reports 19,729 deaths, 2,559 missing and 6,233 injured in its published summary; because missing-person status and statistical cut-off dates vary, its page should be cited when using these totals. It reports about 121,996 buildings completely destroyed, 282,941 half destroyed and 748,461 partially destroyed. More than 470,000 people were evacuated from their homes during the disaster. These figures describe the broader Great East Japan disaster, which included the earthquake, tsunami and Fukushima nuclear accident.
The tsunami was the dominant direct cause of many deaths and extensive coastal destruction. Water inundated homes, ports, roads, railways, farmland and industrial sites. Some coastal settlements had sea walls and tsunami shelters, but water exceeded or overtopped defences in places. The tsunami damaged lifelines including electricity, gas, water, road and rail connections. Destruction at Sendai Airport and damage to transport routes affected both daily life and emergency access.
The tsunami disabled power and cooling functions at Fukushima Daiichi Nuclear Power Station, causing a nuclear accident. The Japanese government established evacuation zones around the plant; the Reconstruction Agency reports roughly 110,000 people evacuated in relation to the nuclear emergency. Evacuation continued for years for some communities, adding displacement, livelihood loss, family separation and uncertainty. The nuclear accident was a technological disaster triggered by the natural hazard sequence; it should be described as a cascading impact, not as a direct earthquake effect.
Japan's Cabinet Office estimated direct financial damage at about 16.9 trillion yen as of June 2011, while the World Bank estimated that total economic cost might reach US$235 billion. These are different estimates with different methods and currencies; do not add them together. Monetary totals are not a full measure of harm. They omit or undervalue cultural loss, long-term mental health, ecosystem damage and the experience of displaced communities.
Immediate responses
The national government established an emergency response headquarters shortly after the earthquake. Police, fire services, the Coast Guard and Self-Defence Forces carried out search, rescue, evacuation and relief operations across a large affected area. Japan's Reconstruction Agency retrospective documents a maximum of about 107,000 Self-Defence Force personnel deployed in the response and extensive fire and police assistance from unaffected prefectures. International support included rescue teams and supplies; the US operation known as Operation Tomodachi supported search and rescue, transport and relief logistics.
Tsunami warnings and evacuation instructions were issued. People moved to higher ground, designated shelters or inland areas; schools and local authorities carried out evacuation procedures. The first warning estimates did not fully capture the eventual tsunami scale in every place. Some sea walls were overtopped, and the time between the earthquake and tsunami varied along the coast. This illustrates a key limitation: even a well-developed warning and preparedness system can be challenged when the hazard exceeds the scenario anticipated or when communication and access fail.
Emergency services faced damaged roads, flooded settlements, winter conditions, power disruption, isolated communities and many missing people. Relief teams cleared routes and delivered water, food, fuel and medical support. The nuclear emergency required additional protective actions, evacuation planning and monitoring around Fukushima. A strong national capacity supported a rapid large-scale response, but it did not prevent all casualties or displacement.
Long-term responses and reconstruction
The national government created a dedicated Reconstruction Agency in 2012 to coordinate long-term recovery and revitalisation. Rebuilding included housing, roads, rail, ports, utilities, schools and public services. In some locations, reconstruction raised land or relocated housing to higher ground; coastal protections and new or improved sea walls were also built. Planning sought to reduce future tsunami exposure and maintain essential services, though each measure had costs, design limits and local consequences.
Reconstruction took many years. Residents in some towns had to decide whether to return, move to higher ground or relocate elsewhere. Higher embankments can offer protection against more frequent or lower-level events but may alter views, access to the sea, tourism and community connections. Raising a settlement can reduce exposure yet require major earthworks and can separate housing from original neighbourhoods. Measures may be effective physically while creating social trade-offs.
Fukushima recovery involved decontamination, restrictions, monitoring, compensation and gradual lifting of evacuation orders where officials considered conditions suitable. The number of evacuees declined over time, but some people did not return because homes, employment, schools or communities had changed. Psychological stress and uncertainty persisted. Reconstruction therefore cannot be evaluated only by counting buildings repaired or roads reopened.
Why Japan still suffered major impacts
Japan had substantial capacity: earthquake-resistant construction, monitoring, public drills, warning systems, emergency services and financial resources. These helped limit some earthquake damage and enabled a large response. But the event combined an exceptionally large offshore earthquake with a tsunami that inundated coastal areas and a technological cascade at Fukushima. Exposure was high in coastal settlements and critical infrastructure. The physical scale and sequence overwhelmed some protections, while the warning did not give every community sufficient understanding of the potential tsunami height.
Wealth reduced some forms of vulnerability but did not remove risk. Some older buildings, coastal defences or nuclear safety assumptions were not designed for every possible event. National capacity and local experience were uneven; people with mobility needs, older residents and communities in isolated areas could face different evacuation challenges. The event is a useful reminder that a high-income country can sustain extensive casualties, damage and long-term displacement.
7. Comparing Nepal and Japan
These examples have different tectonic contexts: Nepal's earthquake occurred within a continental collision zone, while Japan's occurred at an offshore subduction zone and generated a major tsunami. That physical difference matters when comparing consequences. Japan's M9.0 event cannot be treated as a controlled comparison with Nepal's M7.8 event because magnitude, depth, rupture geometry, location, secondary hazards, exposure and data definitions differ.
| Comparison dimension | Nepal, 2015 | Japan, 2011 |
|---|---|---|
| Tectonic setting | Continental collision; thrust faulting on/near the Main Himalayan Thrust | Offshore subduction megathrust at the Japan Trench |
| Main physical event | M7.8 earthquake, followed by strong aftershocks including M7.3 in May | M9.0 offshore earthquake and tsunami, followed by Fukushima nuclear accident |
| Major exposure | Kathmandu and many settlements across affected mountain districts; homes, heritage and transport routes | Long Pacific coastline, towns, ports, transport and utilities, plus nuclear infrastructure |
| Key vulnerability | Many vulnerable buildings; difficult mountain access; limited resources relative to recovery needs | Coastal exposure and tsunami assumptions; critical infrastructure and long-term evacuation needs |
| Capacity | National and local responders plus international support; large reconstruction financing need | Extensive monitoring, building measures, emergency services and substantial national response capacity |
| Long-term focus | Safer owner-driven housing reconstruction, infrastructure, heritage and livelihood recovery | Coastal reconstruction, relocation or land raising, infrastructure and Fukushima recovery |
| Main comparison caution | Figures often combine April and May events; access and house-damage definitions matter | Casualty, damage and evacuation totals refer to different cut-off dates and event components |
A good comparison explains mechanisms, not just differences. For example: “Japan had more developed warning and emergency capacity, but the tsunami exceeded some local assumptions and damaged critical infrastructure. Nepal's earthquake affected a large rural and urban area with many vulnerable houses and difficult mountain access, while its reconstruction needs were very large relative to the national economy.” This is more accurate than saying “Japan was safe because it was rich” or “Nepal suffered because it was poor.”
Use one or two matched measures and explain their limits. Comparing recorded deaths can highlight human impact, but the event magnitudes and tsunami differ. Comparing the percentage of houses damaged may be more meaningful than absolute totals, but the surveys must cover comparable areas and use compatible definitions. A financial comparison should account for the size of each economy, price year, currency and whether the figure is direct damage or total recovery need.
8. Why people live in tectonic hazard zones
People live in earthquake or volcanic regions for many reasons. Fertile volcanic soils can support agriculture. Geothermal energy and minerals can provide power and employment. Ports, cities, tourism and trade routes often developed in coastal or volcanic landscapes. Family, culture, heritage and attachment create strong ties. A home may be affordable only in a hazard-prone area, and moving may mean loss of work, land, school access, social networks or cultural sites.
Risk may be accepted because it is familiar, because the chance of a major event appears low in any one year, or because the benefits are immediate while the hazard is uncertain. Some people have no realistic alternative. Governments may also prioritise jobs, energy or infrastructure, and housing demand may push construction into exposed areas. In some places, strong planning and building rules enable continued settlement with reduced risk; in others, enforcement and resources are limited.
Hazard perception varies. A recent earthquake may increase concern; a long quiet period may reduce it. People may trust warnings, distrust authorities, or interpret signs through local knowledge. A strategy that assumes residents will leave permanently may fail if it does not address livelihoods and social support. Risk communication should explain uncertainty and practical action without blaming people who stay.
9. Tectonic risk management in practice
Earthquake risk reduction before an event
The most reliable earthquake risk reduction often reduces vulnerability and exposure rather than attempting to predict the exact earthquake. Building codes, retrofitting, land-use planning, emergency routes, public education and resilient lifelines can make a major difference. Older housing is a challenge: new codes do not automatically strengthen existing buildings. Grants, technical advice and staged programmes can help, but they need clear inspection and affordability.
Critical infrastructure should be planned as a connected system. Hospitals need power, water, transport, communications and staff. A bridge or port may be essential for relief; if only one route reaches an area, its failure can isolate a community. Backup systems and alternative routes reduce cascading effects. Risk maps should include ground conditions, population, building use, evacuation access and critical facilities, while protecting sensitive household data.
What monitoring can and cannot do for earthquakes
Seismic networks measure earthquakes and improve understanding of active faults and aftershock patterns. Satellite and ground-based geodesy measure slow deformation. Paleoseismology studies evidence of earlier earthquakes in sediments and landforms. These records support hazard maps and building standards. They do not reveal a precise date for the next major rupture.
Scientists can estimate the probability of earthquakes over a region and period, but uncertainty remains. Historical records may be short compared with earthquake recurrence, faults can have complex segmentation, and a previous event may not predict the next one. A probability is not a guarantee. The best use of long-term assessment is to prepare buildings, services and communities before the event rather than to wait for a prediction.
Early warning can help some places after rupture begins. Sensors detect initial waves; the system estimates the source and sends alerts before later, stronger shaking reaches more distant locations. The lead time may be seconds. Automated systems can pause trains, open firehouse doors or stop industrial processes. Public messages can prompt people to take cover. Errors, network interruption and short distance to the source limit effectiveness; early warning is not a promise that there will be time to evacuate a building.
Volcanic hazard management
Volcanic risk can often be monitored through seismicity, gas emissions, ground deformation, heat and changes to crater lakes. A combination of signals can support a forecast and alert-level decision. Scientists and authorities may close an area or evacuate when risk rises. The decision must balance the danger of remaining against the disruption and cost of evacuation. An eruption may change rapidly, so alerts need updates and clear routes.
Protection and planning include hazard-zone maps, exclusion zones near vents, ashfall advice, shelters, masks, safe water storage and plans for aviation and agriculture. People can be evacuated from some high-risk zones, but displacement can be economically damaging and culturally sensitive. Ash may affect a much larger area than lava, so plans must consider transport, roofs, water and health well beyond the volcano's slopes. Lahars can follow river valleys long after an eruption, so warning and land-use plans must account for secondary flows.
Tsunami management
A tsunami warning requires rapid earthquake detection, modelling and sea-level confirmation. Seismic data can indicate that a large undersea event occurred, while pressure sensors and tide gauges help assess whether a tsunami has formed and how it moves. Local warning systems need clear sirens, mobile messages, radio and community communication. Vertical evacuation structures and marked routes can help where high ground is distant, but must be accessible and designed for the expected hazard.
Preparedness can include regular evacuation drills, signs showing routes and safe elevations, and public understanding of natural warning signs. Warning centres share information across national borders because waves travel through ocean basins. A near-source tsunami can arrive before an international warning is processed, so local awareness is essential. Sea walls may reduce some impacts but should not replace evacuation: a larger-than-design tsunami can overtop or damage a defence.
10. Building a strong case-study answer
For each event, learn a compact evidence set rather than a long list of disconnected numbers:
- Location and date: name the place, region, event date and tectonic setting.
- Physical cause: identify the plates, margin or fault, movement, rupture or eruption process.
- Hazard characteristics: use magnitude, depth, shaking, tsunami or eruption information only with source and measure defined.
- Primary effects: select human, built and environmental impacts directly caused by the event.
- Secondary effects: explain at least one chain such as damage → service disruption → health or livelihood impact.
- Immediate responses: show what happened during the event and early aftermath, who acted and which needs were prioritised.
- Long-term responses: explain reconstruction and risk reduction, including who could access support and what remained unresolved.
- Comparison and judgement: explain how tectonic setting, exposure, vulnerability, capacity and event differences influenced outcomes.
For an “explain” question, build cause-and-effect links. For “compare,” use paired points about both places rather than two separate mini-essays. For “evaluate,” weigh effectiveness against costs, limitations and unequal impacts. Dates and figures support an explanation; they do not replace it. Always distinguish what the source reports from what you infer.
11. Interpreting case-study evidence and making a judgement
Treat each number as a measurement with a boundary
A case-study figure is useful only when you know what was measured, where, when and by whom. The Japan Reconstruction Agency's total of 19,729 deaths is a published administrative figure for the Great East Japan disaster. It includes the wider disaster context, in which tsunami inundation and the Fukushima nuclear emergency followed the earthquake. The Nepal PDNA reports close to 9,000 deaths across the 2015 earthquake sequence. These are not simply two measurements of “earthquake deaths”: the event boundaries and hazards differ. The figures show that both disasters caused very large human losses, but a direct ratio would conceal more than it explains.
The same caution applies to buildings. Nepal's estimate of about 755,000 houses destroyed or significantly damaged combines two categories. Japan's Reconstruction Agency lists separate totals for completely destroyed, half-destroyed and partially damaged buildings. “House,” “building,” “dwelling,” and “structure” are not automatically equivalent units. A school answer should retain the source's category rather than convert it into a seemingly precise comparison. If definitions differ, explain the contrast qualitatively and use the number to show scale within that event.
Financial statistics need similar care. Damage is the estimated value of physical assets destroyed or impaired. Losses are changes in economic flows, such as interrupted production or income. Recovery needs estimate resources for restoration and reconstruction, which may include safer standards. They answer different questions. Nepal's approximately US$7 billion damage-and-loss estimate and approximately US$6.7 billion recovery-needs estimate should not be treated as two calculations of the same thing. Nor should a dollar total be compared between countries without considering economic size, price year, currency conversion and the scope of the assessment.
Separate physical magnitude from human consequence
Magnitude describes the size of the earthquake source. It is not a score for the severity of every local impact. Shaking intensity varies with distance, depth, rupture direction, ground material, building design and event duration. A tsunami adds another spatial pattern: coastal shape, sea-floor form, local elevation, warning access and evacuation routes affect inundation and exposure. Two communities affected by the same earthquake can therefore experience very different consequences.
Japan's magnitude 9.0 event was larger than Nepal's magnitude 7.8 event, but the difference in magnitude alone cannot explain their casualty totals, damaged homes or recovery paths. The events occurred at different margin types and generated different secondary hazards. Japan's earthquake generated a major tsunami and the Fukushima nuclear emergency; Nepal's shaking affected a broad mountainous region where landslides, avalanches and difficult routes complicated access. The comparison should trace these physical pathways before evaluating social capacity.
Use the following sequence when a statistic appears in a source or examination insert:
- Name the indicator: deaths, injured people, evacuated households, damaged houses, direct damage or recovery need.
- Keep its boundary: event, area, category and reporting date.
- Identify its scale: people, buildings, currency, time period or proportion.
- Check what it cannot show: a total does not reveal distribution, inequality, long-term wellbeing or the cause of each impact.
- Connect it to a process: explain how shaking, water, slope failure, building performance, warning or access produced the pattern.
- Use a second source or measure where possible: corroboration and context make an argument more reliable.
Build a comparative judgement from matched evidence
A comparison becomes more convincing when its points are paired. For example, compare the role of access in each place: Nepal's steep terrain and damaged mountain routes made reaching some settlements difficult, while Japan's coastal inundation damaged roads, railways and utilities needed for response. Both transport problems delayed or complicated help, but the physical causes were different. Then make a judgement: geography shaped access in both events, while the particular route failure and the capacity available to repair it varied.
The same paired method can evaluate building vulnerability. The PDNA identified vulnerable housing in Nepal and the need for safer reconstruction. Japan had extensive building standards and preparedness, which limited some earthquake impacts, but coastal exposure, tsunami assumptions and the Fukushima power-and-cooling cascade revealed remaining weaknesses. This does not mean Japan's standards failed everywhere or that every Nepalese building was equally unsafe. A strong answer identifies which buildings, locations or services the evidence describes.
Responses should be evaluated against the objective they were designed to meet. A search-and-rescue operation aims to find and treat survivors rapidly; safer housing reconstruction aims to lower vulnerability in future earthquakes; a tsunami evacuation aims to move people beyond expected inundation. Evidence of a programme's reach is relevant, but it is not proof that every need was met. The World Bank reports that its Nepal housing project supported more than 330,000 homeowners. That demonstrates substantial programme reach and technical support. It does not establish that all damaged households were eligible, that every home met the same standard or that livelihoods and services recovered at the same pace.
For Japan, reconstruction of infrastructure and relocation or land raising in some communities may reduce exposure to future coastal flooding. Yet new sea walls and raised land take time and money, and relocation may change access, views, work patterns and community ties. Fukushima recovery must be judged over a different timescale from reopening a road: contamination monitoring, restrictions, compensation and changed communities continued long after the shaking stopped. Evaluating a response means considering risk reduction, speed, fairness, cost, participation and unintended effects—not merely listing the action.
A worked evidence paragraph
Question: Explain why impacts differed between two tectonic events in countries with contrasting capacities.
Evidence and reasoning: Nepal's 2015 event was an M7.8 earthquake in a continental collision zone and was followed by a strong aftershock. The government-led assessment reported close to 9,000 deaths and about 755,000 houses destroyed or significantly damaged across the earthquake sequence. Many affected settlements lay in mountainous terrain, where landslides and damaged routes could isolate communities; vulnerable housing and limited transport capacity increased the challenge of rescue and reconstruction. Japan's 2011 M9.0 offshore subduction earthquake generated a major tsunami. The Reconstruction Agency records extensive building damage and more than 470,000 evacuees, while the tsunami also disabled power and cooling at Fukushima Daiichi. Japan had greater monitoring, engineering and financial capacity, yet coastal exposure and a cascading nuclear emergency produced long-term displacement. The contrast cannot be attributed to income alone: magnitude, margin type, secondary hazards, settlement pattern, buildings and response capacity all shaped the consequences. The statistics describe different event boundaries, so they support an explained contrast rather than a direct ranking of vulnerability.
The paragraph uses a date and place, a physical cause, specific sourced evidence, a social explanation and a limitation. It does not assume that the larger magnitude automatically caused the larger total harm. If the question asks for a judgement, add a final sentence that weighs the relative importance of physical hazard and social vulnerability, while recognising that both interacted.
A short answer-planning frame
Before writing a longer tectonic case-study answer, make a quick evidence grid. Choose two or three rows that answer the actual question; do not try to reproduce every fact in this chapter.
| Question focus | Nepal evidence to consider | Japan evidence to consider | Explanation to develop |
|---|---|---|---|
| Physical setting | Continental collision; thrust fault; mountain relief | Offshore subduction; sea-floor displacement; Pacific coast | How boundary type and location shape earthquake and secondary hazards |
| Effects | Strong shaking, aftershocks, landslides, damaged housing and access | Tsunami inundation, infrastructure damage, Fukushima cascade | How the sequence affected people and services |
| Vulnerability | Housing condition, remote settlements, transport and resources | Coastal exposure, critical infrastructure and evacuation needs | Who was exposed and which weaknesses increased harm |
| Response | Local rescue, international support, safer owner-driven housing | Emergency services, reconstruction coordination, coastal recovery | Which risk factor each action changed and who could benefit |
| Evaluation | Access, grants, standards and uneven reconstruction | Defence limits, relocation trade-offs and long-term displacement | Effectiveness, reach, fairness, time and remaining risk |
Do not fill every cell with a statistic. Select the information that creates a chain of geographical reasoning: tectonic process → hazard pathway → exposure and vulnerability → consequences → response → remaining risk. This chain can organise an answer without turning it into a memorised list.
Common misconception
- “The crust is broken into plates that move because the mantle is liquid.” The lithosphere moves over the slowly deforming asthenosphere; the mantle is mostly solid over short timescales.
- “Convection currents are the only force moving plates.” Mantle flow matters, but ridge push, slab pull and resistance also contribute.
- “Every boundary has earthquakes and volcanoes.” Conservative and collision margins are earthquake-active but do not create the same subduction volcanoes; hotspots can be volcanic inside plates.
- “At a destructive margin, the oceanic plate melts as soon as it touches the mantle.” Water released from the slab promotes partial melting in the mantle wedge; the processes are more complex.
- “An earthquake begins at its epicentre.” Rupture begins at the focus; the epicentre is the point directly above it at the surface.
- “Magnitude and intensity are interchangeable.” Magnitude measures the event at its source; intensity varies from place to place.
- “A magnitude 7 earthquake is only slightly stronger than a magnitude 6.” Magnitude scales are logarithmic; the unit difference is not a simple linear increment.
- “A tsunami is a normal wind wave.” A tsunami is usually caused by displacement of a large water volume and may arrive as a series of waves.
- “Earthquake monitoring predicts the exact date.” Monitoring improves understanding and can support early warning after rupture starts, but exact advance prediction is not reliable.
- “Building codes mean every building is earthquake-proof.” Codes lower some risks when enforced; old buildings, poor construction and events beyond design limits remain.
- “Japan had no risk because it was wealthy.” Capacity reduced some consequences, but the tsunami and nuclear cascade created severe impacts and long displacement.
- “Nepal's impacts were caused only by poverty.” Tectonic setting, event size, vulnerable housing, mountain access, exposure and capacity all interacted.
- “A higher sea wall removes tsunami risk.” It may reduce some flooding, but can be overtopped, damaged or create reliance; evacuation remains important.
Self-check
- What two layers form the lithosphere?
- Give two kinds of evidence that support plate tectonics theory.
- Why is it inaccurate to describe the mantle as a liquid ocean?
- What is slab pull, and at which type of boundary is it important?
- Describe what happens to crust at a constructive boundary.
- Why can subduction produce both earthquakes and volcanoes?
- Why do conservative margins create earthquakes but usually not volcanoes?
- How does continental collision differ from oceanic–continental subduction?
- What is the difference between a focus and an epicentre?
- Distinguish earthquake magnitude from intensity.
- How can an earthquake trigger a tsunami?
- Name two secondary hazards that may follow an earthquake.
- Why are aftershocks a risk during rescue and recovery?
- Why are some volcanic eruptions explosive?
- Name three hazards associated with a volcano besides lava.
- What can seismic monitoring tell scientists, and what can it not tell them about an exact earthquake date?
- How is earthquake early warning different from prediction?
- Give two ways a building can be designed to reduce earthquake risk.
- Why might a building code be less effective than its written standard suggests?
- State the magnitude and tectonic setting of the 2015 Nepal earthquake.
- Give one physical and one human reason Nepal's rescue response was difficult.
- What does the Nepal PDNA estimate about housing damage and total recovery needs?
- Name one immediate and one long-term response in Nepal.
- State the magnitude and tsunami connection of the 2011 Japan earthquake.
- Give one example of a cascading impact in the Great East Japan disaster.
- Name one immediate response and one long-term reconstruction measure in Japan.
- Why is Japan–Nepal a useful but imperfect comparison?
- Give two reasons people may continue to live near tectonic hazards.
- Which strategies can reduce exposure, and which can reduce vulnerability?
- What makes a case-study statistic useful in an exam answer?
Self-check answers
- The crust and the rigid uppermost mantle.
- Examples include matching fossils or rock belts across continents, palaeoclimate evidence, seafloor age patterns, magnetic stripes, earthquake distribution, or modern GNSS measurement.
- The mantle is mostly solid over short timescales but can deform and flow very slowly over geological time; the asthenosphere is weak, not a global magma ocean.
- Slab pull is the force of a dense descending oceanic plate pulling the rest of the plate; it is important at a subduction boundary.
- Plates separate; magma rises and cools to form new crust, commonly at a mid-ocean ridge or rift.
- The descending slab releases water that promotes partial melting in the mantle wedge, producing magma; friction and locking on the plate interface also build earthquake stress.
- The plates slide sideways past one another and do not usually generate a large magma supply by that boundary process.
- Oceanic crust can subduct beneath continental crust; when buoyant continental crust converges with continental crust, it is more likely to compress, thicken and uplift into mountains.
- The focus is where rupture starts underground; the epicentre is the surface point directly above it.
- Magnitude measures source size; intensity describes shaking or observed effects at a particular location and varies across the area.
- Sudden vertical movement of the sea floor can displace a large volume of water and create tsunami waves.
- Landslides, liquefaction, fires, tsunamis, infrastructure failure and disease risk after service disruption are examples.
- They can further damage weakened buildings or slopes, endanger rescuers and delay people from returning to unsafe structures.
- Viscous magma can trap gas so pressure builds; composition and water can contribute, although eruption behaviour varies.
- Ash fall, pyroclastic flows, volcanic gases, lahars, landslides and tsunami are valid examples.
- It records seismic activity and helps locate events or assess changing activity; it cannot give a reliable exact date, place and magnitude for a future earthquake.
- Prediction seeks to forecast an earthquake before it begins; early warning detects rupture after it starts and may give distant locations seconds to act before stronger waves arrive.
- Base isolation, cross-bracing, shear walls, flexible frames, dampers, ductile connections or stronger foundations.
- It may not be enforced, affordable or applied to older buildings; construction quality, inspection and maintenance matter.
- Mw 7.8, on/near the Main Himalayan Thrust within the India–Eurasia collision zone.
- Physical: landslides, steep terrain, remote settlements or damaged routes. Human/system: limited transport, equipment, airport capacity, supplies or emergency resources.
- Around 755,000 houses were destroyed or significantly damaged; the PDNA estimated about US$6.7 billion in recovery needs, with damage and losses of about US$7 billion.
- Immediate: rescue, first aid, shelter, food or water distribution. Long term: owner-driven safer housing reconstruction, rebuilding infrastructure or heritage recovery.
- Mw 9.0, offshore at a subduction megathrust at the Japan Trench; seabed displacement generated a major tsunami.
- Tsunami disabled power and cooling at Fukushima Daiichi, creating a nuclear emergency and evacuation; damaged roads and utilities also disrupted services.
- Immediate: search and rescue by police, fire services, Coast Guard and Self-Defence Forces; long term: reconstruction, higher-ground relocation, coastal protections or dedicated recovery coordination.
- It compares contrasting capacity and settings, but event magnitude, tectonic context, tsunami exposure, population, building stock and definitions differ, so it is not a controlled comparison.
- Fertile soil, jobs, energy, minerals, tourism, family ties, cultural heritage, affordable housing or lack of safer alternatives.
- Exposure: land-use zoning, relocation and safer siting. Vulnerability: building codes, retrofitting, warning access, preparedness and resilient infrastructure. Some strategies affect more than one factor.
- It is dated, accurately defined, comes from a reliable source, has units and context, and is linked to a geographical explanation rather than listed alone.
Revision points
Use a three-step tectonic explanation: plate movement → physical process at the margin → resulting earthquake or volcanic hazard. For an event answer, add place and date, cause, primary and secondary effects, immediate and long-term response, then explain how exposure, vulnerability and capacity shaped differences. When comparing Japan and Nepal, match categories, distinguish the tsunami and nuclear cascade from the earthquake itself, and use each source's reporting date. Evaluate monitoring, prediction, protection and planning by identifying what risk they change and what remains.
Curriculum alignment
- Curriculum coverage IDs:
aqa.3.1.1.tectonic-hazards - Related practice packs:
gcse_geo_p1_physical_environment_june_2022,gcse_geo_p1_physical_environment_june_2023,gcse_geo_p1_physical_environment_june_2024,gcse_geo_p1_physical_environment_november_2020,gcse_geo_p1_physical_environment_november_2021 - Shared concept tags:
tectonic-hazards,plate-tectonics,earthquakes,volcanoes,natural-hazards
Sources
- Specification: AQA GCSE Geography 8035: Living with the physical environment
- Plate tectonics and boundary evidence: USGS: Plate tectonics, USGS: Understanding plate motions, British Geological Survey: What causes earthquakes?
- Nepal earthquake magnitude, depth and tectonic summary: USGS: M 7.8 Nepal earthquake
- Nepal damage, losses and housing recovery needs: Nepal Government-led 2015 Post Disaster Needs Assessment, supported by World Bank and partners, World Bank: Nepal reconstruction programme
- Nepal's owner-driven housing reconstruction programme: World Bank: Post-earthquake reconstruction in Nepal
- Japan earthquake magnitude, location, casualties and damage totals: Japan Reconstruction Agency: Great East Japan Earthquake
- Japan emergency response, rescue and international assistance: Japan Reconstruction Agency: Great East Japan Earthquake response overview
- For all case-study figures, state the reporting date and definition. Sources may combine the April and May Nepal earthquakes, or count Japanese missing persons and evacuees at different dates.