 FoxChild@Learn
13. Urban issues and challenges
Curriculum status: Required core content.
This guide follows AQA GCSE Geography 8035. Named examples below are suggested teaching examples where the specification allows a school choice; use your teacher’s selected case study and verify current figures before an assessment.
Required knowledge
- Explain global urban patterns, HIC/LIC/NEE trends, push–pull migration, natural increase and megacities.
- Use a named LIC/NEE city to assess location, growth, jobs, services, informal settlements, water, sanitation, energy, unemployment, crime and environmental challenges; include planning that improves quality of life for poorer residents.
- Use a named UK city to assess migration, opportunities, deprivation, brownfield/greenfield change, sprawl and commuter settlements; explain a regeneration project and sustainable living/transport strategies.
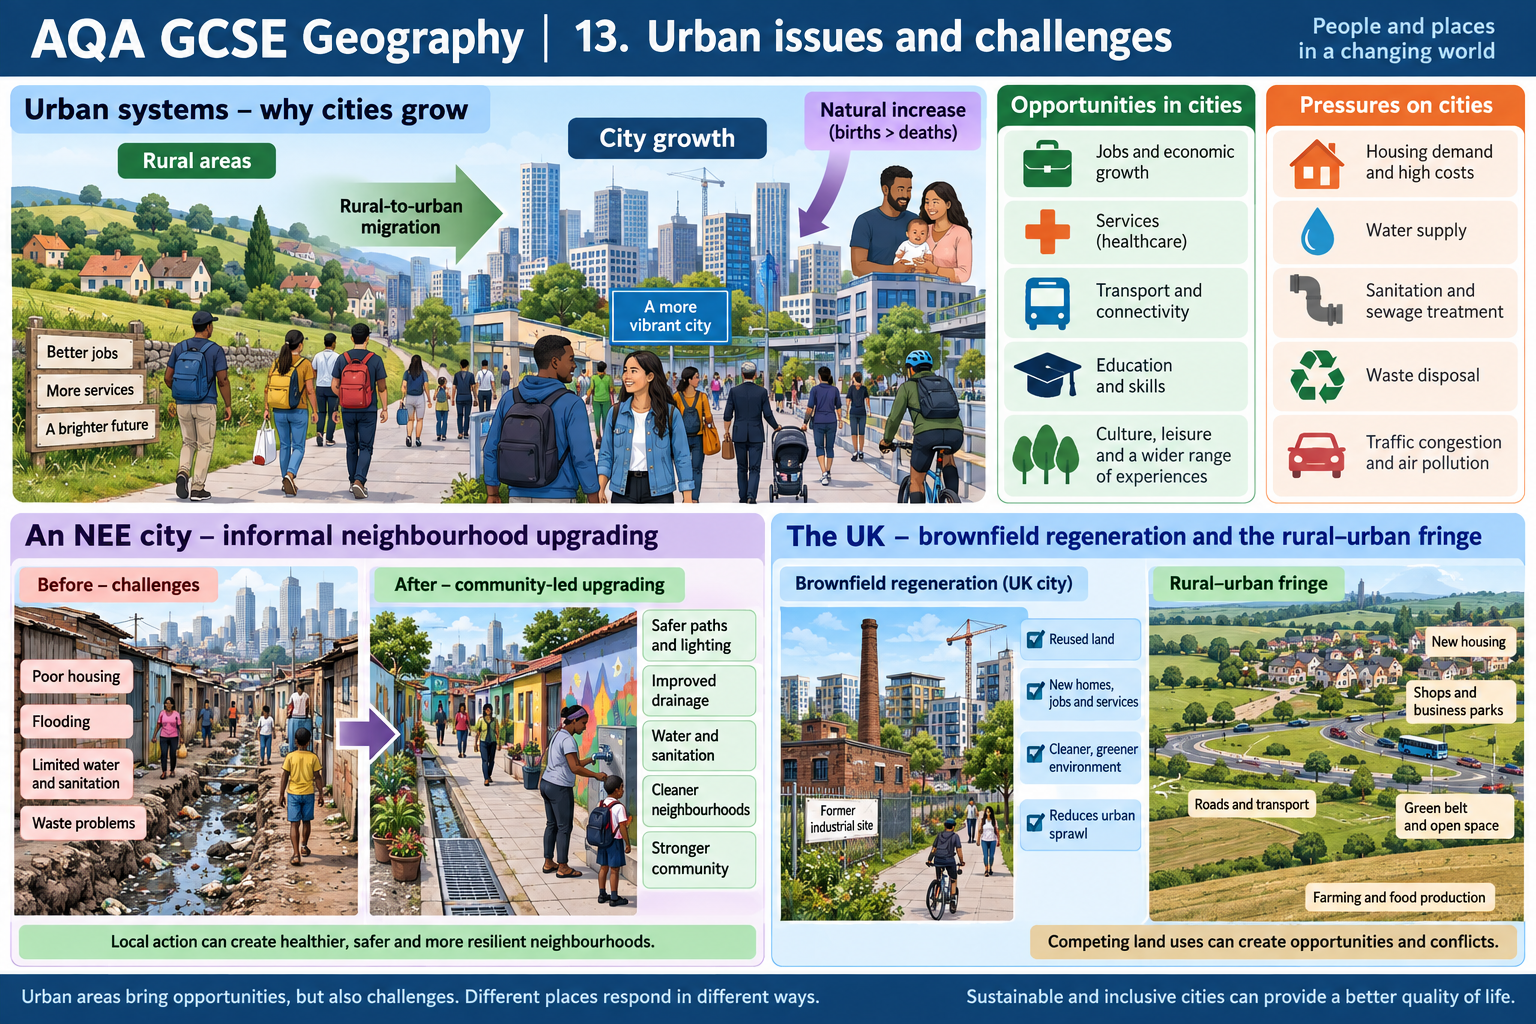
Key vocabulary
| Term | Meaning |
|---|---|
| urbanisation | rising share of population living in urban areas |
| megacity | urban agglomeration with more than 10 million residents |
| informal settlement | housing developed outside formal planning or services |
| urban regeneration | coordinated improvement of a declining urban area |
| urban sprawl | outward growth of built-up land |
How the geography works
Urban growth comes from migration and natural increase. It can expand labour markets, industrial areas, health and education services, water supply and energy access while increasing demand for housing, sanitation and transport. Poorly serviced informal settlements can face insecure tenure and limited services; planning and community-led upgrading can improve quality of life. In UK cities, deindustrialisation, service-sector growth, national and international migration and policy alter neighbourhoods. Regeneration can add jobs, recreation, integrated transport and green space, but may raise rents or displace residents. Brownfield reuse, sprawl, commuter settlements, waste, congestion and deprivation create different challenges. Water/energy conservation, recycling, green space and public transport support urban sustainability.
1. Understanding urban change
Essential vocabulary
| Term | Meaning and why it matters |
|---|---|
| urban area | A built-up settlement defined by a statistical or national method; its boundary may differ between datasets. |
| urbanisation | An increase in the proportion of a population living in urban areas. |
| urban growth | An increase in an urban population or the physical extent of a built-up area. These can occur together or separately. |
| urban sprawl | Low-density expansion of a built-up area into surrounding rural land. |
| rural–urban fringe | A transition zone where urban and rural land uses meet and compete. |
| commuter settlement | A settlement whose residents commonly travel to jobs or services in a nearby town or city. |
| counter-urbanisation | Movement from urban areas to smaller settlements or rural areas. |
| suburbanisation | Growth of residential areas at the edge of a town or city. |
| natural increase | Births minus deaths over a period; it adds to population if births exceed deaths. |
| migration | Movement of people from one place to another, temporarily or permanently. |
| push factor | A condition that encourages people to leave a place. |
| pull factor | A condition that attracts people to another place. |
| megacity | An urban area with at least 10 million inhabitants; its population boundary must be specified. |
| urban agglomeration | A continuous or functionally connected built-up area, sometimes crossing administrative boundaries. |
| informal settlement | A settlement where housing or land occupation is not fully recognised or serviced through formal systems; conditions vary greatly. |
| deprivation | Disadvantage in one or more aspects of life, such as income, work, health, education, housing or environment. |
| brownfield site | Previously developed land that may be reused, subject to contamination, ownership and planning constraints. |
| greenfield site | Land not previously developed in the same way, often on the rural–urban fringe. |
| regeneration | Coordinated action to improve an area’s buildings, economy, environment and/or social conditions. |
| sustainability | Meeting present needs while considering long-term environmental, social and economic effects and fairness. |
Urbanisation is a proportion, not just a bigger city
Urbanisation means that a growing share of a country’s population lives in urban areas. It can occur because towns and cities gain residents while rural populations grow more slowly, because rural settlements are reclassified as urban, or because administrative boundaries change. Urban population growth is a change in the number of urban residents. Urban sprawl is outward expansion of built-up land. These are related but not interchangeable ideas.
The United Nations’ 2025 World Urbanization Prospects estimates that cities are home to 45 per cent of the world population under its Degree of Urbanization approach. The report counted 33 megacities in 2025 and projects 37 by 2050. The method matters: previous UN estimates commonly used national definitions of “urban,” and the 2025 revision uses a harmonised geospatial method that distinguishes cities, towns and rural areas. Percentages from two different definitions should not be compared as if the boundary rules were identical. In examinations, use the dataset and date supplied.
Urban populations are distributed unevenly. Large concentrations occur in Asia, Europe, Africa and the Americas, often near coasts, river valleys, transport corridors and established economic regions. Physical geography can affect the site and shape of a city, while historical decisions, trade, government and technology influence its situation and growth. A map can show urban networks at world or national scale; a ranking table alone cannot explain why places grew.
The site is the actual land on which a settlement was first established, such as a harbour, river crossing, defensible hill or resource location. The situation describes its position relative to other places and routes. A port may have a sheltered site and a situation connected to inland trade; a city at a transport junction may grow because it connects markets even if the immediate physical site was not the original reason for its importance. Modern infrastructure can change the value of a site over time.
Urbanisation in places at different income levels
Urbanisation occurs in countries at all income levels, but timing, rate and causes vary. Many high-income countries urbanised earlier during industrialisation, when factories and services drew people towards towns and cities. Today, urban populations in HICs may continue to grow through migration, natural increase, international connections and changes to city boundaries. Some cities also experience suburbanisation or counter-urbanisation as households move outward while retaining links to urban jobs.
Many lower-income countries and newly emerging economies have experienced rapid urban growth as populations increase and people move towards employment, education, health care, transport and other opportunities. Manufacturing, construction and service economies can attract workers; rural hardship, land pressure, environmental change or limited services may encourage departure. Growth is not simply caused by poverty, and people’s reasons are varied. Cities can offer real opportunity, but the supply of secure housing, infrastructure and jobs may not keep pace with the number of new residents.
Avoid treating “LIC city” or “NEE city” as a description of every household. Income and access differ within cities, including within one neighbourhood. A person may have a formal job and reliable services while a neighbour has insecure work or intermittent water. National averages, city averages and settlement-level data answer different questions. Describe the scale shown by the evidence and avoid making a whole city sound uniformly poor or uniformly wealthy.
Why do people migrate to cities?
The push–pull model helps organise explanations but should not make migration seem automatic. A push factor may include low or insecure income, limited access to secondary education or health care, land shortage, environmental hazard, conflict or a lack of reliable transport. A pull factor may include formal and informal employment, higher education, specialist health services, electricity and water networks, transport connections, cultural life or family networks already in the city. The same condition can be interpreted differently: one person may see a city’s job market as an opportunity while another is deterred by housing costs.
Some migration is rural-to-urban and internal; some is international or from other cities. Migration can be seasonal, circular, temporary or permanent. People may first move to a nearby town, follow a family member, or move in stages as jobs and housing change. Decisions are influenced by age, gender, education, resources, social networks and legal status. Young adults may migrate for study or work, while families may move for security or schooling. Not everyone can afford to move, and some migrants maintain strong links with their place of origin.
The natural increase of a city’s population depends on its birth and death rates. A youthful population can have more people entering childbearing ages, increasing births even if the average number of children per family is falling. Improvements to health care, sanitation and nutrition can reduce death rates. Birth and death rates are shaped by demographic structure, public services, income, culture, education and policy, so a single explanation rarely fits every city.
In a population calculation, natural increase is births minus deaths over the same period; a migration balance is arrivals minus departures. Total population change can be represented as natural change plus net migration, with boundary and statistical adjustments where relevant. A city may grow even if net migration is zero, because births exceed deaths. It may also lose residents through migration while continuing to grow naturally. This distinction is central to explaining urban change.
The emergence of megacities
A megacity is defined here as an urban area of at least 10 million people. The number of megacities has grown as large urban agglomerations expanded and populations concentrated. They are not always single municipalities: a connected urban region can include multiple local authorities. A city-proper population should therefore not be directly compared with a metropolitan-area population without saying which boundary is used.
Large cities can benefit from agglomeration: firms and workers are close to one another, specialised services can reach large markets, and transport, education and cultural infrastructure can support wider economic activity. Large labour markets may encourage investment and innovation. However, high density can intensify pressure on housing, transport, water, sanitation, energy, waste systems and land. A megacity is not automatically inefficient; density can support public transport and compact services if planning and investment work well. The result depends on governance, infrastructure and inclusion.
Urban population growth and physical expansion have different consequences. If more people live in a similar footprint, density may rise and demand on buildings or services increases. If land area expands faster than population, low-density sprawl can increase travel distances, infrastructure costs and conversion of farmland or habitats. Satellite imagery, built-up area data and population density maps help distinguish these patterns.
Read an urban population graph
Before interpreting a graph, check whether the vertical axis is population, percentage urban, growth rate or density. A rising urban population does not necessarily mean a rising urbanisation rate: rural population may also be growing. Read the years, units, scale and boundary definition. Compare rates as well as totals; a smaller city can grow faster proportionally than a megacity while adding fewer people.
If a line becomes steeper, the measured variable is increasing more quickly over that interval. It does not by itself explain the cause. Use the population structure, migration balance, births, deaths, industrial change or policy evidence supplied. If a graph compares regions, avoid saying “Africa is growing fastest” unless the axis and time period support that claim. A percentage change and an absolute population change are not the same.
When sources disagree, check their date, definition and geographic extent before deciding that one is wrong. The UN 2025 method, national census boundaries and metropolitan definitions may produce different totals. A strong geographical answer makes the chosen figure traceable: “the 2022 census counted 6,211,223 residents in the municipality” is clearer than “Rio has six million people” with no date or boundary.
Place example
Rio de Janeiro and London are possible examples, not required by AQA. For the NEE/LIC city, identify location, opportunities, service challenges and management; for a UK city, explain a regeneration project and rural–urban fringe change. Use the examples taught by your school.
2. NEE city case study: Rio de Janeiro
Rio de Janeiro is used here as an illustrative NEE city case study. AQA permits a school-selected major city in an LIC or NEE, so a student should substitute the city and urban-planning example taught by their teacher if different. Rio provides evidence for migration and natural increase, social and economic opportunity, informal settlements, service challenges and attempts to improve quality of life.
Location and importance
Rio de Janeiro lies in south-eastern Brazil on the Atlantic coast beside Guanabara Bay. Its physical setting includes bays, beaches, lagoons, hills and steep slopes, which create distinctive scenery but also constrain some routes and building sites. It is the capital of Rio de Janeiro state and the centre of a large metropolitan region. The municipality had 6,211,223 residents in the 2022 census, according to Brazil’s national statistics institute, IBGE. This is the municipality figure, not the population of the entire metropolitan region; the two boundaries include different areas.
Rio is important regionally as a major centre for services, education, health care, transport, administration, culture and employment. At national scale it was Brazil’s capital until 1960 and remains a prominent city for tourism, media, culture, finance and industry. The wider state and metropolitan economy has links to offshore oil and gas, port logistics, petrochemicals, steel, shipbuilding and services; activity is distributed across municipalities and should not all be attributed to the central city. Internationally, its name recognition, cultural events, coastline, port connections and tourism link it to global flows of people, services and investment.
On a case-study map, locate Brazil in South America; show the south-east region, Rio’s position on the coast, Guanabara Bay, the Atlantic Ocean, and connections towards São Paulo, Brasília and the interior. At local scale, label the central business district, port/harbour area, South Zone, Barra da Tijuca, major transport corridors and selected favelas such as Rocinha. A map should use a legend and indicate whether it represents the municipality or metropolitan region. Do not plot every favela as if they were one continuous settlement.
Why Rio grew
Rio’s growth reflects its changing role over several centuries. The sheltered bay and coastal location supported port activity; the city became a colonial and later national administrative centre. Government, trade, services and transport concentrated jobs and investment. Its historical role as Brazil’s capital attracted institutions and infrastructure. Following the relocation of the capital to Brasília in 1960, Rio retained significant cultural, economic and political functions rather than simply losing its importance.
Industrialisation and later shifts towards services created varied employment. The metropolitan economy includes logistics, manufacturing, petroleum-related activity, media, education, health care, finance, tourism and cultural industries. Jobs and services act as pull factors for people from other parts of Brazil and from abroad. Family and community networks can make migration easier by helping new arrivals find accommodation and work. These flows occur alongside movement between municipalities within the metropolitan region.
Natural increase has also contributed to the growth of Rio and its urban region. A relatively youthful age structure in some communities can result in more births, while public-health improvements can reduce mortality. The balance varies over time and between neighbourhoods. Avoid attributing all urban growth to rural migration: in-migration and natural change are separate mechanisms, and out-migration or changes in the wider economy can also affect population totals.
Opportunities created by urban growth
Employment and economic activity: A large labour market gives firms access to workers, suppliers and customers. Industrial areas, port logistics, tourism, construction, public services and the creative economy create different types of work. Employment can provide income and skills, while new businesses expand the tax base and demand for services. Opportunities are uneven: secure, high-paid work exists alongside informal, temporary or low-paid employment. A city’s aggregate economic output does not show how income is distributed among households.
Health and education: Concentration can make hospitals, clinics, schools, universities and specialist services easier to reach than in remote rural places. Universities and training institutions can develop skills and support research. However, access depends on location, affordability, transport, capacity and service quality. A hospital in the municipality may be difficult to reach from a peripheral neighbourhood if a journey is costly or unreliable.
Water, energy and other resources: A dense urban network can connect many households to piped water, electricity, drainage, waste collection and communication infrastructure. Economies of scale can make networks more efficient than providing separate services to dispersed settlements. Yet informal growth, steep terrain, tenure uncertainty and incomplete networks can leave some residents reliant on informal connections or intermittent service. “The city has a water network” does not mean every home receives safe and reliable water through a legal household connection.
Industrial areas as development stimulus: Firms cluster near transport, workers and markets. Port and industrial activity can stimulate jobs, freight services, supply chains and investment in roads, rail and utilities. That growth can support suppliers beyond the industrial district. At the same time, heavy traffic, pollution and industrial hazards may disproportionately affect nearby communities, and changes in global markets can make employment insecure. Economic development and quality of life need to be assessed together.
Culture and international links: Tourism, cultural institutions, music, sport, beaches and historic landmarks attract visitors and support businesses. Major events can bring investment and international visibility but may also create temporary jobs, public spending priorities, crowding or displacement pressures. An event-related project is not automatically beneficial to all residents; ask which neighbourhoods and groups receive lasting improvements.
Challenges of urban growth
Housing and informal settlements: When the supply of affordable, secure housing does not match household growth, residents may build or rent in informal neighbourhoods. In Brazil the census uses the category Favelas e Comunidades Urbanas (favelas and urban communities); “favela” describes a highly diverse group of settlements, not a single uniform housing type. Some communities have dense, self-built housing and strong social networks; conditions differ in building quality, tenure, services and risk. Avoid describing residents as a problem or assuming every home is unsafe.
IBGE’s 2022 census identified 16.39 million people living in 12,348 favelas and urban communities across Brazil, 8.1 per cent of the national population. The largest counted community was Rocinha in Rio municipality, with 72,021 residents. These figures establish national scale and one prominent Rio case; they are not a count of all informal residents in Rio or proof that every community lacks the same services. Census categories and settlement boundaries should be stated when using the figures.
Informal housing can be built on steep slopes, flood-prone valley floors or land with difficult access. Constrained access makes it harder and more expensive to install roads, water and sewer pipes, electricity, waste collection, emergency vehicles and schools. Land tenure uncertainty can complicate investment, household security and planning. At the same time, residents often invest substantial labour and money in homes and neighbourhoods. A planning response that ignores existing communities can destroy social networks and move people farther from jobs.
Water and sanitation: Rapid urban growth increases demand for treated water and wastewater systems. When household connections, drainage and sewer networks do not keep pace, water may be intermittent or contaminated and untreated sewage may enter streams or Guanabara Bay. This affects health, recreation, fisheries and coastal ecosystems. Steep terrain, narrow streets and dense housing create construction challenges, and service delivery may involve several agencies. Water supply and sanitation are related but separate: a piped water connection does not guarantee safe wastewater treatment.
Energy and waste: Households and businesses need reliable energy for lighting, cooling, cooking, industry and transport. Informal or unsafe connections can create fire or electrocution risk; unreliable provision can constrain study and employment. More consumption can increase costs and emissions depending on the energy source. Solid waste collection can be difficult in narrow hillside streets; uncollected rubbish can obstruct drains, attract pests and enter watercourses. Waste management also involves sorting, recycling, landfill capacity and workers’ health.
Health, education and services: A growing population places pressure on classrooms, clinics, public transport and social services. Neighbourhood inequality affects travel time and service quality. Informal settlements may have community organisations and local services that official statistics miss, but these cannot substitute for safe, adequately funded systems. Access varies by income, location, age and disability. Use travel time or service coverage evidence when available rather than saying that a city lacks all public services.
Employment, unemployment and crime: The urban labour market offers jobs but may not create enough secure work for everyone. Workers without formal qualifications may have fewer options; informal work can provide income while lacking protections. Unemployment and underemployment are shaped by education, economic change and discrimination. Crime and violence are influenced by complex social, economic and political factors, including inequality, opportunity, public safety and governance. They should not be attributed to favela residence or migration as though one neighbourhood or group were inherently criminal.
Traffic, air and water pollution: High car use and congestion increase journey time, emissions and exposure to poor air quality. Freight, industrial activity and road design also contribute. Sewage and waste can pollute waterways. Rio’s hills, bay and coastal setting can make transport routes concentrate in corridors; meanwhile, long journeys between peripheral homes and central jobs can increase household costs. Public transport corridors can improve access but require reliable service, safe interchanges and affordable fares.
Risk and environmental pressures: Informal development on unstable slopes can expose residents to landslides during intense rainfall; development on low-lying land can face flooding. Removing vegetation, modifying slopes or blocking drainage can intensify some risks, but exposure is shaped by housing options, land policy and infrastructure. Climate hazards affect both formal and informal neighbourhoods, although the ability to prepare, insure, evacuate and recover is unequal. Risk maps should be combined with local knowledge and current warnings.
Urban planning example: Favela–Bairro
Favela–Bairro is an illustrative urban-upgrading programme developed by the municipality of Rio de Janeiro with support from the Inter-American Development Bank (IDB). Its central idea was to improve existing favela settlements and integrate them more fully into the city, rather than treating demolition and relocation as the default response. The programme began in the 1990s; it is a historical case study, and students should not describe all its works as current or assume it reached every community.
The programme funded basic infrastructure and neighbourhood improvements. Project components included water supply, sewerage, drainage, street paving and lighting, public spaces, parks, slope stabilisation or reforestation, waste collection, social facilities and community services. Some projects addressed land regularisation and tenure. The package was intended to improve everyday access and reduce isolation, not simply to build one new road or provide one utility.
Infrastructure improvements can raise quality of life through several linked pathways. Piped water can reduce time spent obtaining water and lower reliance on unsafe sources; sewage and drainage can reduce exposure to contaminated water; paved, lit routes can improve access for residents and emergency services; public spaces and social facilities can support community life. Slope and drainage work can reduce some physical risks when designed for local conditions. Better access may connect residents with jobs, schools, clinics and public transport elsewhere in the city.
The IDB’s review of Favela–Bairro II reports improvements in living conditions for many low-income residents, including income and availability of social services. It describes a mix of physical infrastructure, social services, community organisation and land titling. Rio’s municipal housing department describes the programme’s purpose as integrating favelas into the city through infrastructure, services, public facilities and social policies. These evaluations are evidence about programme outcomes, but they do not show that every household received every service or that all inequalities ended.
Why upgrading can be more appropriate than relocation
Residents may have invested in homes, businesses, relationships and community networks. Relocation to a distant housing estate can reduce access to existing work, schools, family support and informal income. Upgrading in place can preserve those connections while improving services. It can also be less costly than building complete new neighbourhoods elsewhere, although costs vary with terrain, existing infrastructure and the level of risk. Community knowledge helps planners understand routes, drainage and local priorities that a top-down design may overlook.
Upgrading is not always sufficient or safe in place. Some houses may be in areas of severe landslide or flood risk where engineering works cannot make the location acceptable. In those cases, relocation may be necessary, but it should involve consultation, suitable replacement housing, transport access and fair compensation. Forced removal without secure alternatives can make poverty worse. The planning choice depends on risk evidence and residents’ rights, not only on the visual appearance of a settlement.
Limitations and evaluation
An infrastructure project needs long-term maintenance. Sewer pipes, drains, lighting and paved routes can deteriorate or become blocked without reliable funding and clear responsibility. A settlement’s population may continue to grow after improvement, putting pressure back on services. Land regularisation can improve security but may also change land values and rents; if affordability measures are absent, some residents may be displaced indirectly. Social services need ongoing staffing, not just a building.
Projects may be uneven because construction is easier in some places than others. Dense narrow lanes can limit machinery; steep slopes increase cost and engineering complexity; property boundaries and land tenure may be uncertain. A citywide programme has to prioritise neighbourhoods, so residents outside selected areas may wait longer. The decision about which services to build first should include residents and consider urgency, population, hazard and service gaps.
To assess Favela–Bairro, define the quality-of-life outcome: reliable water, sanitation, safer access, health, education, income, tenure security or connection to the city. Compare the initial problem with a measured outcome and specify whose conditions changed. A programme is more convincing if community participation shaped design and if services continued after construction. “The favela was improved” is too broad; a stronger answer names the infrastructure, explains the pathway to a better outcome, and acknowledges maintenance or coverage limitations.
| Planning action | Intended mechanism | Evidence that could test success | Limitation to consider |
|---|---|---|---|
| Water and sewer networks | Improve water access and remove wastewater more safely | Connection coverage, reliability, water-quality and health data | A pipe network may not guarantee continuous household service or treatment |
| Paved streets and lighting | Improve access, safety and service-vehicle movement | Travel times, lighting coverage and resident surveys | Dense lanes and steep terrain may constrain access |
| Drainage and slope works | Reduce runoff concentration or instability at selected sites | Flood or landslide incidents, drainage condition and slope monitoring | Cannot remove all extreme-event risk; maintenance is essential |
| Public spaces and social facilities | Support recreation, community services and social integration | Facility use, programme access and resident feedback | Benefits depend on staffing, safety and long-term funding |
| Tenure and regularisation | Increase security and link settlement to formal planning | Legal documentation and service-provider access | May raise values or rents without housing affordability protections |
This case illustrates an important urban-planning principle: the residents of an informal settlement are people with rights, knowledge and agency. Urban planning should improve safety and service access while respecting communities and avoiding the assumption that relocation is always beneficial.
3. UK urban change: Bristol
Bristol is an illustrative UK city case study. AQA asks for a major UK city; use the city selected by your school if different. Bristol demonstrates migration and cultural change, economic and social opportunity, inequality, urban greening, brownfield regeneration and pressure at the urban fringe.
Location, population and importance
Bristol lies in south-west England around the River Avon, with a historic harbour and connections to the Severn Estuary and the wider West of England. It is the largest city in south-west England and a regional centre for employment, education, health care, culture, retail, transport and administration. Its port and historic maritime links helped shape its economy and physical form. In the 2021 Census, the population of the Bristol local authority was 472,400, an increase of 10.3 per cent from around 428,200 in 2011. This is the local-authority population, not the population of the wider urban region.
Bristol connects to London, the Midlands, Wales and south-west England by road and rail, and to wider markets through Bristol Port and regional airports. The surrounding West of England contains other urban areas and commuter settlements, so many journeys and labour-market links cross the city boundary. A location map should show Bristol in the UK, nearby Bath, the River Avon, Severn Estuary, M4/M5 corridors and railway connections. A city map can then locate the centre, Temple Meads, Temple Quarter, St Philip’s Marsh, the harbour, residential districts and green spaces.
Migration and the changing character of Bristol
Internal migration brings people to Bristol for university, work, family, housing and lifestyle. Students and graduates are attracted by higher education, creative and technology sectors, public services and regional job opportunities. People also move between Bristol and nearby towns or rural settlements as housing costs, employment and family needs change. International migration adds residents born in other countries and supports cultural, social and economic change. Reasons and experiences vary: some arrivals have secure employment or study, while others face high housing costs, language barriers or insecure work.
Migration influences the age structure, skills, languages, religions, food, music, shops and cultural activities of neighbourhoods. A diverse city can benefit from new businesses, international connections, innovation, community organisations and a wider cultural offer. Migration can help fill vacancies and increase demand for housing, education, health care and transport. Whether those services keep pace depends on planning and investment. A citywide population increase does not show how changes are distributed between wards.
The 2021 Census profiles show changes in Bristol’s ethnic groups and provide data on country of birth, language, employment and travel. Bristol City Council’s census dashboard notes population increases in most ethnic groups between 2011 and 2021, though particular categories changed partly because the census offered more detailed identity options. This is an important data lesson: a change in a category can reflect both demographic change and how people were asked to identify themselves. Use the census indicator and years exactly as supplied.
Opportunities created by urban change
Social opportunities: Bristol’s cultural mix supports restaurants, festivals, places of worship, arts, music and community networks. Parks, museums, harbourside public spaces, theatres and sports facilities provide recreation and entertainment. Universities, colleges, hospitals and specialist services attract users from across the region. Integrated transport can connect people to jobs and education, but its value depends on affordability, safety, reliability and physical accessibility.
Economic opportunities: Bristol has employment in education, health, advanced engineering, aerospace, financial and professional services, technology, creative industries, tourism, logistics, retail and public administration. A large labour market supports firms and suppliers, while universities and research institutions help develop skills and ideas. Regeneration can create construction work, commercial space and new services. These opportunities are not equally accessible; qualifications, discrimination, caring responsibilities, disability, transport and housing costs can affect who benefits.
Urban greening: Green infrastructure includes parks, street trees, river corridors, gardens, green roofs and habitat connections. It can provide shade, recreation, active travel routes, wildlife habitat and space for rainwater storage. Greening may improve air quality locally and support physical and mental health. A new park is not automatically equitable if nearby residents cannot reach it or if housing costs rise and they are displaced. Maintenance, long-term funding and resident access matter.
Challenges: inequality and deprivation
Bristol is a successful regional economy but contains significant neighbourhood inequality. The English Indices of Deprivation are a relative measure across small areas, combining income, employment, education, health, crime, barriers to housing/services and living environment domains. Bristol City Council’s 2025 report states that 22 per cent of Bristol residents were income deprived and 12.4 per cent of working-age residents were employment deprived; the proportion experiencing income deprivation varied greatly between neighbourhoods. Those are measures from the 2025 release and should be kept with that date.
Deprivation can affect housing quality, educational opportunity, health, access to secure work, food security and ability to travel. It can be concentrated in some inner-city or peripheral neighbourhoods while other areas have much higher incomes and housing values. A city average hides this pattern. A choropleth map of the Indices can show spatial variation, but it uses grouped categories and relative rankings; it does not describe each person in an area or prove the cause of deprivation.
Housing inequality appears through high rents, affordability problems, overcrowding, homelessness, poor-quality accommodation and differences between owner occupation and renting. Students, migrants, lower-paid workers and young households may compete for limited affordable homes near employment. Higher-income households may occupy larger homes or benefit from housing value increases. Planning new homes is therefore connected to social equity as well as population growth.
Health and education outcomes also vary. Local data may show differences in life expectancy, health conditions, school attainment or access to services between wards. These outcomes have multiple causes, including income, housing, transport, environment and public-service availability. Avoid attributing a statistic to one cause without evidence. Urban renewal may improve local buildings while leaving educational or health inequalities if the underlying barriers remain.
Dereliction, land and the rural–urban fringe
Deindustrialisation and economic restructuring can leave old docks, factories, warehouses and rail land vacant or contaminated. Derelict buildings can reduce local amenity and make sites feel disconnected, although some industrial structures have heritage value and can be reused. Regeneration can remediate land, restore buildings, provide homes or workspaces and improve routes. Land ownership, contamination, flood risk, heritage protection and construction cost can delay redevelopment.
Brownfield development reuses land that has previously been developed. It can reduce pressure to build on open countryside, use existing infrastructure and bring activity to a neglected area. However, brownfield land may be polluted, fragmented or costly to service; it may contain valuable habitat or community uses. Redevelopment can displace existing businesses, informal recreation or lower-cost housing. “Brownfield” does not mean empty, clean or without social value.
Greenfield sites are undeveloped in the relevant context. They may offer easier, cheaper construction but can consume farmland or habitats, increase travel distances and require new roads, schools, water and energy networks. A development on a city edge can create a new neighbourhood or commuter settlement, but if jobs and services remain in the centre it may increase car dependence. The planning choice compares land capacity, affordability, transport, environment and infrastructure.
Urban sprawl extends built-up areas into the rural–urban fringe. It can fragment habitats, reduce agricultural land and increase surface runoff where vegetation is replaced by impermeable roofs and roads. It may also provide homes and business space when city demand rises. New housing can improve affordability only if its tenure, price, transport and services match need. Building on the fringe does not automatically reduce city-centre housing pressure.
Commuter settlements grow as residents travel to employment and services elsewhere. Commuting can bring household income and support rural shops, but high car use can increase congestion, parking, emissions and pressure on local infrastructure. Public transport, walking and cycling connections can reduce car dependence where they provide practical alternatives. Remote work may change commuting patterns, but the extent varies by occupation and place.
Urban regeneration: Bristol Temple Quarter
Temple Quarter is a large regeneration programme around Bristol Temple Meads and St Philip’s Marsh, close to the city centre. The area contains extensive previously developed land and transport/industrial uses. Bristol City Council’s development framework proposes transforming about 135 hectares of brownfield land over 25 years into mixed-use neighbourhoods. Its stated vision includes 10,000 new homes, thousands of jobs, new green spaces and improved transport links. These are programme ambitions and projections, not completed outputs; separate the plan from what has already been built.
The area needed regeneration because parts of it were underused, disconnected by railway and road infrastructure, and did not make full use of its central location beside a major station. Former industrial and commercial land can contain contamination or flood constraints, and barriers can make walking between neighbourhoods difficult. City population growth creates demand for housing and jobs, while older infrastructure and vacant sites present an opportunity to improve the built environment.
Main proposed features include mixed-use housing and workspace, station improvements, public realm, walking and cycling routes, public transport connections, green infrastructure, community facilities and links between Temple Meads, the city centre, St Philip’s Marsh and nearby neighbourhoods. Mixed use can reduce the distance between homes, jobs and services. Better station access can improve regional connections. A connected network of streets and open space can make a formerly fragmented area easier to cross.
Potential benefits include new housing near public transport, construction employment, long-term jobs, investment, new public spaces, reuse of brownfield land and improved access to the station. New routes could connect neighbourhoods and support walking or cycling. Redevelopment can improve the appearance and use of land and increase the local tax base. If affordable housing and training are delivered, existing residents may gain more directly from the project.
Potential conflicts include construction disruption, rising land values and rents, displacement of existing businesses, pressure on local services and the risk that homes are unaffordable to households most in need. A new transport hub can attract more trips; regeneration must manage additional travel, not simply assume that people will use low-carbon modes. The area’s riverside and low-lying locations require attention to flood risk, heat and climate resilience. New green spaces need maintenance and safe access, and benefits may be concentrated among new residents or employers.
The framework is an adopted planning consideration, but delivery extends over decades and depends on funding, land assembly, infrastructure, planning permissions and market conditions. It is therefore best evaluated as a long-term plan with intended outcomes. To decide whether it succeeds, track housing tenure and affordability, local employment and training, business retention, journey modes, accessibility, public-space use, flood resilience and who moves into or out of nearby neighbourhoods.
| Regeneration question | Temple Quarter evidence or issue |
|---|---|
| Why did it need regeneration? | Underused brownfield land and fragmented connections near a major station; demand for housing and jobs. |
| What is proposed? | Around 135 hectares of mixed-use development over 25 years, with 10,000 homes, jobs, transport, public realm and green space. |
| What might improve? | Housing supply, station access, walking/cycling links, employment, public spaces and brownfield reuse. |
| What could be difficult? | Affordability, displacement, construction disruption, flood resilience, infrastructure costs and unequal access to benefits. |
| How can success be measured? | Completed affordable homes, local jobs/training, public transport use, retained businesses, access and environmental performance. |
A strong exam answer distinguishes the project’s reasons from its features. “There is derelict land” is a reason; “new homes and station connections are planned” describes features. Then explain how a feature addresses a reason and assess who benefits.
4. Sustainable urban living
Urban sustainability combines environmental limits, social fairness and an economy that can support people over time. A city may reduce waste or emissions while still having severe inequality; it may create jobs but increase traffic or housing pressure. Use a set of indicators rather than calling a place sustainable because it has one green building or public-transport line.
Water conservation
Cities need water for drinking, hygiene, cooking, industry, services, green space and fire safety. Demand rises with population, household size, income and some industrial processes. Water supply can be stressed by drought, leakage, pollution, ageing pipes or competition between urban and rural users. Treating and pumping water uses energy, while wastewater treatment protects health and ecosystems but requires infrastructure and funding.
Water conservation measures can include repairing leaks, water-efficient appliances, low-flow taps and showers, metering, rainwater capture, reuse of treated wastewater and public information. Green roofs, permeable surfaces and rain gardens can hold rain locally, slowing runoff into drains and reducing pressure during heavy rainfall. Reuse can reduce demand for treated drinking water where non-potable water is suitable. These approaches require installation, maintenance, public acceptance and protection against contamination; a city must still plan for reliable supply and safe sanitation.
The social test is whether households can afford water and receive safe, reliable service. A water-saving tariff might reduce demand but harm low-income families if essential use is expensive. A smart meter can reveal leaks but needs accessible support. Conservation should therefore combine infrastructure efficiency with fair access, public health and transparent pricing.
Energy conservation
Urban energy use includes heating, cooling, lighting, appliances, transport, offices and industry. Energy demand affects household bills, air quality and greenhouse-gas emissions, depending on the source and efficiency of supply. Compact development and public transport can reduce some travel energy, while insulation and efficient buildings can reduce heating demand.
Measures include insulation, efficient appliances, improved building controls, district heating, rooftop solar, heat pumps, low-carbon electricity, street-lighting upgrades and energy advice. Retrofitting existing homes can reduce bills and emissions but may be expensive, disruptive or technically difficult in older buildings. New developments can set efficiency standards from the start, though embodied emissions from construction materials also matter. Renewable generation needs suitable sites, grid connections and storage or balancing as output changes.
Energy access is also an equity question. Poor insulation and high energy prices can create fuel poverty even in a city with a reliable grid. Tenants may not control investment in a rented home, while landlords may not capture the bill savings from insulation. Programmes need to target households and buildings that otherwise miss the benefits.
Waste reduction and recycling
Dense cities produce household, commercial, construction and industrial waste. If collection is irregular, rubbish can block drains, attract pests and pollute waterways. Landfill uses space and may release methane; incineration can recover energy but creates emissions and requires careful controls. Recycling can reduce extraction of raw materials and landfill, but it depends on clean sorting, collection, processing markets and public participation.
The waste hierarchy prioritises avoiding waste and reducing consumption, then reusing and repairing products, with recycling after those steps. Food-waste separation, refill systems, repair cafés, reuse centres, construction-material recovery and producer responsibility can contribute. Recycling alone cannot make a city sustainable if total resource use keeps rising. Residents need convenient collection and clear guidance; workers need safe conditions; contracts should avoid exporting environmental burdens to communities with less power.
Waste data should be read in the right units: tonnes generated, kilograms per person, percentage recycled or landfill diversion rate. A higher recycling share can occur even while total waste increases. Compare per-capita and total figures, and check whether the measurement includes commercial or construction waste.
Green space and nature in cities
Urban parks, street trees, rivers, gardens, wetlands, green roofs and connected habitat corridors support recreation and biodiversity. Vegetation can provide shade and evapotranspiration, reducing heat exposure locally; permeable land can store rainwater; connected routes support walking and cycling. Green space can improve health and offer a valued public place, but access and quality differ across neighbourhoods.
Planning needs to consider who can reach green space, whether it is safe and accessible, how it is maintained and whether nature is displaced by development elsewhere. A new attractive park can increase nearby property values, sometimes contributing to green gentrification if residents cannot afford to remain. Community co-design, affordable housing protections and long-term maintenance can help distribute benefits more fairly. Green infrastructure complements drainage and flood engineering; it does not remove the need to assess extreme rainfall or maintain pipes and channels.
Reduce traffic congestion
Congestion occurs when travel demand exceeds road capacity at particular places and times. It increases journey times and uncertainty, can delay buses and emergency vehicles, and contributes to noise and air pollution. Urban traffic also takes space that could be used for homes, public space, walking or cycling. Widening roads can temporarily increase capacity but can encourage additional driving or move the bottleneck elsewhere.
Strategies include frequent and reliable buses, bus priority lanes, rail or rapid-transit connections, integrated ticketing, park-and-ride, safe walking and cycling routes, car sharing, parking management, traffic restrictions and coordinated land use that places homes and services near transport. Bristol’s Transport Strategy sets aims for accessible travel options, active transport, healthier streets, more reliable journeys and reduced congestion impacts. These are policy objectives; evidence about actual mode share, journey times, reliability and emissions is needed to judge results.
Transport changes involve trade-offs. Bus lanes may reduce road space for private cars but improve passenger reliability. Parking charges can encourage alternatives but affect people without a practical public-transport option. Cycle routes can improve safety and reduce short car trips, but need connected networks and secure parking. Park-and-ride may intercept car journeys, though it still involves driving and can induce development around the site. A strategy works best when modes and land-use decisions are planned together.
Bristol transport and access
Bristol City Council’s Transport Strategy aims for a well-connected, inclusive city with more realistic travel choices, healthier streets, active travel, more reliable journeys and reduced congestion impacts. This provides a named framework for explaining transport planning. Temple Quarter proposals add station improvements and better pedestrian, cycle and public-transport connections to the regeneration area. The intended mechanism is to make access to jobs, homes and services easier while supporting lower-carbon travel.
An evaluation should ask whether new routes link to where people live and work, whether services are frequent and affordable, and whether interchanges are safe and accessible. A new station entrance may improve passenger movement but does not solve congestion across every part of the city. Walking and cycling routes may reduce short car trips when the network is continuous; an isolated cycle lane may have little effect. New homes near a station can support public transport, yet rising rents can exclude households who might benefit most from the location.
The strategy’s goals should be compared with monitoring evidence such as bus journey reliability, public-transport use, cycling and walking counts, air quality, traffic delay and accessibility by neighbourhood. Data must be compared over similar periods and adjusted for population growth where possible. If congestion remains high, the plan may still have improved some journeys, but an evaluator needs to show which groups or areas benefited and which barriers remain. This turns a city policy into evidence-based case-study material rather than a list of ambitions.
Compare an urban strategy using sustainability criteria
| Criterion | Questions to ask |
|---|---|
| Environmental | Does it reduce emissions, pollution, resource use or flood/heat risk? What impact is shifted elsewhere? |
| Social | Who gains access, health, safety and affordability? Who is excluded or displaced? |
| Economic | What are capital and maintenance costs? Does it support reliable jobs and services? |
| Spatial | Which neighbourhoods benefit? Does it connect the centre, periphery and fringe? |
| Long-term | Will it function as population and climate conditions change? What monitoring will reveal failure? |
Use urban evidence critically
Population is not the only measure of urban change. Pair population and migration data with housing, service access, transport, employment and environmental indicators. If a city’s average income rises, ask whether inequality also changed. If a green-space total increases, ask whether access improved in deprived neighbourhoods. If public transport ridership rises, compare it with population growth and car use. Indicators should match the question.
The English Indices of Deprivation rank small neighbourhood areas relatively, not people individually. A deprivation decile shows how an area compares with other areas in England; it is not a direct percentage of residents experiencing every type of deprivation. Bristol’s 2025 headline report gives city-level measures and notes large variation between neighbourhoods. Use that variation to explain spatial inequality, but keep the date and domain clear.
For migration, distinguish net migration from the number of arrivals. A neighbourhood can receive many new residents and also have many departures. For transport, distinguish the number of commuters from mode share. For regeneration, distinguish approved plans from completed homes and jobs. Precise interpretation is a geographical skill, not just a statistical detail.
Maps, data and evidence
Compare dated population data and maps. Distinguish city proper from metropolitan area. Use transport or pollution data with clear units and avoid treating a citywide mean as every resident’s experience.
Map urban patterns at different scales
At world scale, use a population or city map to identify clusters, coastal locations and regional patterns. At UK scale, locate major cities including London, Birmingham, Manchester, Liverpool, Leeds, Sheffield, Bristol, Glasgow, Edinburgh, Cardiff and Newcastle. Do not imply that all major cities have the same size or function. At local scale, map the CBD, inner-city areas, transport corridors, industrial or port zones, suburban areas, green space and rural–urban fringe. A land-use map should include a key, date, scale and orientation.
An urban transect can be used to investigate how land use, building density, traffic or environmental quality changes from the centre to the fringe. Choose safe, representative sites and use the same observation method at each. A traffic count should use the same time interval; an environmental quality survey should define its scoring criteria; a land-use survey should use agreed categories. Keep the route and timing consistent and record weather, road works or unusual events that might affect the result.
Choropleth maps shade administrative or statistical areas by a value. A dark area indicates the data category in the legend, not that every resident has that characteristic. Small-area boundaries may not match neighbourhood names or lived experience. If two maps use different class intervals, their colours cannot be compared directly. A proportional-symbol map shows magnitude using symbol size, but large circles can obscure one another. Choose a map form that matches the question and explain what it reveals and hides.
Interpret a case-study statistic
When you use a population figure, state the year and boundary. Rio’s 2022 municipal count and its wider metropolitan population are not interchangeable. Bristol’s 2021 local-authority count differs from the wider urban region. A census is a snapshot, while an estimate is modelled and a projection assumes future trends. In a short answer, the boundary may be provided; in a case-study response, make it clear.
For growth rates, compare like with like. If a city grows from 400,000 to 440,000, it adds 40,000 people and grows by 10 per cent. A city growing from 2 million to 2.1 million adds 100,000 but grows by 5 per cent. The larger city adds more residents while the smaller city has the faster percentage rate. Neither measure alone shows whether housing or services kept pace.
Use census and deprivation data carefully. A migration table might show country of birth, not the date someone migrated. Ethnicity categories record self-identification under a particular census design. A relative deprivation index ranks neighbourhoods across the country, not individual households. A citywide rate can conceal inequalities by age, income, disability or neighbourhood. Pair an aggregate statistic with a map, survey or service-access measure where possible.
An evidence-based paragraph can follow this pattern:
- Claim: state the pattern that answers the question.
- Evidence: quote a figure, mapped location or trend with date and boundary.
- Explanation: connect the pattern to migration, natural change, jobs, services or planning.
- Qualification: state who or where the average may not represent, or note another cause.
- Link: return to the question and explain why the pattern matters.
Common misconception
Urbanisation is not just city growth in area. Regeneration benefits and costs can be uneven; ‘sustainable city’ is a goal to assess, not a label to assume.
Self-check
- What is the difference between urbanisation, urban growth and urban sprawl?
- Give one reason an urbanisation rate can rise without the urban population growing quickly.
- Distinguish a push factor from a pull factor and give one example of each.
- How can natural increase add to city growth?
- What makes a megacity, and why should its population boundary be stated?
- Name two reasons why Rio is important beyond its immediate neighbourhood.
- Explain one social and one economic opportunity created by Rio’s urban growth.
- Explain two challenges that may affect services in informal settlements.
- What did Favela–Bairro aim to improve, and why can in-place upgrading be preferable to relocation?
- Name one limitation that can reduce the long-term effectiveness of an upgrading project.
- What were Bristol’s local-authority population counts in 2011 and 2021, and what does the increase not tell you?
- Give one social, one economic and one environmental opportunity associated with urban change in Bristol.
- What is the difference between brownfield and greenfield land?
- State the main features proposed for Bristol Temple Quarter and distinguish proposals from outcomes.
- How can urban sprawl affect the rural–urban fringe?
- Name two ways a city can conserve water or energy and explain one trade-off.
- How can integrated transport strategies reduce congestion? Why might their benefits be uneven?
- Why is a neighbourhood deprivation score not a description of every resident?
Check your understanding
- Urbanisation is an increasing urban share of population; urban growth is a larger urban population or area; sprawl is outward, often low-density expansion into surrounding land.
- The urban share can rise because the rural population grows more slowly or falls, or because settlements are reclassified; the urban total can grow at a modest rate.
- A push encourages departure, such as limited rural services; a pull attracts people, such as access to education or work. These are examples, not universal motives.
- Births exceeding deaths increase population even without net migration.
- At least 10 million people in the defined urban area. A municipality and a metropolitan agglomeration can have different boundaries and totals.
- Rio is a state and metropolitan centre, a former national capital, and an international centre for tourism and culture, among other roles.
- Social opportunity might be access to education or specialist health services; economic opportunity might be employment in tourism, port logistics, industry or services. Explain access and unevenness.
- Examples include narrow or steep access making pipe installation difficult, or service demand growing faster than water, sanitation, energy and waste networks.
- The programme sought to integrate existing settlements through infrastructure and social services. In-place upgrading can preserve jobs, family networks and residents’ investment in homes; high-risk locations may still require carefully planned relocation.
- Maintenance, funding, incomplete coverage, population growth, tenure uncertainty or rising housing costs can reduce long-term impact.
- About 428,200 in 2011 and 472,400 in 2021, a 10.3% increase. It does not show the cause, where growth occurred or whether services kept pace.
- Answers should specify a local example and distinguish an opportunity from a measured outcome.
- Brownfield has previously been developed; greenfield is undeveloped in the relevant context. Both can have environmental, social and infrastructure value.
- The long-term plan proposes mixed-use homes, jobs, transport links, public realm and green space on about 135 hectares. These are programme intentions; completed outputs need separate evidence.
- It can consume farmland or habitat, increase travel distance and infrastructure needs, or provide needed housing and jobs. Evaluate the trade-off. 16–18. Answers should explain the mechanism, who benefits, who pays or is excluded, and what evidence would show the outcome.
Exam practice
Short and structured questions
Explain two factors that cause urbanisation. Make one explanation about migration and one about natural increase; do not use the two terms as synonyms.
Use a population table to compare urban trends in two countries. Quote figures and dates, distinguish totals from percentages, and link the difference to the development and demographic evidence supplied.
Explain how urban growth creates both opportunities and challenges in Rio. Use one named opportunity and one service or environmental pressure; show how both can occur in the same city.
Describe the pattern on a Bristol deprivation map. Refer to named areas only if they are shown, quote the legend and explain why a relative score cannot be applied to every household.
Explain how brownfield redevelopment may reduce pressure on the rural–urban fringe. Then give one reason why a brownfield site may be difficult or costly to develop.
Extended response: NEE city
Question: “Assess how urban planning can improve quality of life for people in a city in an LIC or NEE.”
Use Rio only if it matches the case study taught at your school. A strong plan sets out the starting issue—such as limited sanitation, drainage or safe access in a favela—then explains the Favela–Bairro measures and the route to improvement. Include community participation, social facilities and service provision as well as physical works. Evaluate coverage, long-term maintenance, risk, affordability and possible displacement. Distinguish the programme’s documented outcomes from the aim of integrating neighbourhoods.
A sample paragraph:
“Favela–Bairro aimed to improve existing Rio neighbourhoods by combining water and sewerage works with drainage, paved and lit streets, public spaces and social services. This package can improve health and access: sanitation reduces exposure to untreated waste, while better routes help residents reach jobs and services. Upgrading in place can preserve social networks and avoid moving households far from work. However, infrastructure needs maintenance and the programme did not provide the same improvements to every settlement. The best judgement is that upgrading can improve quality of life where residents help set priorities and funding sustains services, while relocation may still be needed in locations where serious hazards cannot be reduced safely.”
Extended response: UK urban regeneration
Question: “Evaluate the impacts of an urban regeneration project in a UK city.”
For Temple Quarter, distinguish why the area was identified from what the framework proposes. Assess brownfield reuse, housing, jobs, transport and green space against construction disruption, affordability, displacement, flood resilience and who gains. As the project runs over decades, use projected homes or jobs as planned outputs, not evidence of completed success. State what measures would show whether the project benefits existing residents as well as investors and new residents.
Extended response: sustainability
Question: “Assess strategies used to make urban living more sustainable.”
Compare at least two strategies that address different resources—for example, public transport and green infrastructure, or water conservation and waste reduction. Explain the mechanism and judge by environmental effectiveness, cost, equity, access and maintenance. A bus lane can make a bus more reliable but may affect road users; green space can manage heat and runoff but requires access and upkeep. Link the strategy to a named city where possible and acknowledge that sustainable outcomes require a coordinated package.
Mark your response
- Did I use an accurate example and state the population boundary and date?
- Did I explain cause and effect instead of listing factors?
- Did I distinguish opportunities, challenges and who experiences them?
- Did I use the data, map or case evidence in the question?
- Did I separate announced plans from completed outcomes?
- Did I reach a supported judgement that responds to the command word?
Revision points
Use place-specific evidence; discuss different groups and scales. Evaluate regeneration through outcomes, access and possible displacement.
Curriculum alignment
- Curriculum coverage IDs:
aqa.3.2.1.urban-issues - Related practice packs:
gcse_geo_p2_human_environment_june_2022,gcse_geo_p2_human_environment_june_2023,gcse_geo_p2_human_environment_june_2024,gcse_geo_p2_human_environment_november_2020,gcse_geo_p2_human_environment_november_2021 - Shared concept tags:
urbanisation,cities,urban-management,sustainability,population,migration,place
Sources
- Curriculum/specification: https://www.aqa.org.uk/subjects/geography/gcse/geography-8035/specification/subject-content/challenges-in-the-human-environment
- United Nations, World Urbanization Prospects 2025 — urban definitions, city trends and megacity projections.
- IBGE, Rio de Janeiro municipality profile — 2022 census population and municipal boundary.
- IBGE, 2022 Census of favelas and urban communities — national settlement totals and Rocinha population.
- Inter-American Development Bank, Favela–Bairro II evaluation — infrastructure, social services and reported outcomes.
- Rio Municipal Housing Department, Favela–Bairro — programme aim and urban-upgrading components.
- World Bank, Creating more livable cities: Rio de Janeiro metropolitan area — metropolitan economic and urban context.
- Office for National Statistics, Bristol Census 2021 population change — population change between 2011 and 2021.
- Bristol City Council, Census 2021 — migration, ethnicity, employment, housing and travel dashboards.
- Bristol City Council, Deprivation in Bristol 2025 — relative small-area deprivation and latest release.
- Bristol City Council, Temple Quarter regeneration framework — programme area, homes, jobs and timescale as proposals.
- Bristol City Council, Transport Strategy — access, active travel, congestion and transport aims.
- Bristol City Council, corporate strategy 2025–2030 — current priorities on inequality, housing, travel and climate resilience.
- Further reading: UN-Habitat: World Cities Report
- For case-study facts, use the source list and figures selected by your teacher; dates, totals and local conditions can change between datasets.