 FoxChild@Learn
14. The changing economic world
Curriculum status: Required core content.
This guide follows AQA GCSE Geography 8035. Named examples below are suggested teaching examples where the specification allows a school choice; use your teacher’s selected case study and verify current figures before an assessment.
Required knowledge
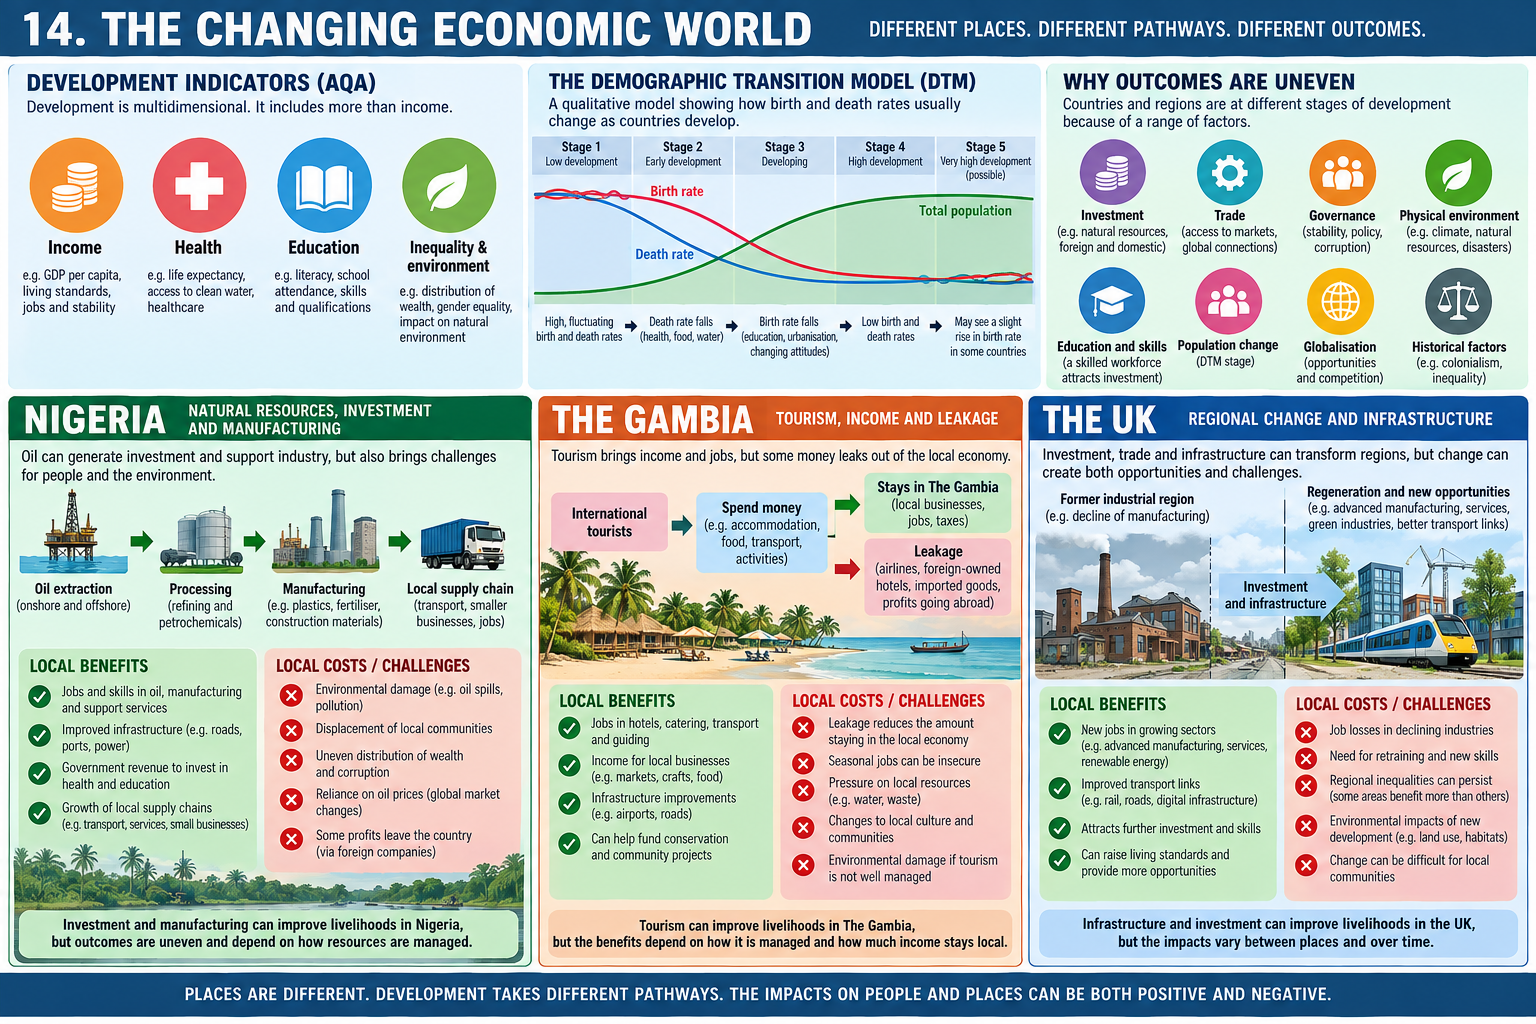
- Compare GNI per head, birth/death rates, infant mortality, life expectancy, literacy, access to safe water, people per doctor and HDI; explain limits and link the Demographic Transition Model to development.
- Explain physical, economic and historical causes of uneven development and consequences for health, wealth and migration; assess investment, industry, tourism, aid, intermediate technology, fair trade, debt relief and microfinance.
- Use one LIC/NEE country case study to assess sector change, manufacturing, TNCs, trade/political links, aid, environmental effects and quality of life; explain UK deindustrialisation, post-industrial growth, regional/rural change, infrastructure and global links.
Key vocabulary
| Term | Meaning |
|---|---|
| GNI per head | national income per person on average |
| HDI | composite health, education and income index |
| deindustrialisation | decline in manufacturing employment/output |
| TNC | transnational corporation |
| development gap | unequal outcomes and opportunities between places |
How the geography works
Development is multidimensional. Physical, historical and economic causes interact to shape uneven outcomes. Measures such as GNI, life expectancy, literacy, infant mortality, access to safe water and HDI reveal different dimensions; national averages conceal inequality. The Demographic Transition Model links changing birth/death rates to broad development patterns but is a model, not a forecast for every country. Investment, industry, tourism, aid, intermediate technology, fair trade, debt relief and microfinance may reduce some constraints, but results depend on governance, ownership and access. The UK has shifted from traditional manufacturing towards services, finance, research and information technology; infrastructure, government policy, rural population change and regional inequality shape its future.
1. Measuring development and quality of life
Vocabulary
| Term | Meaning |
|---|---|
| development | Change that can improve people’s economic, social, political or environmental wellbeing; it is broader than income growth. |
| economic development | Change in productive capacity, jobs, incomes and economic structure, ideally supporting improved living conditions. |
| GNI per head | Gross national income divided by population; an average measure of income received by residents, including some income from abroad. |
| PPP | Purchasing power parity, which adjusts comparisons for differences in the prices of goods and services. |
| HDI | Human Development Index, combining indicators of health, education and income into a composite measure. |
| infant mortality rate | Deaths of infants under age one per 1,000 live births in a stated period. |
| life expectancy | Average years a person might expect to live under the mortality rates of a specified population and period. |
| literacy rate | Share of people meeting a stated definition of literacy; definitions and age groups vary. |
| dependency ratio | Relationship between age groups likely to be economically dependent and those commonly considered working-age. |
| development gap | Unequal resources, opportunities or outcomes between places or groups. |
| primary sector | Extracting or producing raw materials, including farming, fishing, forestry and mining. |
| secondary sector | Manufacturing and construction that process materials or build goods and structures. |
| tertiary sector | Services such as retail, transport, health, education, tourism and finance. |
| quaternary sector | Knowledge and information activities such as research, software, data and some professional services. |
| globalisation | Increasing connections between economies and societies through trade, investment, communication, migration and production networks. |
| TNC | Transnational corporation operating and coordinating activity in more than one country. |
| aid | Assistance provided by governments, organisations or communities; may be emergency, development, technical, bilateral or multilateral. |
| intermediate technology | Technology designed to be affordable, maintainable and appropriate to local skills, needs and resources. |
| fair trade | A trading approach that seeks more stable and equitable terms for producers and workers, with standards varying by scheme. |
| microfinance | Small-scale financial services, including loans or savings products, often aimed at people underserved by mainstream banks. |
Classifying countries and places
Countries can be classified by income per head, by broader development measures, or by categories such as low-income country (LIC), newly emerging economy (NEE) and high-income country (HIC). Classification systems are useful shorthand for comparing patterns and discussing change, but they do not describe every person or place within a country. A large emerging economy may contain high-technology industries and households with very low incomes at the same time.
Income classifications use specified thresholds and are updated as data and methods change. A country may move between income groups without every household becoming better off; the classification is based on national averages. AQA uses LIC and NEE language for examples, but students should use the classification and figure provided in their course or question. Do not infer a country’s current group from an old textbook table.
Development is not a single ladder that every country follows in exactly the same way. Countries can improve in health and education while income growth remains slow; they can grow economically while inequality or environmental damage worsens. People also define a good quality of life differently, so indicators need context and community voice.
Economic and social measures
Gross National Income (GNI) per head divides national income by population. It gives an average but says nothing about distribution: two countries with the same average can have very different inequality. It can omit or undercount informal work, subsistence production and unpaid care. A country may have a high average because a small group controls valuable resources while most households have far lower incomes.
GNI per head may be reported in current US dollars or adjusted for purchasing power parity. Exchange-rate comparisons can change with currency movements; PPP accounts for the fact that similar goods cost different amounts in different countries. Students should identify the measure and year shown. A monetary average does not directly measure health, schooling, clean water, safety or political rights.
Birth and death rates describe events per 1,000 people per year. Infant mortality is deaths under age one per 1,000 live births. These indicators relate to health systems, nutrition, sanitation, education, income, disease and access to care, but one rate cannot explain every cause. Life expectancy summarises mortality patterns and can be influenced by infant deaths, conflict, disease and older-age mortality. It is an average, not a prediction for every individual.
Literacy provides evidence about education, but definitions vary by age, reading level and survey method. People per doctor can indicate health-care availability, but doctors may be unevenly distributed and the ratio does not show affordability, medicines, travel time or care quality. Access to safe water is a basic service measure; a household counted as having access may still face unreliable supply or distant collection depending on the definition.
The Human Development Index (HDI) combines health, education and income dimensions into one score. It allows broader comparisons than income alone, but its components are national averages and can hide differences by region, gender, ethnicity, income and disability. A composite index can also conceal the reason a country’s score changed. Compare the component measures when explaining a pattern.
Use a bundle of indicators
| Indicator | What it can show | Limitation to mention |
|---|---|---|
| GNI per head | Average income available to residents | Hides inequality, unpaid work and service access; sensitive to data and exchange-rate method |
| Birth/death rates | Demographic pattern and change | Influenced by age structure and definitions as well as development |
| Infant mortality | Early-life health and service outcomes | National average hides regional and household differences |
| Life expectancy | Overall mortality and health conditions | Does not describe quality of life or the experience of every group |
| Literacy | A dimension of education and opportunity | Literacy definition and survey coverage can differ |
| People per doctor | Approximate health workforce relative to population | Hides distribution, quality, workload and affordability |
| Safe-water access | Basic infrastructure and service reach | A connection may not guarantee safe, continuous or affordable supply |
| HDI | Combined income, health and education profile | Composite score can obscure components and inequality |
The most useful comparison depends on the question. If asked about quality of life, combine an economic indicator with social and service measures. If asked about health, use life expectancy or infant mortality and explain the service or environmental link. If asked to compare countries, quote the same year and method; use a map, table or graph to identify a pattern, then explain it rather than reciting the ranking.
Demographic Transition Model (DTM)
The DTM is a model linking changing birth and death rates to population change during industrialisation and economic development. In the traditional four-stage version, Stage 1 has high and fluctuating birth and death rates, with slow population growth. Stage 2 has falling death rates while birth rates remain high, so population grows rapidly. Stage 3 has falling birth rates and continued low death rates, so growth slows. Stage 4 has low birth and death rates and a more stable population. Some versions add a Stage 5, in which births fall below deaths and the population may age or shrink without migration.
Death rates often fall before birth rates because improvements in sanitation, clean water, food supply, vaccination and health care can reduce mortality relatively quickly. Birth rates may decline as education, urbanisation, access to family planning, child survival, women’s employment and the cost of raising children change. These changes vary by country and social group; none is a universal single cause.
The model helps connect demographic change with economic and social development, but it was based on broad historical patterns and does not forecast every country. Conflict, migration, epidemics, policy, cultural norms, climate shocks and uneven access to services can produce different paths. A country can have low birth rates in some urban groups and high birth rates elsewhere. Use the DTM as a model for comparison, not as a fixed timetable or judgement of a country’s worth.
The DTM can also help explain why population structure affects economic choices. A large child population increases demand for schools, vaccination and family services; it also means a large cohort may enter the labour market later. If education and decent work expand, a younger age structure can support a demographic dividend. If jobs, health care and training do not keep pace, rapid population growth can strain household and public resources. An ageing population creates different needs, such as pensions, accessible housing and care, while potentially retaining a skilled older workforce. The age structure is therefore part of the context, not a verdict on development.
Migration further complicates a country’s position in the model. Young adults moving to cities can change urban growth and the age profile of rural areas. International migration may bring remittances and skills, but can also remove trained workers from under-served places. Return migration may carry savings, knowledge or business links. Whether migration improves quality of life depends on rights, working conditions, family separation, the use of remittances and the availability of opportunity at the origin and destination. Use a specific pattern and avoid treating all migration as either a loss or a benefit.
2. Uneven development: causes and consequences
Physical causes
Physical conditions can influence the costs and opportunities of economic activity. Landlocked countries may face additional transport costs when goods must cross another state to reach a seaport. Mountain barriers, deserts or dense forests can make roads, railways, pipelines and service networks expensive to build. A country with few navigable rivers or natural harbours may have higher freight costs than one with easy access to ports, although engineering and trade agreements can alter this disadvantage.
Climate and water availability affect farming, health, energy and industry. Drought, unreliable rainfall or soil degradation can reduce yields and raise food prices. Tropical diseases can affect health and workforce participation. Floods, cyclones or heat can damage infrastructure and divert public spending towards recovery. At the same time, rivers, minerals, fertile soils, forests, wind, solar energy or scenic environments may support development. Resources create opportunities only when institutions, skills, infrastructure and fair management enable people to benefit.
Physical factors are not destiny. Technology, transport links, regional cooperation and public policy can reduce the effect of barriers. Countries with similar climates can have different outcomes because their histories, institutions, trade relationships and investments differ. A good answer describes the physical condition and then explains the mechanism by which it affects access, productivity, cost or risk.
Historical and political causes
Colonial rule shaped infrastructure and trade in many regions. Railways and ports were often designed to move raw materials from inland areas to export terminals rather than to connect domestic markets evenly. Political control, land ownership, education systems, borders and administrative structures were also changed. After independence, countries inherited economies and institutions shaped by those decisions. These histories influence current development, but present-day outcomes also reflect post-independence choices and global relationships.
Conflict and political instability can damage homes, schools, clinics, farms and transport networks. People may be displaced, investment may fall and governments may spend more on security or emergency response. Conflict can also be linked to inequality, competition over land or resources, political exclusion and external intervention. Avoid stating that “poverty causes conflict” as a single one-way explanation; relationships are complex and can form a feedback loop.
Governance affects whether taxes, natural-resource revenue and aid are converted into services and infrastructure. Corruption, weak accountability, policy instability or limited administrative capacity may reduce the effectiveness of investment. Effective public institutions can support education, health, legal rights, infrastructure and an environment in which businesses and workers can plan. Outcomes depend not only on formal rules but on participation, power and access to justice.
Economic causes
Dependence on a narrow range of exports can make an economy vulnerable to world prices, weather and external demand. If a country exports raw materials but imports higher-value manufactured goods, it may receive a smaller share of value created along a global supply chain. Prices for primary commodities can fluctuate, complicating government budgets and business investment. Diversifying production, processing more locally and improving skills can increase value added, though new industries face costs and competition.
Debt can constrain spending when interest and repayments use a large share of government revenue. Low tax revenue, weak infrastructure, limited access to finance and small domestic markets can make it harder to fund schools, power networks, roads or health services. Multinational corporations may bring investment and technology but can repatriate profits; domestic suppliers may not benefit if links are weak. Trade rules and bargaining power influence which countries gain from globalisation.
Globalisation can create export markets, foreign investment, remittances, tourism and access to ideas or technology. It can also expose domestic firms to competition, make jobs sensitive to global downturns and shift environmental costs to places with weaker protections. The benefits depend on wages, tax systems, worker rights, local supply chains and whether communities can influence decisions.
Consequences of the development gap
Uneven development can create differences in income, life expectancy, child health, education, safe water, housing, employment security and access to technology. Wealthier groups within a lower-income country may have high-quality services while remote or marginalised communities have limited access. Inequality is therefore visible between countries and within them.
International migration can be one response to disparities in safety, work, education, family links and services. People may move voluntarily for opportunities, or be displaced by conflict, persecution or environmental hazards. Migration can provide remittances to families and labour to destination regions, while skills loss can affect places of origin. Effects depend on who migrates, the conditions of movement and whether workers can exercise their rights. Do not present migration only as a problem or assume everyone from a lower-income country wants to leave.
Differences in health and education can reinforce economic disadvantage. Poor health can make it harder to study or work; limited education can restrict job options and income; low income can reduce access to food, housing and care. This is a feedback loop rather than a fixed fate. Public investment, community programmes and economic opportunities can weaken it, especially when they are accessible to groups who have been excluded.
Strategies for reducing the development gap
No single strategy automatically closes the gap. Assess the mechanism, scale, duration, who controls the benefit, who pays, environmental effects and whether the approach builds local capacity.
Investment can fund roads, ports, electricity, digital networks, water, schools and businesses. Infrastructure can lower transport costs and make jobs or services accessible. Private investment may create work and tax revenue; public investment may reach communities where profit is less certain. Risks include debt, land acquisition, uneven access or facilities that serve export enclaves rather than local needs. Maintenance and affordability determine whether an investment continues to help.
Industrial development can shift work from primary extraction towards processing and manufacturing. Factories may create jobs, skills and demand for suppliers; they can add value before goods are exported. Industrial growth requires reliable energy, transport, trained workers, finance, standards and markets. It may increase pollution or resource use, and low wages or weak labour rights can limit benefits. Industrial parks can concentrate activity in one city and widen regional gaps unless transport, skills and local sourcing spread the gains.
Tourism can bring foreign currency, jobs and demand for transport, food, accommodation, crafts and cultural services. Community-based or nature tourism can route some income to local businesses and conservation. Benefits may leak abroad through foreign-owned resorts, imported food and package-tour operators; jobs can be seasonal or low-paid; coastal and wildlife sites can be damaged. Local ownership, training, procurement, access to land and environmental limits shape the outcome.
Aid may be emergency relief after disaster, long-term development assistance, technical support, loans or grants; it can be bilateral or channelled through multilateral institutions and NGOs. Aid can support vaccines, schools, water systems, agriculture, infrastructure, training and disaster preparedness. It can also be tied to donor priorities, create dependency, bypass local institutions or fund projects that communities cannot maintain. Assess aid by outcomes, accountability, local ownership and additionality, not only by the amount announced.
Intermediate technology uses tools and systems that are affordable, repairable and suited to local materials, skills and conditions. Examples include small-scale solar systems, efficient cookstoves, drip irrigation, water filters or locally maintainable processing equipment. They can improve productivity and services without waiting for a large national network. The technology still needs training, spare parts, financing, safety standards and community choice; a small-scale solution may not meet every household’s needs.
Fair trade aims to improve producers’ bargaining power and working conditions through standards such as minimum pricing, premiums, labour criteria and long-term relationships. It can support investment in cooperatives or community projects. Certification costs, market access, price volatility and the proportion of product actually sold under certified terms affect impact. Fair trade can help some producers but cannot by itself change global price structures or guarantee that all workers benefit.
Debt relief can reduce repayment obligations and release public money for services or investment. Its effect depends on the size and terms of debt, how savings are used, future borrowing and economic conditions. Debt cancellation does not automatically produce better health or education; transparent budgets and accountable institutions matter.
Microfinance can provide small loans, savings, insurance or payment services to people excluded from commercial finance. It may help a person buy tools, stock or equipment and expand a small enterprise. A loan must be repaid and can create debt stress if income is uncertain, interest or fees are high, or a borrower faces illness or climate shocks. It is not a substitute for good jobs, public services, worker protections or wider investment.
| Strategy | Possible contribution | Questions for evaluation |
|---|---|---|
| Investment | Builds infrastructure and productive capacity | Who uses it? Can it be maintained? Does it increase debt or displacement? |
| Industry | Adds jobs, skills and value to production | Are jobs secure and well paid? Are pollution and profits fairly managed? |
| Tourism | Earns foreign exchange and supports local services | How much income stays local? Is work seasonal? Are ecosystems protected? |
| Aid | Funds services, emergency response or expertise | Who sets priorities? Is funding reliable and accountable? |
| Intermediate technology | Provides locally usable tools and services | Can local people repair, afford and adapt it? |
| Fair trade | May improve producer income and standards | What share reaches workers, and who can access certification? |
| Debt relief | Frees some government revenue | Is the saving spent transparently on long-term development? |
| Microfinance | Expands financial access for small enterprises | Are terms safe, and can borrowers manage risk and repayment? |
3. Country case study: Nigeria, an example of a newly emerging economy
Case-study choice: Nigeria is a suggested AQA NEE example. Your school may use another country. Learn the case your teacher has selected, and keep statistics attached to their year, definition and source.
Location and importance
Nigeria is on the Gulf of Guinea in West Africa. It shares borders with Benin, Niger, Chad and Cameroon, and has a long coastline on the Atlantic. Abuja is the federal capital; Lagos is the largest city and a major port, commercial centre and transport hub. The Niger and Benue rivers meet in central Nigeria before flowing through a delta into the Gulf of Guinea. This provides important water, farming, transport and ecosystem connections, although flooding and water quality vary by place.
Nigeria matters regionally because it is a large West African state with a substantial population, market and diplomatic role. Globally, it is connected through oil and gas, agriculture, manufactured products, digital services, migration, music and film. It is a member of the African Union, ECOWAS, the Commonwealth and OPEC. These links can create markets and cooperation while also exposing the country to decisions made by trading partners, international companies and commodity markets.
Population estimates are not a substitute for understanding settlement. Many people live in the south and southwest, including the Lagos region, while the north has different climates, economic histories and infrastructure. Nigeria contains more than 250 ethnic groups and hundreds of languages; English is the official language alongside widely used Nigerian languages such as Hausa, Yoruba and Igbo. It is a federal republic made up of 36 states and the Federal Capital Territory. Avoid treating a very large, diverse country as a single uniform place.
Economic change and the balance between sectors
The primary sector includes oil and gas, farming, fishing and mineral extraction. Oil became central to export revenue after major discoveries in the Niger Delta in the mid-twentieth century. Petroleum exports can provide foreign exchange and government income, but dependence makes budgets and the exchange rate vulnerable to global prices and production disruption. Oil is geographically concentrated, and the communities that live near extraction sites do not automatically receive an equal share of national revenue.
Agriculture remains important for livelihoods and domestic food. Smallholders and commercial farms produce crops that include cassava, yams, maize, rice, cocoa and groundnuts, with patterns varying across ecological zones. Farming faces challenges including access to roads, storage, finance, irrigation, markets and inputs. A poor harvest or difficulty transporting produce can increase food prices even where crops have been grown. Processing and refrigeration can reduce losses and create value-added work, but need reliable electricity and investment.
Secondary activity includes food processing, cement, textiles, construction materials, refining and manufacturing. Industrial growth can create skilled and semi-skilled work, supplier demand and tax revenue; domestic production can also reduce reliance on some imports. Constraints include expensive or unreliable electricity, transport bottlenecks, access to credit, imported inputs and competition. Industrial capacity therefore does not grow simply because a country has a large population or natural resources.
Services include trade, telecommunications, finance, transport, education, health, entertainment and public administration. Lagos has a particularly large commercial and creative economy. Nigeria’s film and music industries distribute content to audiences across Africa and the global diaspora. Digital financial and communications services can create new firms and make it easier to pay, coordinate transport or access information, but connectivity and affordability remain uneven.
The structure of an economy can be compared through employment and output. A sector’s share of GDP is not the same as its share of jobs: oil may generate high value with fewer direct workers than agriculture or retail. Informal activity may also be undercounted. A sound case-study answer distinguishes where output is generated, who is employed, and who receives income. Changes between sectors can happen at different speeds and do not mean that every household moves directly from farm work to a formal office job.
Manufacturing, supply chains and development
Manufacturing can support development through several connected effects. A local factory may hire workers, train technicians, buy services, pay taxes and produce goods for domestic or export markets. If firms buy from local farmers and suppliers, the effects can spread beyond the factory. Processing cocoa, cassava or agricultural products locally can capture more value than exporting only an unprocessed crop. Repair, logistics, design and packaging can add further jobs.
The benefits depend on conditions. Reliable electricity and transport lower the cost of production; predictable regulation and access to finance help firms plan; education and training help workers move into technical roles. Firms must also meet quality, safety and environmental standards. If most components are imported, profits leave the country, or industrial activity is concentrated in one enclave, local multiplier effects may be limited. Low wages and poor working conditions can attract investment without delivering a fair improvement in quality of life.
Industrialisation can increase pollution, greenhouse-gas emissions, water demand and waste. These impacts are not inevitable at the same level: enforcement, cleaner energy, safer processes, wastewater treatment, worker protection and responsible land-use planning can reduce them. However, environmental controls cost money and need to be monitored. A balanced evaluation asks whether the activity creates durable skills and local value while respecting people’s health and rights.
Transnational corporations (TNCs)
A TNC organises production or services in multiple countries. It may invest directly, own or operate a facility, form a joint venture, contract local suppliers or buy resources. In Nigeria, oil companies have played a major role in exploration and production. AQA materials use oil-industry history, including Shell-BP activity, as an example; use the precise company and dates taught in your class notes.
Potential host-country advantages include investment that might otherwise be unavailable, employment, technical knowledge, worker training, infrastructure, exports, government royalties and tax. A TNC can connect producers to international markets and introduce safety or production systems. Suppliers may improve their standards to meet the buyer’s requirements. Workers can gain valuable expertise that later supports other industries.
Potential disadvantages include profit repatriation, a limited number of direct jobs relative to the value exported, bargaining power favouring the company, dependence on one commodity and pressure on land or local livelihoods. Tax incentives can reduce public revenue; weakly enforced standards can transfer costs to communities. Contract work and indirect employment can be insecure. Infrastructure built for extraction may connect a field to a port without improving access to services for surrounding settlements.
The impacts are not identical in every location or year. They depend on the ownership model, tax and royalty agreements, labour arrangements, local procurement, environmental safeguards, community participation and the distribution of public revenue. Do not write simply that “TNCs are good” or “TNCs are bad.” Identify the group gaining or losing, explain the mechanism, and judge whether benefits are wide, durable and fairly distributed.
Oil, trade and the Niger Delta environment
The Niger Delta’s wetlands, mangroves, creeks and communities support fishing, farming and biodiversity as well as oil production. Oil spills and other petroleum pollution can contaminate soils, waterways and sediments. Pollution can affect livelihoods and health, and it may take many years of monitoring and remediation to restore particular sites. The United Nations Environment Programme’s assessment of Ogoniland documented serious contamination and recommended a long-term clean-up and restoration programme. It also noted that remediation needs effective institutions, community participation and sustained funding.
This is a useful example of the tension between national revenue and local environmental risk. A country may earn export income while nearby communities experience costs that do not appear in national GDP. A spill response, remediation project or compensation payment may not quickly restore fishing grounds, trust or household income. The geography is also not a simple story of pollution from one cause: the source and responsibility for each incident need investigation, and illegal refining, sabotage, ageing infrastructure and operational failures have all been discussed in the Niger Delta context. Name a specific source before assigning responsibility.
Current clean-up programmes provide an opportunity to consider how development is managed over time. The Hydrocarbon Pollution Remediation Project (HYPREP) reports work in Ogoniland, including remediation and community infrastructure. Programme updates are evidence of reported outputs, but students should separate a project milestone from independently measured environmental recovery. Useful questions include: has the contaminated site been treated to a verified standard; are mangroves and water quality recovering; can local people safely resume livelihoods; were affected communities consulted; and will monitoring continue?
Trade and political relationships
Oil exports connect Nigeria to global energy markets. The destination and price of exports can shift as buyers change energy sources or suppliers. Oil revenue may support imports of machinery, refined products, medicines, vehicles and manufactured goods. If export earnings fall or production is interrupted, public revenue and foreign-exchange availability can be affected. Diversifying exports and processing more goods domestically can reduce—but does not immediately remove—this exposure.
Trade relationships include regional markets in West Africa and wider links with Europe, China, the United States and other partners. ECOWAS offers a regional framework for trade and movement, although infrastructure and border procedures can limit practical exchange. Nigeria’s Commonwealth membership reflects historical and political links, while OPEC membership relates to petroleum policy. These institutions create channels for negotiation, shared rules and coordination; they do not guarantee that every trade relationship has equal power or benefit.
Political and trading relationships change over time. A trade agreement, tariff, security partnership, investment decision or international price shock can alter incentives for firms. The country’s own policy choices—such as investment rules, local-content requirements, trade controls and infrastructure spending—also shape how globalisation affects livelihoods. When writing a case study, be clear whether a link is a membership, an agreement, a flow of goods, an investment or a diplomatic relationship.
Aid and development programmes
International assistance can be humanitarian relief after a flood or displacement, long-term funding for health and education, infrastructure finance, technical advice or support from NGOs and community organisations. A grant does not have to be repaid; a concessional loan is borrowed on more favourable terms than some commercial lending but still creates a repayment obligation. Aid can be bilateral, from one government to another, or multilateral, managed through an international organisation.
The effect depends on design. Vaccination, maternal health, school access, water supply, disease surveillance, agricultural extension and disaster preparation can improve the conditions that underpin development. Training local professionals or maintaining a service after a grant ends can make benefits last. If a project is planned without residents, depends on imported expertise, lacks repair funding or is tied to the donor’s commercial aims, the impact may be smaller or uneven.
Large development programmes can also reveal an important measurement question: is success counted as money spent, facilities built, people reached, or sustained change in health, income or resilience? These are different measures. A school building is an output; regular attendance and improved learning are outcomes. A water point is an output; reliable, safe and affordable water over time is an outcome. A careful evaluation asks for evidence at both stages.
Quality of life and uneven outcomes
Economic growth can improve quality of life if it raises reliable incomes, expands jobs and public revenue, supports health and education, and reaches places and groups with unmet needs. In Nigeria, a national growth figure cannot tell us whether a rural farmer, an oil worker, a Lagos trader and a displaced household have all experienced the same change. National GDP can rise at the same time as inflation erodes purchasing power for poorer households.
The World Bank World Development Indicators page reports Nigeria’s population at about 237.5 million in 2025, GDP growth of 4.0% in 2025, life expectancy of 55 years in 2024 and access to electricity for 62.5% of the population in 2024. Its $3.00-a-day poverty measure (2021 PPP) is 41.8% for 2022. These figures have different reference years and should not be presented as one snapshot. A separate national poverty estimate can use a different poverty line and survey method, so two poverty percentages may not be directly comparable. Always identify the indicator and year.
Electricity access also does not mean a continuous, reliable supply to every connected household or business. A national percentage hides differences between rural and urban places and between wealth groups. Life expectancy is an average and does not show local health-service access. Poverty measures count people below a defined threshold; they cannot alone describe housing security, unpaid work, safety or social participation. Combining indicators gives a fuller account.
If rising production creates skilled employment and stable public revenue, the government may be able to fund roads, clinics, schools and water systems. Better transport and digital access can make jobs and services easier to reach. These gains can be limited if employment is concentrated in a few cities, prices rise faster than incomes, environmental damage reduces livelihoods or public money is not converted into accessible services. Economic growth provides an opportunity for development, not a guarantee of equal wellbeing.
Nigeria case-study chain
Use a linked explanation instead of listing isolated facts:
- Location and connection: coastal access and large markets connect Nigeria to regional and global networks.
- Economic opportunity: oil, agriculture, manufacturing and services generate output, exports and jobs.
- Multiplier potential: local purchasing, training and tax revenue can spread benefits to workers, suppliers and public services.
- Constraints and trade-offs: uneven infrastructure, commodity exposure, pollution, insecure work and inequality can concentrate costs or profits.
- Management and judgement: policy, local participation, regulation, diversification and sustained investment influence who benefits.
This chain helps answer questions about the role of manufacturing or TNCs in development. For example, a company can increase exports and tax receipts, but if most equipment is imported, few workers are hired and pollution harms local livelihoods, the overall benefit may be limited. If local firms supply inputs, workers gain transferable skills, public revenue funds services and safeguards are enforced, the multiplier may be broader. Use case evidence to decide which account is better supported.
Development strategy in context: evaluating aid and investment
Nigeria illustrates why the same strategy can have different effects across regions. A power project may increase national generating capacity, but households and businesses only benefit if transmission and distribution reach them, supply is dependable, tariffs are affordable and the network can be maintained. A road can reduce travel time to markets but may bypass remote settlements or encourage land conversion. An agricultural loan can support equipment but leave a smallholder exposed to debt if drought destroys the harvest. Evaluate the complete chain from finance to access and long-term outcomes.
Aid and international development finance can support infrastructure and services, but the type of finance matters. A grant avoids a repayment obligation; a loan adds one. A project’s scale may be impressive, yet its future operating costs can become a burden if the receiving authority cannot fund repairs. Donor coordination and alignment with a locally chosen plan can prevent multiple agencies from building incompatible systems. Public participation can also reveal which groups are excluded from a proposed service.
Investment may come from domestic companies, government, a TNC, a development bank or a public–private partnership. Each arrangement distributes risk differently. Private finance may bring capital and expertise but often seeks a return; public authorities may need to guarantee revenue or purchase the service. A public project may have a wider service goal but still need transparent procurement and independent monitoring. Ask who owns the asset, who sets prices, who pays when costs rise and who is accountable if the project fails.
Nigeria and quality-of-life data: a dated evidence panel
| Evidence point | Reported value and year | How to use it responsibly |
|---|---|---|
| Population | 237.5 million, 2025 | Shows national scale; it does not show distribution between regions or cities. |
| Annual GDP growth | 4.0%, 2025 | Shows a change in total output; it is not the same as a rise in every household’s income. |
| GDP per capita, current US dollars | US$1,224.30, 2025 | An average using current exchange rates; it does not adjust for all cost differences or inequality. |
| Life expectancy at birth | 55 years, 2024 | A national health outcome; compare years and explain regional variation. |
| Access to electricity | 62.5%, 2024 | Access does not guarantee reliable supply, affordability or equal distribution. |
| Poverty at US$3/day, 2021 PPP | 41.8%, 2022 | Uses a particular international line and survey year; it differs from national poverty estimates. |
These figures come from the World Bank’s country data page, which brings together indicators with different publication and reference dates. Recheck them before an examination, and do not mix them with figures from another definition. A well-chosen statistic strengthens an explanation only when the student states what it measures and what it cannot show.
4. Example of tourism reducing the development gap: The Gambia
Why tourism matters
The Gambia is a small West African country shaped by the east–west course of the River Gambia. It is almost surrounded by Senegal and has an Atlantic coastline. Its beaches, warm climate, wildlife, river landscapes and cultural heritage support tourism. The river is also central to settlement, farming, transport and ecosystems. This makes tourism a useful example of a service industry that depends on environmental quality and local places.
Tourism can reduce a development gap through foreign-exchange earnings, jobs and spending in a destination. Visitors may pay for accommodation, transport, guides, restaurants, crafts and excursions. These purchases can create direct employment and indirect demand for food, construction, laundry, maintenance and local transport. Workers and businesses then spend part of their earnings in the local economy, creating a multiplier effect. Government may collect taxes and fees that can support services or infrastructure.
The World Bank’s current country overview reports that tourism supported service-sector growth in The Gambia in 2025; it estimates overall growth at 5.9% that year, with tourism exports and higher labour incomes among the contributors. These are national macroeconomic estimates, not evidence that each tourist worker became better off. They show why tourism has economic significance, but not how the benefit is divided between international operators, local firms, employees and communities.
How income may spread
Tourism creates the strongest local linkages when hotels and tour companies buy local produce, use local repair and transport businesses, employ and train Gambian staff, and promote locally owned accommodation, restaurants and guiding. A visitor who buys a meal from a local business may support farm suppliers, market traders and workers. Cultural or river-based experiences can create income in places beyond a beach resort, if communities shape the experience and retain a fair share of earnings.
Training can raise the value of work. Hospitality, language, guiding, digital marketing and business skills may help workers progress into supervisory roles or establish their own enterprises. Small firms can diversify their customer base by selling to domestic visitors and other industries as well as overseas package tours. However, training alone cannot guarantee advancement if senior roles remain inaccessible or finance and land are difficult to obtain.
The Tourism Diversification and Resilience Project is an official programme intended to strengthen tourism competitiveness, climate resilience and micro, small and medium-sized enterprises. It can be used as an example of planned intervention, but distinguish aims and finance from outcomes. A proposed investment only demonstrates an expected benefit until businesses are supported, infrastructure is completed and livelihood or environmental results are measured.
Leakage, seasonality and vulnerability
Tourism earnings may leak out of the destination when hotels are foreign-owned, profits are repatriated, package tours are sold abroad or food, fuel and equipment are imported. Some leakage is difficult to avoid: a small economy may need to import specialist goods. Yet stronger local supply chains can keep a greater share of visitor spending in the country. Measure the local share, not only the gross value of visitor spending.
Tourism work can be seasonal. Many visitors may arrive in a peak period, while workers have fewer paid hours at other times. Contract and service jobs can be low paid or insecure. An economic downturn, travel disruption, political instability, health emergency or extreme weather can reduce arrivals quickly. Dependence on one market or one type of tourist makes an economy vulnerable. Diversifying products and strengthening other sectors can improve resilience.
Coastal concentration can create pressure on land, water, waste systems and ecosystems. Resorts may compete with residents for beaches, freshwater or building land. More flights create emissions; poorly treated wastewater can harm coastal habitats; construction can damage dunes and natural flood buffers. Nature tourism can provide a financial reason to protect an environment, but only when visitor numbers, access and benefits are managed with local participation.
Diversifying tourism and sharing benefits
The river and inland landscapes offer a possible alternative to relying only on coastal stays. Community-led river tourism might include guided boat journeys, wildlife interpretation, heritage or craft activities. The World Bank circular-economy assessment highlights the potential of diversified, community-based tourism and better links to local suppliers. Proposals such as electric boats or new river facilities are plans whose impacts must be evaluated after implementation. They require safe access, maintenance, trained operators, community consent and protection of river habitats.
Tourism planning can spread benefits by improving local roads and jetties, providing training, supporting small businesses and ensuring that residents have access to essential services. Yet an access road can also change land values or encourage development into sensitive areas. Environmental assessments, transparent land agreements, local procurement and monitoring help residents participate in decisions and protect long-term livelihood assets.
Judgement: can tourism narrow the gap?
Tourism can contribute to narrowing a development gap if new work is safe and fairly paid, a meaningful share of revenue stays local, small firms can participate, and public spending improves services. Its effects may be limited where high-value ownership and supply chains are external, jobs are seasonal, or costs to water, land and ecosystems are carried by residents. Tourism works best as part of a wider development strategy rather than a single solution. In an exam judgement, weigh earnings and employment against leakage, vulnerability and environmental limits, then state the conditions that make the strategy more effective.
Tourism evidence: measure the whole chain
A visitor total is not the same as the value of tourism to residents. To trace the effect, follow the money from the visitor to the tour operator, hotel, employee, farm supplier and public authority. Some spending becomes wages or orders for local firms; some pays for imported food and fuel, finance, management fees or profits that leave the destination. The domestic share can rise when local firms have access to contracts, credit, training, marketing and reliable infrastructure.
Tourism can also affect the cost of living and access to land. A resort may increase competition for coastal land or water. A rise in property values can benefit landowners but make housing less affordable for local workers. Hotel construction can create short-term jobs; long-term employment depends on visitor demand and whether businesses remain viable across low seasons. A study should therefore distinguish the construction phase from continuing jobs and compare seasonal pay with the annual cost of living.
The Gambia’s Tourism Diversification and Resilience Project represents an attempt to address some of these risks through support for small businesses, product diversification and more resilient infrastructure. Evaluation needs indicators such as local procurement, wages, the proportion of businesses owned by residents, visitor distribution through the year, participation by communities, freshwater use and coastal condition. Targets and funding are evidence of policy intent; only monitoring after delivery can show which groups benefited and whether environmental pressure was reduced.
5. Economic change in the UK
Deindustrialisation and globalisation
The UK’s economy has shifted from a larger manufacturing and extractive base towards services, finance, research, information technology, education, health, logistics, creative industries and advanced manufacturing. This change is called deindustrialisation when the traditional industrial base and associated employment decline. It has not meant that all manufacturing disappeared; the sector has become more specialised, productive and technologically advanced in many places.
Several factors interact. Some coalfields and older raw materials became less competitive or were depleted. New technologies allowed more output with fewer workers. Globalisation enabled companies to move some production to places with lower costs or new markets. International competition affected older industries such as textiles, shipbuilding, steel and manufacturing. Government policies influenced privatisation, investment, energy, education, regional support and transport. A strong explanation identifies the local industry and time period rather than claiming one cause explains change everywhere.
Deindustrialisation can reduce employment, supplier demand and local tax bases in towns where one industry dominated. A closure can leave derelict land, vacant buildings and a loss of skilled jobs. Workers may need retraining, but the new opportunities may be elsewhere or require different qualifications. Young people may move away, reducing demand for local services. At the same time, cheaper imported goods, technological improvements and new service or manufacturing sectors can benefit consumers and the national economy. Outcomes vary with the ability of workers and places to adapt.
Moving towards a post-industrial economy
A post-industrial economy has a greater share of employment and output in services and knowledge-based activity than in traditional manufacturing. Information technology supports banking, design, media, research, logistics and remote work. Finance and business services are concentrated in some cities, while health, retail, education and hospitality are distributed more widely. Science parks, universities and business parks can bring researchers, skilled workers, firms and investors together.
These sectors may generate high-value jobs and exports, but they can require advanced qualifications, strong digital infrastructure and access to finance. High-paid work can cluster in major cities while routine or insecure work is more widely dispersed. Automation and outsourcing can affect service jobs as well as factories. A post-industrial shift therefore changes the type and location of employment; it does not automatically solve regional inequality.
Modern manufacturing remains important. Advanced materials, aerospace, pharmaceuticals, food processing, clean-energy equipment and precision engineering combine skilled labour with research and digital systems. These industries may be smaller in workforce than historic mass production, yet they can have large supply chains and export value. The geography of a production network may link a research centre, component suppliers, an assembly plant, a port and international customers.
Example of more environmentally sustainable industrial development: offshore wind in Hull
Siemens Gamesa’s blade manufacturing facility in Hull provides a UK example often used to discuss a modern industry associated with renewable energy. The company has announced investment and contracts connected to the factory; its published material has stated that the Hull facility supports around 1,300 local jobs. Use that as a company-reported employment figure and attach the date and context of the announcement. It is not the same as an independent estimate of all jobs that would exist over the lifetime of a turbine.
The potential benefit is a combination of manufacturing, supply-chain work and equipment for offshore electricity generation. Wind power produces electricity without direct combustion emissions at the turbine, and offshore sites may have strong wind resources. A manufacturing base can support technical training and local supplier opportunities. Ports, engineering colleges and transport links can connect the factory to wider energy infrastructure.
The label “renewable” does not mean “impact-free.” Turbine manufacture uses steel, composites, rare or energy-intensive materials and large transport systems. Construction can affect marine environments and other sea users; grid connections require infrastructure; blades and components need a credible end-of-life plan. The factory itself uses energy and materials. Environmental performance must therefore be considered across manufacture, construction, operation, maintenance and decommissioning.
This is environmentally more sustainable when clean electricity displaces higher-carbon generation, supply chains reduce their own impacts, worker safety is protected, components are reused or recycled, and communities benefit from jobs and infrastructure. The overall effect depends on what energy source is replaced and how the full system is managed. A case-study evaluation should describe both the industrial opportunity and its limits.
Population change in rural areas: growth and decline
Rural areas do not all have the same population trend. Some accessible and attractive locations gain residents as people retire, commute, work remotely or seek housing outside major cities. Others lose young adults when education and skilled employment are concentrated elsewhere. Natural change, housing supply, migration, second homes, tourism and transport all shape the pattern.
Cornwall is one example of rural and coastal population growth. The Office for National Statistics reported that its population rose from about 532,300 in 2011 to 570,300 in 2021, an increase of 7.1%. This census-period figure describes the whole local authority area and does not mean every settlement grew. Growth can increase demand for homes, schools, health care, water and transport. In areas with high housing demand, local workers may find it difficult to afford homes, especially where second homes or holiday lets are significant. Tourism can support jobs while also creating seasonal employment and pressure on services.
Parts of rural Wales provide examples of decline over the same census period. The ONS reported population falls in Ceredigion and Gwynedd between 2011 and 2021. A falling population may reduce the local customer base for shops, bus routes and services; an older age structure can increase care needs while the working-age population shrinks. If young adults leave for university or work and do not return, skills and enterprise may be lost. Yet migration and language patterns differ between communities, so a single statistic cannot explain local experience.
Growth and decline both create management challenges. Growing rural places may need affordable housing, public transport, water and waste infrastructure, and protection of farmland and landscapes. Declining places may need ways to retain services, improve digital connectivity, attract employment and support local enterprise. Tourism or second homes can bring investment but are not a complete replacement for year-round jobs. Planning should consider residents’ needs and the environmental capacity of each place.
Infrastructure, connectivity and employment
Roads and railways affect journey times, access to jobs and the movement of goods. Better links can help firms reach workers, suppliers and markets. New or improved infrastructure can also increase noise, emissions, land take, habitat fragmentation or development pressure. Evaluate who receives better access, what economic activity follows and how environmental costs are reduced.
Ports support trade by sea and connect manufacturing and distribution to international networks. Airports provide passenger and cargo connections, support tourism and business travel, and create jobs. Expanding capacity can strengthen connectivity but may increase noise, congestion and greenhouse-gas emissions. The place-based benefits may be concentrated around the hub while the impacts are experienced by neighbouring communities.
Digital communication is also infrastructure. Broadband and mobile networks can make remote work, online learning, business services and digital markets more accessible. Yet access depends on coverage, price, device availability, skills and reliability. A digital connection does not substitute for every face-to-face service or physical transport need. It can reduce some distance barriers while leaving others in place.
Infrastructure investment has a multiplier effect when it generates local jobs, allows firms to expand, and improves residents’ access to opportunity. The effect is weaker where projects are delayed, unaffordable, poorly connected to local communities or not maintained. An assessment should separate a promised benefit from a measured outcome and consider the time needed for new connections to change employment patterns.
The north–south divide and regional inequality
The phrase north–south divide describes broad economic differences between parts of the UK, often including variations in average productivity, wages, job opportunities, investment and health. It is a useful starting point but not a precise boundary. There are prosperous places in the North and deprived communities in the South; inequality exists within regions and cities as well as between them.
The ONS regional productivity release for 2023, published in June 2025, estimated that output per hour in London was 28.5% above the UK average and output per job was 35.3% above. These are regional productivity comparisons, not household incomes or measures of quality of life. ONS cautions that regional productivity statistics can be revised and remain under development. The figures show a gap in measured output, but they do not explain its causes by themselves.
Regional differences can reflect the distribution of high-value industries, skills, university research, transport access, investment, firm ownership and decision-making. Historical industrial decline can leave a legacy of lower demand and dereliction. London’s role in finance and global business can lift measured output; high output does not mean all London residents are wealthy, nor that every northern area is struggling. Use the scale and indicator specified in a question.
Strategies include transport links, skills and apprenticeships, regeneration, enterprise support, decentralising public institutions, attracting investment and supporting clean-energy or advanced-manufacturing supply chains. The UK Government’s Northern Growth Strategy is a current policy example and should be described as an approach or plan, not assumed to have achieved its aims. Evaluate whether policy creates accessible, lasting work; whether local workers can obtain the skills; whether benefits spread beyond city centres; and whether housing, services and environmental capacity keep pace.
The UK in the wider world
The UK is connected to the wider world through trade in goods and services, foreign investment, migration, culture, travel, transport, research and electronic communication. Imports bring energy, food, components and consumer goods; exports include services and manufactured products. UK firms can own overseas subsidiaries, while overseas firms invest in UK facilities. These flows can create jobs and competition, transfer knowledge and influence the balance of trade.
The EU remains a major geographic and economic partner because of proximity, interconnected supply chains and dense transport links. The UK left the EU in 2020, and the Trade and Cooperation Agreement provides the current framework for much of the relationship. This political change altered some trading procedures and mobility arrangements; firms and sectors experienced different costs and opportunities. Do not describe the UK as an EU member. Commonwealth links reflect shared history and continuing diplomatic, cultural and trade relationships, but the Commonwealth is not a single common market.
Electronic communication allows firms to coordinate production across countries and offer services remotely. Cultural connections include languages, education, sport, music, film and diaspora communities. Transport links move people and cargo by road, rail, sea and air. These connections may strengthen employment and exchange, but also expose workers and businesses to global competition, economic shocks and decisions taken elsewhere. A strong answer identifies the particular link and explains how it affects people and places.
6. Turning development evidence into an evaluative answer
Use an indicator carefully
When given a data set, begin by checking the title, unit, place, year and data source. Calculate a difference or percentage change only if the values are comparable. A rate per 1,000 people is not a total; a national average is not a city value; GDP growth is not the same as GDP per person. If two indicators point in different directions, explain what each measures rather than forcing them into one ranking.
For a comparison, use precise evidence: “In the year shown, place A has a higher value than place B” is clearer than “A is more developed.” Add the amount or pattern, then suggest a mechanism supported by the case. If the figures have different years, say so. If a map suggests a pattern, identify a concentration, gradient, cluster or outlier and use a second source to strengthen the explanation.
Build a balanced judgement
An extended evaluation can follow this sequence:
- State a provisional judgement that answers the question.
- Select evidence from the source or case study, including a date and scale where relevant.
- Explain the mechanism linking that evidence to development or quality of life.
- Consider who benefits and who faces costs, including differences between regions and groups.
- Weigh the counterargument and identify conditions that could change the outcome.
- Reach a reasoned conclusion that makes the judgement more precise than the opening statement.
For example, a manufacturing investment may help reduce a development gap where it provides stable jobs, training and local supplier contracts. Its effect may be smaller where profits leave, jobs are insecure and pollution undermines local livelihoods. The judgement depends on the evidence for local links and on the scale of environmental and social costs.
Link change across scales
Economic change can be traced from household to global scale. A household may gain an income from tourism; a local business may buy food from regional farms; a national government may collect taxes; and an international operator may retain some profits. This chain identifies the multiplier and leakage. Similarly, a UK transport project can affect commute times locally, the labour market regionally and the UK’s international trade nationally.
Scale also changes the meaning of a statistic. GDP is national output; productivity can be compared at regional or subregional scales; household wellbeing is more local and personal. Do not use a national number as proof of what has happened to one community. Explain the scale that is visible and the scale you still need evidence to understand.
How rural change connects to national economic change
Population growth or decline in a rural area reflects both local qualities and national economic restructuring. A coastal county may attract people seeking retirement, recreation or remote work; a village near a successful city may grow because commuters can reach jobs. A remote rural area may lose young adults if higher education, specialist health care and secure work are concentrated in larger towns. These movements can occur together inside the same county.
The effects also feed back into the economy. In a growing area, additional residents expand demand for shops, building, care, schools and transport. Construction may create work, but if housing supply cannot keep pace, prices and rents rise. Seasonal tourism can support hospitality and retail yet produce unstable annual incomes. A declining settlement may lose a shop or bus service when the customer base shrinks; this then makes the area less attractive to new households and firms. Public transport and digital access can interrupt this loop, though they need long-term funding and local fit.
The population figures for Cornwall and parts of Wales are census-based comparisons for 2011–2021. They are useful evidence of contrasting trends, but they cannot alone separate the effects of age structure, births and deaths, internal movement, international migration, housing costs or the pandemic period. For a longer evaluation, pair census change with age profiles, employment data, housing affordability and service access. Explain what the data can support and what additional evidence would be needed.
Weighing UK regional strategies
Regional policy can attempt to change the geography of jobs by investing in transport, skills, innovation, town-centre regeneration and clean-energy industries. The proposed mechanism matters. A rail link can connect workers to employers; an apprenticeship programme can make a local workforce eligible for technical jobs; a university partnership can help firms commercialise research; regeneration can bring derelict land back into use. Each intervention aims to lower a barrier that has constrained a place.
There are possible weaknesses. Transport improvements can mainly benefit commuters travelling out of a town, while local businesses receive little new demand. A training programme may not lead to secure employment if no employer is hiring. A business park may displace economic activity from a neighbouring town rather than adding new activity to the region. Regeneration may raise land values and displace renters or independent businesses. Targets should therefore track who obtains jobs, wages, transport access, firm survival and local spending, not only the amount invested or number of buildings opened.
The distribution of investment over time also matters. Regions with existing universities, skilled labour, supply chains and transport may be better placed to attract further private investment. This creates cumulative advantage: prior growth attracts new firms and high-skilled workers. Policy can counter this by strengthening local capacity before asking an area to compete for investment. There is no single regional strategy that fits every place; rural, coastal, former industrial and metropolitan economies need different combinations of connectivity, services, skills and environmental protection.
Trade connections and changing economic risk
Global trade can widen the range of markets available to firms and the range of products available to consumers. A business can import components and sell a finished product overseas; a service company can work with clients through digital networks. A port, airport, motorway and communications link can make those connections faster. These flows may create jobs in logistics, finance, warehousing, design, production and customer support.
Interdependence can also transmit disruption. If a supplier closes, a shipping route is interrupted, a pandemic reduces travel, or a currency moves sharply, firms may face shortages or higher costs. A place dependent on one large employer can be vulnerable to a corporate decision made elsewhere. The same global connection that provides customers can expose a firm to new competitors and changing standards. Resilience may come from diversified customers and suppliers, adaptable skills, strategic infrastructure and relationships with local businesses.
For Nigeria, oil dependence illustrates exposure to a globally traded commodity; for the UK, supply chains and international services illustrate both opportunity and interdependence. These are not identical patterns. A useful comparison identifies what is traded, the share of local value added, who controls decisions and whether the connection supports diverse employment or dependence on one flow.
Model paragraph: manufacturing and quality of life
“A new manufacturing plant can narrow a development gap if it creates secure local employment and buys from domestic suppliers. Workers gain income and experience; firms that supply packaging, transport or maintenance may also expand. If the company pays taxes and pollution controls are enforced, residents could benefit through improved public services without bearing the full environmental cost. However, an export factory may import most components, employ relatively few people and repatriate profits. The size of its contribution therefore depends on local procurement, wages, tax arrangements, skills transfer and environmental management, not just its output value.”
This paragraph uses a claim, a causal chain, a counterargument and a conditional judgement. Add the country-specific evidence from your taught case study to make it fully applied. The same structure can evaluate tourism, investment, aid or a UK regeneration strategy.
In a final judgement, return to the question’s named criterion. If it asks whether a strategy is effective, specify effective for whom, over what period, and against which outcome. A rise in output may be effective at increasing exports but less effective at reducing regional inequality. A tourism project may create employment but fail to improve household security if jobs are seasonal. This distinction makes the conclusion precise and evidence-led.
Common reasoning errors
- Treating GDP growth as proof that everyone is better off.
- Comparing a poverty estimate and a poverty-rate measure that use different years or thresholds.
- Describing one rural area as representative of all rural places.
- Calling every job created by a TNC a secure, high-paid job.
- Assuming an investment or government strategy has already achieved its announced aims.
- Blaming current development only on physical geography or only on colonial history.
- Describing tourism revenue without considering leakage, seasonality and environmental capacity.
- Calling an industry sustainable only because its product is renewable.
Place example
AQA requires one LIC/NEE country case study and one example of tourism helping reduce the development gap. Nigeria is one possible country, but use your school’s case and current verified facts. For the UK, connect industrial change, transport, rural population change, the north–south divide and global links.
Maps, data and evidence
Compare indicators from the same year and note whether values are averages, rates or composite scores. A sector pie chart and trade map can show change, but neither by itself explains its causes.
Common misconception
Higher income does not automatically mean equal access to health or education. One development strategy rarely removes structural causes on its own.
Self-check
- Why can HDI and income-per-person rankings differ?
- How might a TNC affect a host country?
- Name one cause and one consequence of UK deindustrialisation.
Revision points
Use indicator plus limitation, strategy plus mechanism, and named-case evidence. Separate national change from uneven local outcomes.
Curriculum alignment
- Curriculum coverage IDs:
aqa.3.2.2.changing-economic-world - Related practice packs:
gcse_geo_p2_human_environment_june_2022,gcse_geo_p2_human_environment_june_2023,gcse_geo_p2_human_environment_june_2024,gcse_geo_p2_human_environment_november_2020,gcse_geo_p2_human_environment_november_2021 - Shared concept tags:
development,economic-change,globalisation,inequality,economic-activity,trade,place
Sources
- Curriculum/specification: https://www.aqa.org.uk/subjects/geography/gcse/geography-8035/specification/subject-content/challenges-in-the-human-environment
- Nigeria indicators: World Bank: Nigeria data (indicators have different reference years; shown figures were checked in September 2026).
- Nigeria oil impacts: UNEP: Environmental assessment of Ogoniland; HYPREP: Ogoni clean-up programme.
- The Gambia: World Bank: The Gambia overview; Tourism Diversification and Resilience Project; World Bank: Circular Economy Diagnostic.
- UK productivity: ONS: Regional and subregional labour productivity, 2023. Rural population: ONS: Census 2021, Cornwall; ONS: Census 2021, Wales.
- UK industrial example: Siemens Gamesa: offshore wind blade facility in Hull. UK regional policy: GOV.UK: Northern Growth Strategy—case for change.
- Further reading: World Bank: World Development Indicators.
- For case-study facts, use the source list and figures selected by your teacher; dates, totals and local conditions can change between datasets.