 FoxChild@Learn
11. River landscapes in the UK — school option
Curriculum status: Optional school choice. Choose two of coasts, rivers and glaciated landscapes.
This guide follows AQA GCSE Geography 8035. Named examples below are suggested teaching examples where the specification allows a school choice; use your teacher’s selected case study and verify current figures before an assessment.
Required knowledge
- Explain downstream changes in long and cross profiles and hydraulic action, abrasion, attrition, solution, vertical/lateral erosion, traction, saltation, suspension and deposition.
- Explain interlocking spurs, waterfalls/gorges, meanders/oxbow lakes, floodplains, natural levees and estuaries; explain flood-risk factors and storm hydrographs.
- Evaluate dams/reservoirs, channel straightening, embankments, flood-relief channels, warnings, floodplain zoning, tree planting and river restoration through a named UK scheme.
Key vocabulary
| Term | Meaning |
|---|---|
| discharge | volume of water passing a point per unit time |
| traction/saltation/suspension/solution | transport modes |
| hydrograph | graph linking discharge to time, often with rainfall |
| lag time | delay from rainfall peak to discharge peak |
| levee | raised natural river-bank deposit |
| drainage basin | land drained by a river and its tributaries |
| watershed | higher ground forming a boundary between drainage basins |
| confluence | point where two channels meet |
| discharge | volume of water passing a point per unit of time, often measured in m³/s |
| load | sediment carried by a river |
| hydraulic action | erosion caused by force of water or compressed air in cracks |
| abrasion | erosion when transported material scrapes or strikes the bed or banks |
| attrition | load particles collide, becoming smaller and rounder |
| solution | soluble minerals dissolved in water and carried as ions |
| traction | large particles rolled along the river bed |
| saltation | smaller pebbles bounce along the bed |
| suspension | fine sediment carried within the water |
| capacity | total amount of load a river can transport |
| competence | largest particle size a river can transport |
| thalweg | line of fastest flow in a channel, commonly near its deepest part |
| river cliff | steep outer bank of a meander shaped by erosion |
| slip-off slope | gentler depositional inner bank of a meander |
| floodplain | relatively flat land beside a river that is periodically flooded and built from alluvium |
| storm hydrograph | graph showing how discharge changes over time after rainfall, often with a rainfall trace |
| base flow | groundwater-fed flow that sustains a river between rainfall events |
| peak discharge | highest discharge recorded during a flood event |
| flood storage area | part of a catchment deliberately used to hold water temporarily during high flows |
How the geography works
Vertical erosion dominates many steep upper reaches, where interlocking spurs, waterfalls and gorges may form. Downstream, lateral erosion and deposition shape meanders and oxbow lakes; deposition builds floodplains, natural levees and estuaries. Rivers transport sediment by traction, saltation, suspension and solution. Flood peaks depend on rainfall, geology, relief, soil, land use and basin shape. A storm hydrograph relates rainfall to discharge and shows peak and lag time. Dams, embankments and channels change flows but can shift effects.
A river basin is a connected system
A drainage basin is the area of land drained by a river and its tributaries. Higher land around it forms a watershed, which separates water flowing into different basins. Rainfall enters the basin as an input. Stores include vegetation, soil moisture, groundwater, lakes, reservoirs and water held in channels. Flows include interception, infiltration, percolation, surface runoff, throughflow, groundwater flow and channel flow. Outputs include evaporation, transpiration and discharge from the mouth. The amount and speed of water reaching the channel depend on the balance among these processes.
Smaller channels join larger ones at confluences. A main river is the trunk channel and tributaries add water and sediment from sub-catchments. Basin shape, channel density, geology, relief, soil, vegetation and human land use influence how quickly rainfall reaches the river. The same rainfall total can therefore produce different hydrographs in two catchments.
Catchments also connect people and places. An upstream farm, road or settlement can affect water and sediment reaching downstream communities. A reservoir may store a flood peak but reduce sediment moving farther down the river. A flood wall can protect one neighbourhood while changing water levels or flow elsewhere. Catchment thinking follows water through connected land and channel systems instead of treating a river reach as an isolated line on a map.
How river valleys change downstream
Long profile
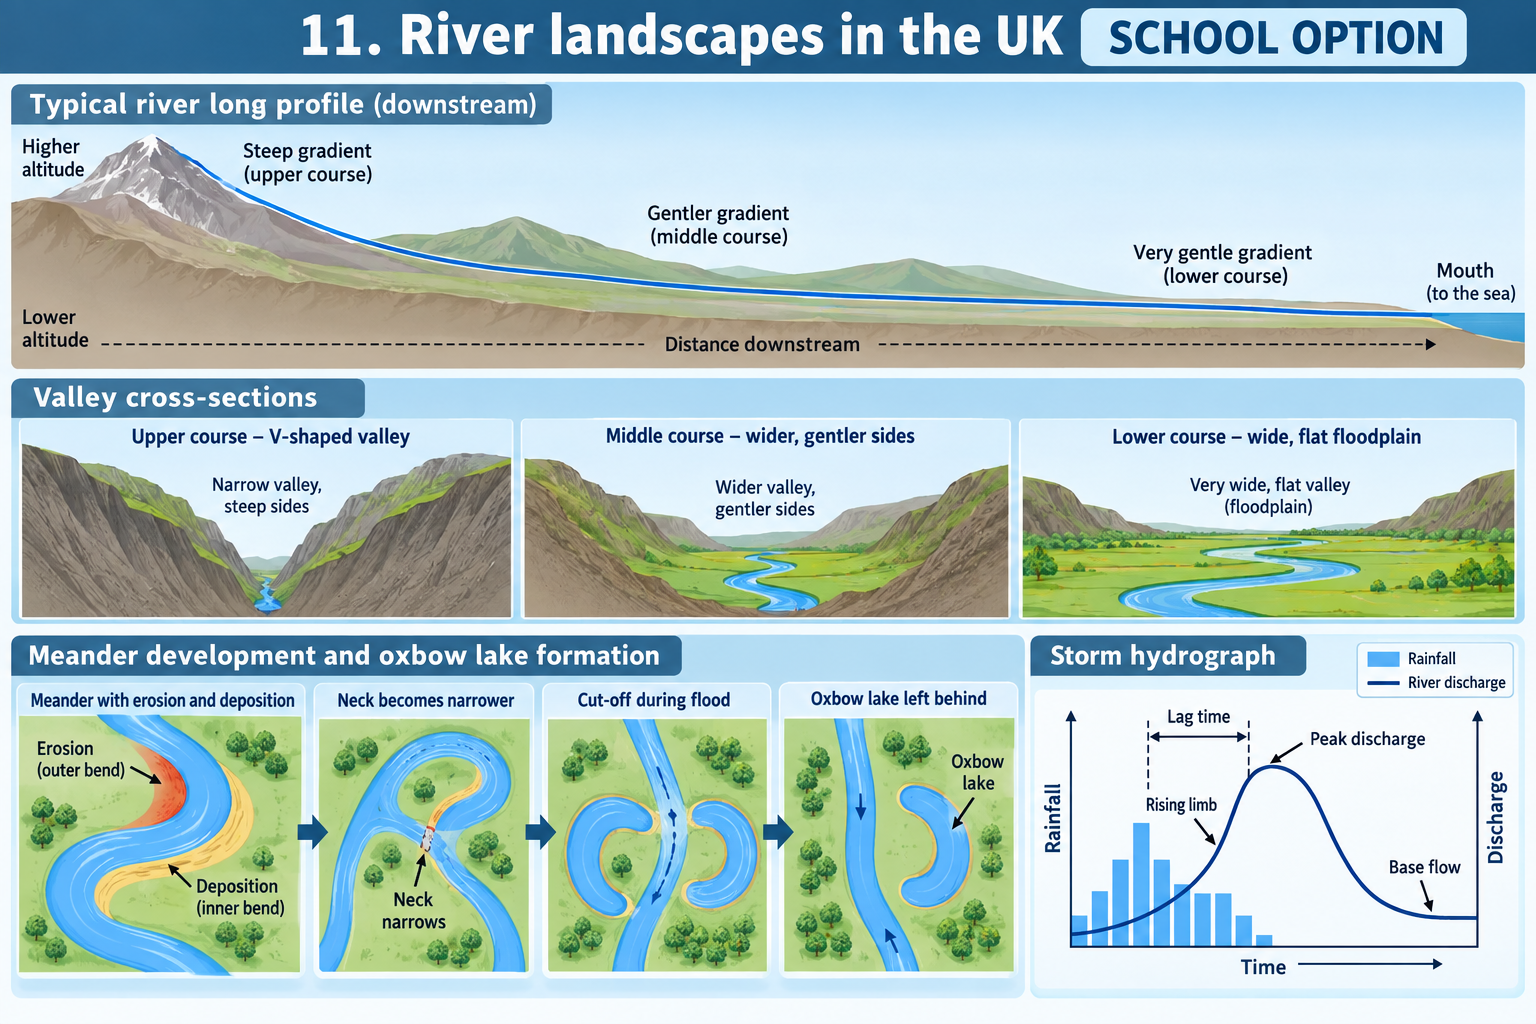
A river’s long profile plots elevation against distance downstream from source to mouth. It is usually steep near the source and becomes gentler downstream, making the overall profile concave. The profile is not a perfectly smooth curve: waterfalls, resistant rock, lakes, dams and changes in base level can create local irregularities.
Near the source, the channel often has a steep gradient, relatively low discharge and a coarse load. Vertical erosion can cut down into the bed, producing a narrow V-shaped valley. Farther downstream, tributaries increase discharge and the valley usually widens. Lateral erosion becomes more important as the channel moves across its valley floor. In lower reaches the gradient is commonly gentler, discharge larger and the valley broader, with a floodplain or estuary. These are broad tendencies; geology and human interventions can create exceptions.
Cross profile of a valley and channel
A valley cross profile is a side-to-side section across the whole valley. An upper-course valley is often narrow and steep-sided, with a small channel on a V-shaped floor. In a middle course, the valley may be wider and have a flatter floor; meanders can migrate laterally. Lower down, a broad flat floodplain may be several times wider than the channel and can include natural levees, abandoned channels or wetlands.
A channel cross profile is measured across the water channel itself. It describes channel width, depth and shape. The channel may be deepest near the thalweg, where flow is fastest, but bends, obstructions and bed roughness alter this. Do not confuse the valley’s cross profile with the channel cross profile. A photograph of a broad valley does not show the river’s width unless the channel is visible and the scale is known.
The downstream pattern reflects changes in discharge, gradient, sediment size, geology, valley shape and channel processes. Increasing discharge means that the river often has greater capacity, but competence depends on velocity and turbulence as well. Coarse bedload may become smaller and rounder downstream through abrasion and attrition, but new material can enter from tributaries or bank erosion. A river does not simply carry the same pebbles from source to sea.
Fluvial processes
Erosion
River erosion removes material from the bed and banks. Hydraulic action occurs when water force or air compressed in cracks loosens material. Abrasion happens as the river’s load scrapes and strikes the bed or bank. Attrition is collision among load particles; it changes the sediment, rather than directly wearing away the bed. Solution occurs when soluble minerals dissolve in water and are carried away in solution.
Vertical erosion deepens a channel and is often important in steep upper reaches, particularly where flow is energetic and the bed is vulnerable. Lateral erosion widens a channel and valley, especially where water attacks banks around bends. Both forms can occur in the same reach, and their relative importance changes with discharge, geology and channel geometry.
Erosion is influenced by river energy, which depends on discharge and velocity, as well as the amount, size and hardness of the load. More load can increase abrasion, but an overloaded river may lose energy as it carries sediment. The bed’s rock type and structure also matter: jointed rock may be eroded more quickly than a resistant, massive bed. Avoid explanations that say “the fastest river always erodes most” without reference to load and geology.
Transportation
Rivers transport load in four main ways:
- Traction: large stones roll or are pushed along the bed during high flow.
- Saltation: smaller stones bounce in short hops along the bed.
- Suspension: fine particles such as silt and clay are carried within the flowing water.
- Solution: dissolved minerals travel in the water as ions and cannot normally be seen as solid particles.
The capacity of a river is the total amount of load it can carry; competence is the largest particle size it can move. Both tend to increase when discharge and velocity rise, but turbulence, channel shape, sediment supply and roughness also matter. During a flood, water may carry a larger or coarser load than in low flow. As flow falls, coarse material may be deposited first while finer material remains suspended.
The Bradshaw Model is a simplified way of representing downstream changes: discharge, channel width, depth and velocity often increase, while gradient and average bedload size tend to decrease. It is a model rather than a fixed law. Tributaries may add coarse material; a dam may trap sediment; a sudden change in geology can alter the trend. Use the model to make a prediction, then use actual data to test it.
Deposition
Deposition happens when a river loses enough energy that it can no longer carry some of its load. Velocity may decrease where a channel becomes wider or shallower, where gradient falls, where discharge drops, when water enters a lake or estuary, or when it flows around the inner side of a meander. Coarser particles are often deposited before finer sediment. Clay and silt can remain suspended until still water or vegetation slows them.
Deposition can occur at many stages, not only at the river mouth. Point bars form on inner meander bends; floodplains receive sediment when a river overtops its banks; natural levees build close to the channel during repeated floods; estuaries can accumulate mud in sheltered tidal areas. When a later flood increases velocity, some of this sediment may be eroded and transported again. A depositional landform is therefore a store within a dynamic system, not necessarily a permanent final destination.
River landforms
Interlocking spurs
In steep upper valleys, a river may wind around ridges of harder rock rather than cut directly through them. These projecting ridges are interlocking spurs. The river erodes vertically into weaker rock and follows the path of least resistance, leaving alternating ridges on opposite sides of the valley. Tributaries, slope processes and later valley widening can modify their shape. “Interlocking” describes the pattern seen from above; the ridges do not literally fit together like puzzle pieces.
Waterfalls and gorges
A waterfall can form where a river crosses bands of rock with contrasting resistance. Softer rock is eroded more quickly than hard rock, leaving a step. Water plunges over the harder ledge and enters a plunge pool. Hydraulic action and abrasion deepen the pool and undercut the softer rock behind or beneath the resistant cap. The unsupported hard rock eventually collapses. Repeated undercutting and collapse cause the waterfall to retreat upstream. A narrow, steep-sided gorge may be left behind.
Jointing and bedding planes provide weaknesses that can influence the waterfall’s position and retreat. A waterfall may also develop where a tributary joins a main valley from a hanging valley, where glacial erosion has over-deepened one valley more than another. Do not assume every waterfall formed by alternating hard and soft rock: the place and evidence determine the process explanation.
Meanders
A meander is a bend in a river channel. Flow is generally faster towards the outer bank of a bend, where the channel is deeper and the thalweg migrates. Hydraulic action and abrasion erode the outer bank, creating a steep river cliff. Flow is slower on the inner bank, where sediment is deposited as a slip-off slope or point bar. Helicoidal flow moves water and sediment in a corkscrew-like path across the channel and helps transfer material from the outer bank towards the inner bank downstream.
As the outer banks retreat and inner banks build out, the bend becomes more pronounced and the neck between adjacent meanders narrows. During a flood, faster flow may cut through the narrow neck. Deposition seals the abandoned loop at both ends, forming an ox-bow lake. Later, the lake may gradually silt up and become a meander scar or wetland. The cutoff does not always happen in a single flood; it depends on bend geometry, discharge and bank material.
In a plan-view diagram, label the river cliff on the outer bend and slip-off slope on the inner bend. Add an arrow for flow direction and distinguish the thalweg from sediment movement. In a sequence diagram, show the neck narrowing, cutoff, deposition sealing the old channel and eventual infilling.
Floodplains and natural levees
A floodplain is a wide, relatively flat area beside a river, built partly by lateral channel migration and repeated overbank deposition. During ordinary flow, sediment is carried within the channel. When discharge rises and the river floods, it spills across the banks. As water spreads onto the floodplain, it loses velocity and deposits alluvium. Coarser material is deposited near the banks; finer silt and clay can travel farther across the floodplain.
Repeated floods may build natural levees—slightly raised ridges alongside the channel. Coarse sediment drops out first as water leaves the channel, while fine sediment settles farther away. Levees can help contain small floods but may be overtopped or breached in larger events. In a cross-section, show the channel, near-bank ridges, flatter floodplain, direction of water spilling out, and finer deposits farther from the banks.
Floodplains are not simply empty land waiting to be built on. They can support fertile agriculture, wetlands, recreation and settlements, but their low relief also exposes people and assets to flood hazard. Floodplain soils, habitat, water storage and sediment deposition are important functions. Building on the floodplain may reduce storage or obstruct flow and increase exposure; planning therefore considers both land use and physical processes.
Estuaries
An estuary is the tidal mouth of a river where river water meets the sea. Tides and river discharge interact; saline and fresh water may mix, and sediment can be carried in and out. In a sheltered estuary, fine mud and silt may settle on intertidal flats. Saltmarsh vegetation traps sediment and stabilises some surfaces. Tidal channels and bars can shift, so an estuary is a dynamic landscape rather than a fixed river mouth.
Estuaries are valuable for ports, settlement, transport, habitats and recreation. They can also be exposed to river floods, high tides and storm surges. Their shape reflects river sediment, marine processes, tidal range, geology, sea-level history and engineering. Some estuaries are strongly depositional; others have energetic channels that transport sediment. Use a map and place evidence rather than assuming all estuaries are muddy and shallow.
Link landform process to evidence in a diagram
An exam diagram should explain a process, not just decorate an answer. Use a sequence of labelled frames when the landform changes over time. Keep flow direction consistent in each frame, add a small key for erosion and deposition, and show which evidence is observed and which feature is inferred.
For a waterfall, a three-frame sequence can show: (1) a river crossing hard cap rock above less resistant rock; (2) a plunge pool deepening and the softer rock being undercut; (3) collapse of an unsupported block and retreat leaving a gorge. Add an upstream retreat arrow. A fourth frame may show jointing or bedding planes that create weaknesses, but it should not imply that the waterfall moves upstream at a constant rate. The landform is the result of repeated erosion and collapse over time.
For a meander, use a plan view and a cross-section. In plan view, mark faster flow and a thalweg near the outer bank, erosion at the river cliff, and deposition at the inner slip-off slope. Show the neck narrowing over time, then a flood cutting through and deposition sealing the old channel. In cross-section, show the deeper outer bank and shallower inner point bar. Use arrows that distinguish water movement from sediment movement. A single bend photo may show the present asymmetry but cannot alone demonstrate that a cutoff will happen soon.
For a floodplain and natural levee, draw the river channel and banks before and during overtopping. The flooded water spreads over the floodplain and slows; coarser sediment settles close to the channel, forming raised levees after repeated events, while finer material reaches farther out. A labelled floodplain cross-section can also show houses or farmland as land use, but avoid suggesting that every floodplain is at the same elevation or has identical soils.
For all landform diagrams, use captions that contain the causal link: “Flow is faster on the outer bend, so lateral erosion undercuts the bank”; “water loses energy as it leaves the channel, so it deposits alluvium”; “the hard cap rock collapses after the softer rock below is undercut.” The word because helps expose a missing mechanism. Do not label a feature as proof of a process if the image cannot show that process; describe it as evidence consistent with an explanation.
Distinguish a process from the shape it creates
Students often mix up process names and landform names. Hydraulic action, abrasion and solution are processes. A waterfall, gorge, meander, ox-bow lake and floodplain are landforms. A river cliff and slip-off slope are parts of a meander. A levee is a ridge alongside a river, and an estuary is a tidal river mouth. A clear answer gives both the process and the resulting form.
Erosion is not a single uniform force. On a resistant bed, hydraulic action may exploit joints while abrasion uses the river’s load. On a bank, lateral erosion may be concentrated at a bend. Attrition changes the sediment particles through collisions; it should not be offered as the direct explanation for a gorge unless the role of load collisions against the bed is also explained. Solution carries dissolved minerals and may be important where soluble rocks are present, but is not automatically dominant in every UK river.
Transportation and deposition also need distinct explanations. A pebble rolling along a bed is traction; the same pebble bouncing is saltation. A fine particle carried within the water is suspension, while dissolved ions are solution. Deposition is the settling of load when the river loses the energy needed to transport it. The particle size that settles depends on current velocity, turbulence, shape and density; a simple “large things drop first” rule is an approximation that should be used with context.
When a question asks how a landform is formed, organise the response in chronological order: identify the starting conditions, name the active process, explain how the process changes the landscape, and show the final feature. For a waterfall, name the contrasting rock bands before undercutting and collapse. For an ox-bow lake, describe bend growth and narrowing before cutoff and deposition. This sequence is more convincing than listing processes without showing how one leads to another.
Place example
River valley example: the River Tees
The River Tees rises on the eastern slopes of Cross Fell in the North Pennines and flows eastwards to the North Sea near Teesside. The North Pennines National Landscape describes the Tees as one of the major rivers born in its uplands. A catchment map can be used to trace its source, tributaries, upper valley around High Force, lower course and estuary; precise channel length depends on how the source and mouth are defined, so it is not needed for this landform overview.
In its upland course, the Tees flows over a steep gradient through moorland and a narrow valley. At High Force, the river drops about 21 m over the resistant Whin Sill, an intrusion of dolerite. Softer sedimentary rocks lie below it. The river erodes material below the hard sill, undercutting the softer rock; blocks of the overlying hard rock eventually break away. Repetition causes the waterfall to retreat and leaves a steep-sided gorge. North Pennines geologists describe the Whin Sill as molten rock that solidified underground around 295 million years ago and was later exposed by erosion (North Pennines, High Force geosite).
Downstream, additional tributaries increase discharge and the valley becomes wider. Meanders and wider valley floors can develop as lateral erosion and deposition become more significant. Farther east the river flows through lower and more densely settled areas, then enters the tidal Tees estuary and North Sea. The exact location of each landform should be confirmed on a map, photograph or field evidence; not every textbook feature occurs in a neat sequence or in every valley.
The Tees illustrates how geology, relief, discharge and load create different landforms along one river. High Force is not simply “caused by a steep gradient”: the contrast between the resistant Whin Sill and weaker rocks is central to its formation. The North Pennines’ source and catchment data can also support map and flow interpretation; the UK National River Flow Archive explains that catchments vary in topography, geology, rainfall and land use (NRFA catchment information).
For a revision map, label Cross Fell, Cow Green Reservoir, Cauldron Snout, High Force, Barnard Castle, Darlington, Yarm, Teesmouth and the North Sea. Use a north arrow and broad-course shading rather than fabricating measured gradient. Add tributaries only from a reliable map. A profile from source to mouth can be schematic unless you have elevation data; mark it “not to scale.”
Flood-management example: Banbury and the River Cherwell
Banbury is in Oxfordshire beside the River Cherwell. The town has a long flood history: in 1998 floodwater affected 125 homes and 35 commercial premises, roads and the railway station; substantial earlier events were recorded in 1932 and 1947. The 2007 floods again affected commercial properties. These figures are from the Environment Agency’s environmental statement and describe historical events, not the present number of properties at risk (Environment Agency, Banbury scheme environmental statement).
The Cherwell catchment around Banbury includes largely impermeable clays, which can produce a relatively rapid response to rainfall. The town also contains low-lying floodplain and transport, residential and industrial assets. The 1998 flood disrupted roads and the railway as well as buildings. A scheme was needed to reduce fluvial flood risk while maintaining the river, canal, farmland, habitats and public access.
The Banbury Flood Alleviation Scheme, completed in 2012, combines flood storage upstream with local defences in the town. The upstream works use an earth embankment to increase the storage capacity of the existing floodplain; when river flow is high, water is temporarily stored and released more slowly. Sections of the River Cherwell were realigned, an 850 m section of the A361 was raised, and local flood walls and embankments protect industrial areas including Wildmere and Tramway. A pumping station at Moorfield Brook forms part of the wider local protection. Cherwell District Council records the northern Banbury scheme as completed in 2012 (Cherwell District Council, Banbury area strategy); the Environment Agency design documents explain the combination of storage and local works.
The upstream storage area deliberately uses floodplain land to hold water in larger events. That can reduce the flood peak reaching the town, but it means parts of the storage area may flood more often or for longer. Historical environmental assessment considered effects on agricultural land, landowners, public rights of way, habitats and the Cropredy Bridge historic battlefield. The scheme therefore shows how flood-risk reduction can create costs outside the protected town. A 1-in-200-year design standard is a probability model, not a guarantee against every larger event or a promise that no property can flood.
Benefits include reducing the likelihood and impact of flooding in homes and businesses, protecting transport and supporting confidence in the town. The flood-storage landscape can also provide public access and habitat, though exact outcomes depend on design and maintenance. Costs include construction and maintenance, land purchase or rights to flood, temporary traffic disruption, potential effects on farmland and habitats, and residual flood risk if a design threshold is exceeded. The scheme does not eliminate surface-water, canal, groundwater or extreme fluvial flood risk; the Environment Agency continues to issue a specific flood-warning area for properties protected by the scheme (GOV.UK, River Cherwell at Banbury warning area).
To evaluate the example, ask whether benefits to Banbury outweigh the costs on the upstream floodplain; how reliable the scheme is at different event sizes; what happens to water after it is stored; and whether warning, zoning and household preparation remain necessary. A strong judgement is conditional: storage and local walls reduce risk, but landowners, farmers and transport users also experience impacts, and the remaining risk must be communicated and managed.
Build a balanced Banbury case-study answer
The case is strongest when the scheme is explained as a connected set of works. Upstream flood storage temporarily holds water on land that can safely flood, reducing or delaying some of the flow reaching the town. Raised embankments and walls provide a more direct line of defence around assets. The River Cherwell realignment and road-raising work adapt specific places and infrastructure. It would be inaccurate to say that one barrier “stops Banbury flooding”: each element manages a different pathway or consequence, and the system has a design capacity.
For a why was it required? question, select evidence that establishes both hazard and exposure. The 1998 event affected 125 homes and 35 commercial premises, while the river’s low-lying floodplain and the town’s road, railway, homes and businesses create consequences when water leaves the channel. The catchment’s geology and rainfall contribute to response, but do not claim a precise hydrograph shape without supplying the evidence. A named event and named assets make a more convincing account than the general statement that “rivers flood after heavy rain.”
For a how does the scheme work? answer, trace the water pathway: rainfall reaches slopes and tributaries; river discharge rises; the upstream storage area temporarily holds some floodwater; the peak moving towards Banbury may be reduced or delayed; local walls and embankments help keep water away from selected built-up areas. Mention that residual flow remains in the river and that extreme events can exceed a structure’s design. Use the term flood alleviation or risk reduction, not “flood prevention.”
For an issues and conflicts answer, identify who experiences each effect. Residents and businesses within the defended town may gain protection and reduced disruption. Farmers and landowners in an upstream storage area may experience temporary inundation, restrictions, or changed access. Construction can disrupt roads and paths and affect habitats; a raised road may improve its resilience but requires land and works. Wetland or floodplain benefits can occur, but should be supported by a source or clearly framed as a potential benefit rather than an automatic outcome. Public access and heritage also need consideration in site design.
The case study does not show whether every local property has the same risk. A mapped warning area may include properties with a reduced but continuing risk, and flood warnings do not mean that each listed property will flood every time. Risk maps, warning thresholds and official statements have different purposes. Always date the material and describe precisely whether a figure refers to homes affected in a historical event, properties expected to benefit, or properties inside a present warning zone. These categories should not be added together.
A useful case-study evidence card
| Evidence item | What it supports | What it does not prove by itself |
|---|---|---|
| 1998 event: 125 homes and 35 commercial premises affected | The scale of a historical flood impact in Banbury | The present-day risk to each property or the probability of a repeat event |
| Banbury scheme completed in 2012 | A dated point in the scheme’s history | That flood risk was eliminated after completion |
| Upstream flood storage plus local defences | A portfolio of storage and protection measures | That storage is available at full capacity before every storm |
| 850 m of A361 raised | A specific transport adaptation | That all nearby roads or services are protected |
| Current Environment Agency warning area | Flood alerts and response information remain relevant | A prediction that all properties in the area will flood |
If an examination question provides newer local data, use that evidence rather than relying on this historic snapshot. For a current essay, verify updated scheme details and the Environment Agency’s live warning information. Use case-study knowledge to explain mechanisms and trade-offs, then make a judgement that recognises both reduced probability or consequence and remaining uncertainty.
Flood risk and storm hydrographs
A flood is a process; risk depends on exposure
A river flood occurs when discharge rises until water exceeds channel capacity and spills onto nearby land. Flooding is a natural part of many river systems and can deposit nutrient-rich alluvium, recharge wetlands and maintain habitats. It becomes a hazard when it may harm people, property, infrastructure, livelihoods or ecosystems. The consequences depend on exposure (what lies in the flood area), vulnerability (how susceptible people and assets are) and capacity to prepare and recover.
Physical factors affecting flood risk
Precipitation: intense rainfall can exceed the rate at which water infiltrates into soil. Long-duration rain can saturate a catchment, leaving less capacity to store additional water. The same storm over a dry basin may create a smaller response than over saturated ground. Snowmelt or rain falling on snow can add water quickly in some climates.
Geology and soil: permeable rock such as chalk can allow infiltration and groundwater recharge, often delaying surface runoff. Impermeable rock and clay restrict infiltration and can increase overland flow. Soil depth, compaction and antecedent moisture also matter. A permeable geology does not prevent every flood: intense rainfall may still exceed infiltration, groundwater may rise, and rivers may receive water from other parts of the basin.
Relief: steep slopes can route water to channels quickly, shortening the time available for infiltration and storage. Gentle slopes and lowlands may slow flow or provide floodplain storage, although they can also contain settlements exposed to inundation. Relief effects interact with vegetation and soil, so “steep means flood” is too simple.
Basin shape and drainage density: a compact basin can deliver water from many tributaries to the main channel at similar times, producing a sharper peak than a long narrow basin in some conditions. A dense network of streams can transfer runoff rapidly. Channel length, gradient and storage change the result.
Human factors affecting flood risk
Urbanisation replaces soil and vegetation with roofs, roads and car parks. Impermeable surfaces reduce infiltration; drains and culverts can move runoff quickly into a channel. If development occupies floodplain storage, water has less room to spread safely. Urban design can reduce the effect with permeable paving, rain gardens, green roofs, ponds and sustainable drainage systems, but maintenance and network capacity matter.
Agriculture changes infiltration and runoff. Compacted soil, ploughing direction, field drains, removal of hedges and loss of wetland storage can increase or accelerate flow in some settings. Practices vary, and a farm is not automatically a flood cause. Soil management, cover crops, buffer strips, hedgerows and wetland restoration may reduce runoff or slow movement where suited to the catchment.
Deforestation can reduce interception and alter infiltration or soil structure. Tree planting may slow water, increase interception and help stabilise soil, but the effect on a large flood depends on where, how much and what kind of woodland is planted, as well as storm scale and soil saturation. Trees are one part of catchment management, not a stand-alone guarantee.
River engineering can change how quickly water moves. Straightening or deepening a channel may increase local conveyance and reduce flood risk at one reach, but can send water downstream sooner or increase erosion. Embankments separate water from parts of the floodplain; dams store some flow but change the timing of release and sediment. Buildings on a floodplain increase exposure even if they do not alter the hydrograph.
Read a storm hydrograph
A storm hydrograph shows discharge over time after rainfall. The horizontal axis is time; the vertical axis is discharge, normally in cubic metres per second (m³/s). A rainfall trace may be shown as bars on a separate inverted axis or on the same chart using a second scale. Always read the labels and units before comparing curves.
- Base flow is the ordinary river flow, often sustained by groundwater and delayed stores.
- Rising limb shows discharge increasing as rainwater reaches the channel.
- Peak discharge is the highest flow recorded for the event.
- Lag time is the delay between the peak rainfall and peak discharge. Use the time between the peaks shown, not the start of rainfall.
- Falling or recession limb shows discharge returning towards base flow as storm runoff declines and stores drain.
A short lag time and high peak discharge suggest a rapid basin response. Steep relief, a compact basin, intense rainfall, wet soils, impermeable geology, sparse vegetation, urban surfaces and efficient drains can contribute. A longer lag time and lower peak may be associated with permeable geology, deeper dry soils, vegetation, a larger storage capacity, gentler slopes or an elongated basin. These are explanations to test against evidence, not a formula: catchments combine factors and storms differ.
Rainfall and discharge do not peak at the same time. Water must travel across slopes, through soil or groundwater, and along channels. A hydrograph for one storm cannot establish the catchment’s response to every event. Compare rainfall totals and intensity, antecedent conditions, event duration, time scale and gauge location. If the discharge axis starts above zero or uses a different scale, interpret its shape carefully.
Flood management strategies
No single strategy makes a river completely safe. Hard engineering changes channels or creates structures; soft approaches change land use, store water, improve preparedness or restore natural processes. Many real schemes combine them. Compare not only whether a defence reduces flood depth at one property, but also what happens upstream and downstream, who pays, what happens to habitat and whether the community can respond to residual risk.
Hard engineering
Dams and reservoirs hold back water and release it in a controlled way. A reservoir can reduce downstream peak discharge if it has available storage before a storm. It may also supply water and generate recreation or electricity. Construction is expensive and can displace communities or habitats; storage capacity is finite, sediment can accumulate, and the dam needs inspection. If the reservoir is already full or an event exceeds its design, protection is reduced. Changes to sediment and flow timing affect ecosystems downstream.
Channel straightening cuts off bends, often shortening the river path and increasing flow speed. It can move water away from a local problem area and reduce flood duration there. Faster flow may increase erosion and transfer the flood peak downstream; the river may also re-meander over time. It can damage habitats and reduce the floodplain’s natural storage.
Embankments or levees raise the banks to contain a larger discharge. They protect land immediately behind the defence while the design capacity is not exceeded. They require land and maintenance and can fail or be overtopped. By constraining the channel, they may raise water levels or transfer floodwater to downstream reaches. If a defence fails, water can enter rapidly; residual risk should be planned for.
Flood-relief channels divert some flow around a settlement or vulnerable reach. They can reduce discharge in the main channel and protect a built-up area. They need suitable land, careful design and management at inlet and outlet; the new channel may flood or affect habitats and land use. Flow and risk can shift to the point where water rejoins the river.
Soft engineering
Warnings and preparation use rainfall, river gauges, forecasts, sirens, texts and evacuation plans to give people time to move vehicles, protect belongings or leave. They are relatively cost-effective and can reduce injury and damage without changing the river. Forecasts have uncertainty; warnings do not prevent floodwater, and some people may lack phones, transport, language access or a safe destination. Clear messages, trusted communication and practice improve effectiveness.
Floodplain zoning guides development away from areas with high probability or high consequences of flooding. Keeping some land open preserves storage and reduces exposure. It may limit development options or property values and depends on planning decisions being followed. Existing towns cannot always be moved, and flood boundaries change with climate, channel conditions and defences. Zoning reduces future risk but does not eliminate present exposure.
Tree planting and catchment management can increase interception, improve soil structure and slow surface runoff. Planting across slopes, restoring hedges and protecting wetlands may help store water and reduce erosion. Effects depend on location, soil, species, scale and rainfall; small tree plots do not necessarily stop a large flood. Landowners need incentives, space and long-term management.
River restoration may reconnect the channel with its floodplain, re-meander a straightened reach, remove barriers, restore wetlands or create space for water. It can improve habitats and reduce flow speed or peak downstream by storing water. It may require agricultural land and can create local flooding or access conflicts; the location must be chosen so that storage protects places at risk without transferring unacceptable impacts.
Compare strategies as a catchment portfolio
A portfolio can combine upstream storage, woodland and soil measures with floodplain zoning, warnings and targeted walls or embankments around dense settlements. The point is not that “soft” is always better than “hard.” A town centre with critical infrastructure may need a designed structural defence, while upstream land may be more suitable for temporary storage. The portfolio should be assessed for the whole basin and for multiple events.
| Strategy | Main mechanism | Potential benefit | Important limitation or trade-off |
|---|---|---|---|
| Dam/reservoir | Temporarily stores water | Can lower or delay a downstream peak | Capacity, cost, habitat and sediment changes |
| Straightening | Increases local channel conveyance | Moves water past a protected reach | Can accelerate flow and increase downstream risk |
| Embankment | Raises channel capacity at a reach | Protects property behind it | Overtopping, breach and transferred risk |
| Relief channel | Diverts flow around a settlement | Reduces flow in the original channel | Land take and risk where flow rejoins |
| Warnings | Increases preparation time | Reduces harm and improves evacuation | Does not stop the flood; unequal access to alerts |
| Zoning | Limits new exposure | Preserves storage and avoids future risk | Constrains development; existing risk remains |
| Trees/restoration | Slows runoff and stores water | Adds habitat and multiple catchment benefits | Scale and storm limits; land-use trade-offs |
Worked storm-hydrograph comparison
Imagine a question gives two hydrographs after the same six-hour storm. Catchment A reaches a peak discharge of 72 m³/s five hours after peak rainfall; Catchment B peaks at 38 m³/s after eleven hours. These are teaching values, not measurements from Banbury. A sound first comparison is that A has the higher peak and shorter lag time, so its channel receives storm water more rapidly. B has the lower peak and longer lag, indicating a slower response during this event.
Next explain a possible pattern with evidence about the basins. If Catchment A is smaller, urbanised, steep and underlain by relatively impermeable material, runoff may enter the channel quickly. If B is larger, more elongated, vegetated and has permeable soils and substantial storage, its response may be slower. The provided data do not prove every one of those characteristics: select only the factors shown in the question, or mark additional factors as plausible explanations. Do not invent geology, land use or rainfall to fill gaps.
Then consider the event. If the rainfall over A was more intense, its response may partly reflect rainfall rather than the catchment alone. If the rain gauge is far from the discharge gauge, local storm patterns may not match. If the curves are based on different time intervals, a short peak may be missed or smoothed. A high discharge does not automatically mean flood damage: channel capacity, flood defences, floodplain elevation and exposure also matter. The hydrograph describes flow at a gauge during an event; it does not directly count people or buildings affected.
A short answer may ask for lag time. Locate the rainfall peak and discharge peak, read each time from the horizontal axis, and subtract the earlier from the later. If peak rainfall is at 14:00 and peak discharge at 20:00, lag time is six hours. If a graph uses hours since rainfall began, use its labelled values rather than assuming a clock time. If rainfall is shown as bars on an inverted axis, read that axis separately from discharge.
A longer answer can follow this structure:
- State the peak discharge and lag time for each curve using the units.
- Compare the size and timing of the responses.
- Use the basin and rainfall evidence provided to explain the contrast.
- Add a limitation or alternative explanation, such as antecedent saturation, storm intensity or gauge position.
- Link the flow response to potential flood risk only if channel capacity and exposed land are known.
This sequence prevents a common error: describing a steep rising limb as proof that the basin is urban. A steep limb shows rapid increase in discharge. Urban surfaces are one possible cause, but the causal explanation requires land-use evidence and consideration of rainfall, geology, relief and storage.
Choose a management portfolio for the place
Flood strategy depends on the question being managed. An upstream reservoir might lower a downstream peak, but only if storage is available and release is controlled. A wall may defend a dense settlement, but its benefit is specific to the reach and it can create residual risk. A warning does not change the water; it changes people’s opportunity to prepare. Zoning influences where future exposure grows. These strategies solve different parts of a risk problem and are often combined.
Consider a small upland village where a narrow bridge constricts a channel. A relief channel or redesigned bridge could increase conveyance, but it may require land and must avoid shifting risk to the next settlement. A warning system could give residents time to move vehicles. Floodplain zoning is more relevant to new development than to houses already built. Tree planting and leaky barriers upstream may slow ordinary runoff but cannot be assumed to manage every intense storm. A suitable answer first identifies the local mechanism and assets, then compares feasible options.
For a rapidly growing town on a broad lowland floodplain, floodplain zoning and protection of open storage land can limit future exposure. A town-centre wall or embankment may defend existing homes, shops or infrastructure that cannot easily be moved. If overtopping would have serious consequences, evacuation routes, warnings and property resilience remain important. The choice has distributional effects: landowners behind a defence gain differently from farmers asked to store water upstream. A fair evaluation asks who receives protection and who carries cost or changed land use.
In a catchment with frequent, smaller floods and important wetland habitat, river restoration, floodplain reconnection and natural flood management may support flow attenuation and habitat together. However, evidence reviews describe effects as dependent on catchment scale, location, floodplain type and the length of river restored; benefits may be hard to predict and full reconnection can take time. A large flood may exceed local storage capacity. It is stronger to say “this measure may reduce or delay some peaks at this site, as part of a wider portfolio” than to claim that wetlands prevent all floods.
For a transport corridor or industrial site where interruption carries a high cost, targeted defences can be justified even where catchment-wide natural measures also operate. The design should include maintenance, a route for excess water, safe access, warnings and a plan for events that exceed the threshold. A relief channel might protect a settlement but require a downstream outlet capable of carrying the diverted flow. The word transfer should be used carefully: identify where the flow is moved and cite evidence; a downstream impact is possible but not automatic in every design.
A useful decision matrix compares probability reduction, consequences, cost, maintenance, ecosystem effects, land take, timescale, fairness and residual risk. Weight the criteria to match the community’s stated priorities. If the objective is to protect a hospital, continuity of emergency access may carry more weight than recreational benefit. If a rural catchment has space, distributed storage may be more feasible. There is rarely one universally best strategy; a reasoned answer identifies a preferred combination and explains what monitoring would show whether it works.
Maps, data and evidence
On a storm hydrograph, identify rising limb, peak discharge and lag time; compare with rainfall timing. Read contour maps to locate valleys and floodplains. Use consistent units and distinguish discharge from water level.
Turn observations into evidence
River geography uses both measurements and descriptions. A field photograph can show a steep outer bank or a broad valley, but it does not by itself prove the erosion rate, flood probability or channel discharge. Explain what is directly visible, identify the process it may indicate, and say what extra evidence would test that interpretation. A measured cross-section, discharge record, sediment sample, field sketch, aerial photograph or repeated survey may answer a different part of the question.
To estimate channel discharge, use the relationship:
Discharge = cross-sectional area × mean velocity
In symbols, Q = A × v. If a channel has an average wetted cross-sectional area of 6 m² and a measured average velocity of 0.8 m/s, the estimated discharge is 4.8 m³/s. This is an example calculation, not a Tees or Cherwell measurement. The result is an estimate because river depth and velocity vary across the channel and through time. The measurement should be repeated at different verticals across the channel, with care not to disturb the bed or put a fieldworker in unsafe flow.
The float method can estimate surface velocity: mark a measured reach, time a float over it several times, and calculate distance divided by time. A float moves at the surface and may be slowed by wind, caught in an eddy, or travel faster than water close to the bed. It therefore does not equal mean velocity. A simple correction factor can be introduced by a teacher, but a student should state the method and its limitation rather than report false precision. A flow meter measures point velocity more directly; sampling at several depths and across the channel gives a better estimate of the mean.
For cross-sectional area, measure channel width and depths at regular intervals. A trapezium rule or a series of rectangles and triangles can approximate the area. Record bankfull indicators separately from the water level on the day: the channel may be far below bankfull during fieldwork. Use the same width points, spacing, equipment and method at every site to make comparisons fair. If one reach is measured during a storm and another during dry weather, the difference may reflect timing rather than location.
Sediment observations also need a consistent method. A student might measure the long axis of a fixed number of randomly selected clasts, record shape with a standard roundness chart, or compare size classes along a transect. Choosing only the most visible pebbles biases the sample. A pebble count from one bar cannot prove that every downstream reach has finer sediment. Repeating observations and noting whether material came from a bar, bank or channel bed makes the evidence more useful.
Read the river through map evidence
Contour lines show land height and allow a broad judgement about valley gradient. Closely spaced contours indicate a steep slope; wide spacing suggests gentler land. Where contours form a V shape across a valley, the point of the V commonly points upstream. A river map can show source, tributaries, confluences, meanders, settlements, reservoirs and transport links. A map is a model at a particular scale and date; small channels or recent engineering may not be shown.
Use a map key and scale bar rather than estimating distance from the page. A six-figure grid reference helps locate a feature within a square; state the eastings first and northings second. If the question asks you to compare two sites, quote the named location and evidence for each one. “Site A is steeper” is weaker than “the contours are closer together near Site A than around Site B, suggesting a steeper valley-side gradient.” A photograph can add landform detail; the map establishes where the view was taken and its position in the drainage basin.
A long profile can be made by plotting distance from source on the horizontal axis and river-bed or water-surface elevation on the vertical axis. Choose a sensible scale, mark the source and mouth, plot measured points accurately, and connect them with a smooth curve only if the data justify it. A gradient can be compared using change in height ÷ horizontal distance. If the rise is 120 m over 3 km, the mean gradient is 40 m/km. Do not confuse this average with the gradient at every point, and do not compare numbers unless both profiles use compatible units and measurement conventions.
The Bradshaw Model predicts broad downstream trends, but a model must be checked rather than copied. A tributary can create a sudden rise in discharge; a reservoir can reduce or regulate it; resistant rock can affect channel gradient; a city can channelise a reach. Anomalies are useful evidence about local conditions. In an exam, state the general trend first, quote the supplied data, and then explain any exception without claiming that a simple model explains every place.
Reliability, uncertainty and fair comparisons
River flow changes hourly and seasonally. A single fieldwork visit gives a snapshot, and a measurement close to a storm may not represent normal flow. Discharge gauges provide continuous records at selected sites, but gauges are not everywhere and a river level needs a rating curve to convert stage height to discharge. Rating curves can be less reliable during extreme floods, when the channel or floodplain flow changes. A graph should identify the gauging site, period and units before you describe a trend.
When comparing upper-, middle- and lower-course sites, keep the method constant and record possible confounding factors: recent rainfall, shade, channel obstruction, bank material, flow depth, local engineering and tributary inputs. Use a mean from several measurements and display the spread, not only one convenient value. A difference may be real even when values overlap, but repeated observations make the argument stronger. Do not claim that discharge alone caused a landform; link the evidence to gradient, geology, sediment, channel geometry and time.
In an investigation, a useful hypothesis is testable. “The river gets bigger” is vague. “Mean channel width and depth will be greater at the lower-course site than at the upper-course site” specifies variables and direction. A second hypothesis might predict that average bedload size declines downstream. A null hypothesis states that there will be no measurable difference. The method should define how a site is selected, how many measurements are made, and how the data will be represented. These practical choices help separate a geographical pattern from an unreliable measurement.
Tees evidence synthesis
The Tees gives a useful physical landscape narrative because its upper valley exposes process and geology together. A map locates Cross Fell as an upland source area and shows the river travelling east towards Teesside. At High Force, the waterfall’s approximately 21 m drop and the Whin Sill provide place evidence for a resistant cap rock over weaker strata. The explanation then uses hydraulic action, abrasion, plunge-pool erosion, undercutting and collapse. It is not enough to memorise “Tees equals waterfall”; explain why this particular rock arrangement creates a step and how repeated retreat creates a gorge.
Further downstream, tributaries add water and sediment and the valley generally widens. This supports an explanation of increasing discharge and more lateral channel activity, but the exact location of each bend or floodplain feature should come from the map or field photograph used in class. A case study is not a guarantee that every textbook landform occurs at a named coordinate. If the assessment provides a map, use its scale, contour interval and symbols. If it provides a photograph, identify visible evidence and qualify any process that cannot be observed directly.
The North Pennines setting also illustrates that rivers are ecological and human systems as well as channels. Upland watercourses, wetlands and surrounding land support habitats and catchment functions. Reservoirs or engineered channels can change flow timing and sediment movement; recreation and visitor access can affect land use around a waterfall. These are useful connections when a question asks how a physical landscape is used or managed, but they should not displace the AQA river processes and landforms required in a formation answer. Separate the core explanation from wider context so each paragraph earns relevance.
For an evidence card, record: the feature (High Force); the observation (a high waterfall crossing the Whin Sill); the process explanation (differential erosion, undercutting and collapse); the broader pattern (retreat and gorge development); and the source (North Pennines geosite information). Keep a date or retrieval note for facts that might be revised. If quoting the age of a geological intrusion, make clear it is approximate geological time, not the age of the present waterfall.
Banbury decision and monitoring exercise
Imagine a council is reviewing a scheme after a sequence of wet winters. It must decide whether to invest in maintaining walls, improving upstream storage, restoring an additional floodplain area, or expanding public warning and preparedness. A defensible plan begins by checking which mechanisms caused the latest disruption: river discharge, surface runoff, groundwater, blocked drains or a combination. A report of water in a street does not by itself identify the source. River gauges, rainfall records, incident locations, flood marks and residents’ observations can be combined, with their dates and reliability recorded.
The decision also needs performance evidence. Compare observed river levels and inundation with the scheme’s design assumptions, inspect assets, check whether the storage area was available, and record any near-miss or maintenance problem. If no property flooded during one event, that does not prove the scheme caused the outcome: the event may have been smaller or followed a different route. If flooding occurred, it does not automatically prove that the whole scheme failed; the flow might have exceeded a threshold or come from another source. Evaluation compares what happened with a clear counterfactual or expected outcome.
Monitoring should include people and place. Count disruption to roads, homes and business access; record any temporary storage impacts on farmland; survey habitat and sediment changes; and ask whether warnings reached people who need them. A technically successful reduction in peak flow may still leave an unfair distribution of costs. Conversely, a storage area that floods as designed may be performing its intended function, provided agreements, compensation and access arrangements are understood by land managers.
This exercise illustrates why flood management is adaptive. Rainfall patterns, development, channel conditions and asset condition change over time. Authorities can use post-event reviews to improve warnings, maintenance and land-use planning. The evidence for a decision should distinguish the scheme’s measured effect from other changes in the catchment and should make uncertainty explicit. No strategy should be judged solely by a single flood-free year or a single dramatic event.
When using a return-period figure, interpret it as a probability in any given year, not a timetable. A “1 in 100 year” event has about a 1 per cent annual probability under the statistical assumptions used; it does not mean that it occurs only once each century. Two such events can happen in consecutive years, and climate or catchment change can alter the underlying probability. A scheme designed for a stated standard reduces risk up to its design assumptions; it does not promise that water will never exceed the defence. This distinction is important when weighing the Banbury example and explaining why warning and preparedness remain necessary.
Keep hazard, exposure and vulnerability separate in a flood answer. Heavy rainfall and high discharge describe the physical event; a settlement on a floodplain describes exposure; poorly insulated housing, limited mobility or no access to warnings can increase vulnerability. A flood-management strategy may lower the probability of water reaching a place, reduce the number of exposed assets, or help people cope with the consequences. Naming which part of risk it changes makes a comparison more precise.
Common misconception
Flooding is not caused by rainfall alone. Embankments may protect one reach but increase or accelerate downstream flows.
Self-check
- How do a river’s long profile and valley cross-profile usually change downstream? Give one reason the general pattern may not be smooth.
- Distinguish hydraulic action, abrasion, attrition and solution. Which process changes the load particles through collisions?
- What is the difference between competence and capacity?
- Explain how interlocking spurs develop. Why might the river not cut straight through a ridge?
- Describe a waterfall-to-gorge sequence. Include the role of rock resistance and collapse.
- Where are erosion and deposition concentrated around a meander? Name the landforms on each bank.
- How can an ox-bow lake form, and what may happen to it later?
- Explain why a floodplain may receive finer sediment farther from the channel than close to a natural levee.
- What is an estuary, and why can its sediment and water conditions change through a tidal cycle?
- Name two physical and two human factors that may affect flood risk. For each, explain the route by which it changes runoff or exposure.
- A hydrograph has peak rainfall at 09:00 and peak discharge at 15:00. Calculate lag time and explain what it means.
- Name one possible advantage and one limitation of an upstream reservoir, an embankment, floodplain zoning and river restoration.
- Why is a flood warning useful even though it does not reduce discharge?
- What evidence would you use to compare discharge at two river sites? State one measurement limitation.
- In the Banbury example, why is it inaccurate to say the 2012 scheme “stopped all flooding”?
Short answers and explanation cues
- The long profile commonly becomes gentler towards the mouth; the valley usually becomes wider with a broader floodplain. Resistant rock, waterfalls, tributaries, reservoirs or a change in base level can interrupt a simple pattern.
- Hydraulic action uses water force or compressed air in cracks; abrasion is load scraping or striking the bed and banks; attrition is collision among particles, making them smaller and rounder; solution dissolves soluble minerals. Attrition changes the particles themselves.
- Competence is the largest particle size transportable, while capacity is the total load transportable. Higher discharge and velocity can increase both, though local turbulence and supply matter.
- The river follows weaker rock and erodes vertically, leaving alternating ridges of more resistant rock projecting into a narrow valley. Valley-side material and tributaries can further shape the pattern.
- Differential erosion leaves hard rock over softer rock; a plunge pool and undercutting weaken the base; the unsupported cap collapses; repeated retreat leaves a gorge.
- Faster flow and lateral erosion often occur at the outer bank, forming a river cliff. Slower flow deposits sediment on the inner bank, forming a slip-off slope or point bar.
- Bend growth narrows the neck; a flood may cut through it; deposition seals the former channel. The isolated lake may gradually infill into wetland or a meander scar.
- Water slows sharply as it spills from the channel, so coarse load drops near the banks and can build a levee. Fine silt and clay remain suspended longer and can settle farther across the floodplain.
- It is a tidal river mouth where river water meets seawater. Tides, salinity, river discharge and sediment supply vary, so channels and depositional areas shift.
- Answers should explain mechanisms, for example intense rain or saturated soil can accelerate runoff; impermeable surfaces can reduce infiltration; buildings on a floodplain increase exposure. Factors should not be listed without explaining a pathway.
- Six hours. It is the delay between the rainfall peak and the discharge peak at the gauge. 12–15. Answers should describe a place-specific mechanism and a limitation or trade-off, not claim that a strategy removes all risk.
Exam practice: build a geographical explanation
Short-response practice
Describe two changes likely to occur in a river valley downstream. Use a map, photograph or data in the question if supplied. A strong response identifies a pattern and anchors it to evidence, such as closer contours upstream or a wider floodplain downstream.
Explain how a waterfall can retreat to create a gorge. Avoid a one-sentence list: connect differential erosion, plunge-pool action, undercutting, collapse and retreat in the correct sequence.
Calculate discharge where the average wetted cross-sectional area is 7.5 m² and mean velocity is 0.6 m/s. Show the formula and units. The estimate is 4.5 m³/s. In a field context, explain why repeat velocity and depth measurements matter.
Compare two hydrographs. Quote both peak discharges and lag times, describe which river responds more rapidly, and use the basin evidence provided. Avoid attributing a response to urbanisation unless the data show urban land use.
Extended response: river management
Question: “Evaluate the use of flood management strategies in reducing risk to a settlement.”
Start with the settlement’s risk: name the river process or catchment condition, the exposed people or assets, and the consequence of flooding. Then compare at least two strategies that work in different ways. For example, upstream storage may delay a peak while local defences reduce the chance of water entering a built-up area. Discuss warnings or zoning as approaches that reduce harm or future exposure. Use a place example such as Banbury to support the explanation, then weigh costs, benefits, scale, fairness and residual risk.
A concise model paragraph might read:
“Banbury’s flood-alleviation scheme combines upstream storage with local defences. Storage temporarily holds floodwater and can delay some of the peak reaching the town, while walls and embankments protect selected built-up areas. This portfolio is more appropriate than relying on one wall alone because the measures address the flow pathway and exposure in different locations. However, storage land may be inundated, the defences have a design capacity, and people in the protected area still need warnings and preparation. The scheme therefore reduces risk but does not remove it; its success depends on maintenance, available storage, event size and how fairly the costs are shared.”
This paragraph is a structure, not a universal evaluation. A full answer should add accurate local evidence and the issue named in the question. For a different settlement, do not copy Banbury facts: use the supplied map, event, scheme or data.
Extended response: physical landscapes
Question: “Explain how physical processes create distinctive river landforms.”
Select landforms that let you show distinct process chains. A waterfall and gorge illustrate differential erosion and retreat; a meander and ox-bow lake illustrate lateral erosion, deposition and channel change; a floodplain and natural levee illustrate overbank deposition. A river-valley example such as the Tees can locate a real feature, while process diagrams clarify how it formed. Tie every named feature to a causal explanation rather than naming several landforms in a list.
An effective plan has three linked paragraphs:
- Starting conditions: identify gradient, rock resistance, valley shape, discharge or sediment.
- Process: explain erosion, transport or deposition and how the channel changes.
- Result and evidence: name the landform, locate it if evidence is available, and mention how the diagram or map supports the explanation.
If a question says “assess,” explain the importance of the process but recognise that time, geology, discharge, load and human interventions interact. If it says “describe,” focus on visible pattern and evidence before suggesting causes. If it says “explain,” make the mechanism explicit. The command word changes the work the answer must do.
Mark your own response
Use this checklist after writing a longer answer:
- Did I answer the exact river topic in the question?
- Did I use specialist terms accurately and define them through context?
- Did I give a sequence in which one change leads to the next?
- Did I use the map, graph, photograph or named example that the question supplied?
- Did I distinguish observed evidence from an inference?
- Did I identify who benefits and who may experience a cost?
- Did I reach a judgement supported by the comparison, rather than finish with “it depends”?
A revision answer does not need every fact in this guide. Select the facts that prove the point, keep the explanation connected, and use accurate units and place names.
Revision points
This is one of three landscape options; schools study two. Explain landform process sequences and evaluate flood management using evidence and downstream effects.
Curriculum alignment
- Curriculum coverage IDs:
aqa.3.1.3.river-landscapes - Related practice packs:
gcse_geo_p1_physical_environment_june_2022,gcse_geo_p1_physical_environment_june_2023,gcse_geo_p1_physical_environment_june_2024,gcse_geo_p1_physical_environment_november_2020,gcse_geo_p1_physical_environment_november_2021 - Shared concept tags:
rivers,fluvial-processes,flooding,river-management
Sources
- Curriculum/specification: https://www.aqa.org.uk/subjects/geography/gcse/geography-8035/specification/subject-content/living-with-the-physical-environment
- North Pennines National Landscape, High Force geosite — waterfall height, Whin Sill and geological context.
- North Pennines National Landscape, rivers and wetlands — upland river landscapes and habitats.
- UK National River Flow Archive, catchment information — catchment characteristics and flow records.
- Environment Agency, Banbury flood-alleviation scheme environmental statement — historic flood impacts and scheme assessment.
- Cherwell District Council, Banbury area strategy — scheme completion and local flood strategy.
- Cherwell planning committee, Banbury scheme works — selected construction details, including channel, road and floodplain works.
- GOV.UK, River Cherwell at Banbury flood-warning area — current warning and residual-risk context.
- GOV.UK, Natural flood management and evidence for river and floodplain management — benefits and site-specific limitations of natural approaches.
- For case-study facts, dates, totals and local conditions can change between datasets; use the source list and figures selected by your teacher for assessment.