 FoxChild@Learn
15. Resource management: food, water and energy overview
Curriculum status: Required core content.
This guide follows AQA GCSE Geography 8035. Named examples below are suggested teaching examples where the specification allows a school choice; use your teacher’s selected case study and verify current figures before an assessment.
Required knowledge
- Explain why food, water and energy matter to social and economic wellbeing and describe inequalities in supply and consumption.
- Describe UK resources and changing demand/provision across food, water and energy, including food miles, all-year/organic demand and agribusiness; water quality, deficit/surplus and transfer; and a changing energy mix with declining domestic fossil-fuel supplies.
- Explain how resource choices create opportunities and challenges and lead into the school’s selected option.
Key vocabulary
| Term | Meaning |
|---|---|
| resource security | reliable access to sufficient affordable resources |
| resource inequality | uneven access, availability or consumption |
| food miles | distance food travels from producer to consumer |
| water transfer | engineered movement of water between areas |
| energy mix | proportion of energy supplied by different sources |
How the geography works
Demand changes with population, income, technology and behaviour. Supply depends on physical availability, infrastructure, cost, quality and governance. In the UK, food imports and agribusiness, water deficits and transfers, and a changing energy mix create linked economic and environmental trade-offs.
1. What makes a resource secure?
A resource is something people value and use to meet needs or wants. A resource may be natural, human-made or a service of an ecosystem. Food, water and energy are essential because they support health and survival, but they also underpin farming, transport, industry, education, health care and household activity. A reliable electricity supply keeps hospitals, communications and refrigeration operating. Safe water supports drinking, sanitation and food production. Food supply depends on land, soils, water, energy, labour, storage and transport.
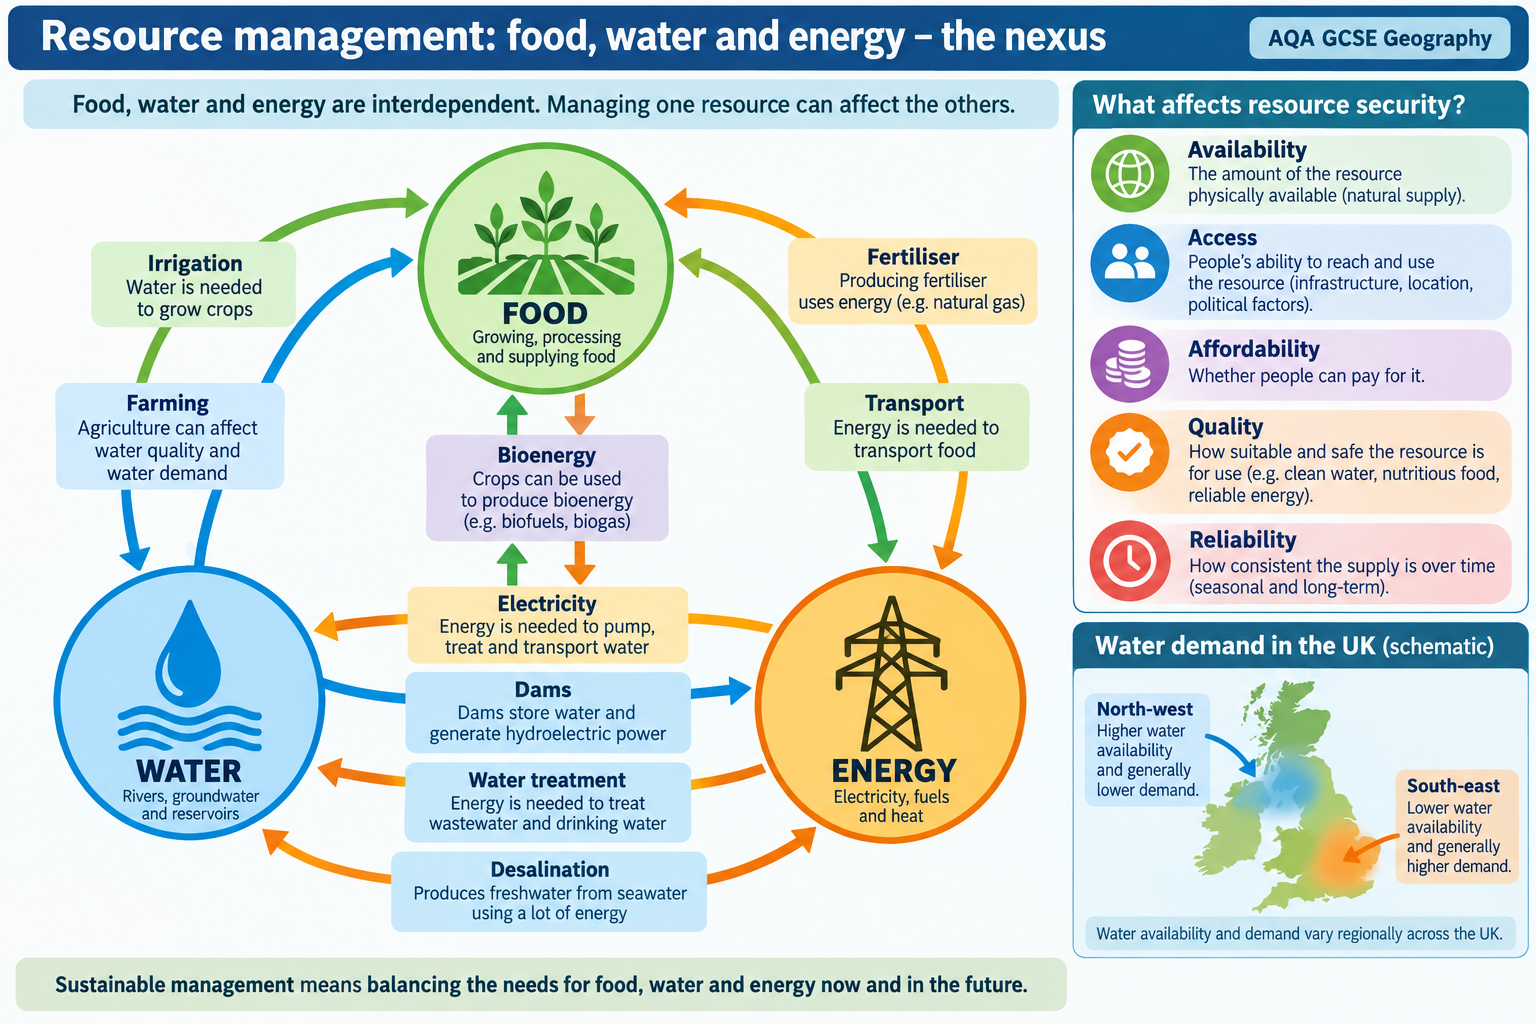
Resource security means people can access sufficient quantities of a resource of acceptable quality, at a reliable time and at an affordable cost. Security therefore has several dimensions:
- Availability: Is enough food, usable water or energy physically present or producible?
- Access: Can households reach a supply or connect to a network?
- Affordability: Can people pay for it without sacrificing other essential needs?
- Reliability: Is supply available when needed, including during drought, storms, market disruption or equipment failure?
- Quality and safety: Is the resource suitable for the intended use?
- Acceptability: Does its production, distribution and use meet social, cultural and environmental expectations?
A resource can be present in a country yet insecure for some communities. A river may carry a large volume of water, but people downstream may lack treatment works or pipes. A country may grow enough food in total while households cannot afford a nutritious diet. A national electricity network may reach a settlement but provide an intermittent service. Distinguish physical scarcity from economic scarcity (people cannot afford the resource) and infrastructural scarcity (systems cannot move, store or treat it reliably).
Interdependence of food, water and energy
The three resources form a connected system, sometimes called the food–water–energy nexus. Irrigation raises crop production but uses water and energy to pump it. Fertiliser manufacture uses energy; farm machinery, cold storage and transport do too. Hydroelectric dams produce electricity but change river flows and may affect downstream farming or ecosystems. Biofuel crops can supply energy while competing for land and water that could grow food. Desalination creates freshwater but needs energy and has to manage concentrated salty brine.
This means that improving one resource can increase pressure on another. A policy that expands irrigation may increase food supply while lowering a groundwater store. A shift to biofuels can reduce the use of fossil fuels while adding pressure to land and food prices. A dam may provide electricity and regulate river flow while displacing people or changing sediment movement. Resource decisions should therefore be assessed as a system rather than as isolated engineering solutions.
A simple resource-system model
For each resource, trace four stages:
- Source or production: Where does it come from, and what physical or economic processes make it available?
- Storage, treatment and movement: How is it processed and transported? Where can it be lost, polluted or disrupted?
- Distribution and access: Who receives it, at what price and level of reliability?
- Use, waste and recovery: How is it used, what waste is produced, and can materials or water be reused?
For example, food can be grown on farms, graded and packed, stored, transported to a wholesaler, sold to households and eventually eaten or wasted. A breakdown at any stage can reduce the amount that reaches people. A crop failure is a source problem; poor roads are a movement problem; high prices are an access problem; food waste is an end-use problem. A well-targeted strategy responds to the actual constraint.
2. Global inequalities in supply and consumption
Resource distribution is uneven because climate, soils, rivers, geology and energy reserves vary across space. It is also shaped by wealth, trade, technology, governance, ownership, infrastructure and political power. A region may produce a resource for export while nearby households lack access to it. International trade can move food, water-intensive crops, fuels and electricity across borders, so the location of production is not always the location of final consumption.
Food inequality
Food supply depends on farming conditions, access to land, irrigation, seeds, fertiliser, labour, finance, storage, transport, markets and political stability. A place with high crop production can still have food insecurity if households lack income, a road is blocked, conflict displaces farmers or a harvest is destroyed before sale. A country that imports food is not automatically food insecure: imports can make supply more diverse, but dependence on overseas markets can expose consumers to price or transport shocks.
Consumption also varies. Diets change with income, culture, urbanisation and access to shops. Higher incomes may increase demand for meat, dairy, processed food and out-of-season produce, which can require more land, water, feed or energy. Undernutrition and obesity can exist in the same country or community because access to nutritious food and the wider food environment are unequal. National calorie supply averages do not reveal the quality of each person’s diet.
Water inequality
Freshwater is unevenly distributed through the hydrological cycle and varies by season. Some regions experience reliable rainfall; others have long dry seasons or repeated drought. Geology affects storage and flow: permeable rock may store groundwater, while impermeable surfaces create rapid runoff. Rivers and aquifers cross administrative boundaries, making upstream and downstream decisions interdependent.
Water availability is not the same as access to safe water. Treatment, pipes, pumps, energy, maintenance and household affordability determine whether water can be used safely. Pollution from sewage, industry, mining, fertiliser or saltwater intrusion may reduce the usable supply. Over-abstraction can lower groundwater levels or reduce river flow. Poor households may pay more per litre when they rely on vendors than wealthier households connected to a network.
Energy inequality
Energy supply depends on the location and quality of fossil fuels, uranium, rivers, sunlight, wind, tides and geothermal heat. A resource may be technically present but expensive to extract or far from users. Pipelines, grids, ports, storage, skilled labour, finance and political stability affect whether it becomes a reliable supply. Energy production can also be exported, meaning that extraction near a community does not guarantee that local homes are connected.
Consumption is often higher where people have larger homes, more appliances, private vehicles and energy-intensive industries. A low national average can hide households without electricity or clean cooking fuel, while a high average can include both energy poverty and very high use. Consider who uses the energy and for what purpose. A hospital’s electricity demand and luxury consumption are not equivalent in social value.
Read inequality at more than one scale
Global maps can show broad patterns, but they may average together contrasting groups and places. National accounts show total production or consumption, not the distribution within a country. Per-capita data make populations more comparable but still hide unequal access. A household survey can show affordability or service access, but may not identify the cause. Use a scale that matches the question and state what the indicator measures.
| Evidence type | What it can help show | What it cannot prove by itself |
|---|---|---|
| Production total | Where a resource is grown, generated or extracted | Whether local households can afford or access it |
| Consumption per person | Average use relative to population | How use is distributed or whether access is reliable |
| Network-connection rate | The share connected to pipes, grids or services | Water quality, continuity, affordability or actual use |
| Price data | How the cost changes through time or between places | Whether households have income or alternatives |
| Import/export data | Dependence on trade and global supply chains | Which groups benefit from trade or how resilient the route is |
| Household survey | Experiences of access, quality and affordability | Full national coverage unless the sample is representative |
3. UK resource management: changing demand and provision
The UK is connected to international food, water and energy systems. Domestic production, imports, exports, infrastructure, household behaviour and environmental constraints all shape provision. A national overview is a starting point; it is not the same as one school’s local case study or one household’s experience.
Food in the UK
UK consumers expect a varied supply through the year, including fruit and vegetables that are seasonal in Britain. Imported produce can extend the range and provide year-round availability, but reliance on a small number of supply routes or overseas growing regions can increase exposure to drought, harvest loss, political disruption and transport delay. Domestic farming also depends on energy, imported inputs, labour, water, animal feed and trade arrangements.
Demand for high-value food exports from lower-income countries can bring income and jobs for growers, packers and exporters. Export crops may be grown in a different season from UK harvests, which can complement domestic production. The effects depend on worker pay and conditions, water use, land ownership, local food prices and how much value stays with growers. Export earnings can support investment, but communities may have less control over production if contracts and processing are concentrated in larger companies.
The demand for organic produce and food with particular standards can create market opportunities. Organic methods restrict specified synthetic inputs under the relevant certification rules; actual practices vary by farm and crop. Organic food is not automatically lower-carbon, more nutritious or more sustainable in every context. Yield, soil health, energy use, transport, seasonality, packaging and biodiversity all matter. Compare production systems using clear criteria rather than treating a label as a complete environmental assessment.
Food miles describe the distance food travels from producer to consumer. Transport contributes to emissions, but distance alone does not reveal the full footprint. Production method, refrigeration, processing, packaging, storage and the mode of transport also matter. Air-freighted produce can have a high transport impact per kilogram, while a long sea journey may have a lower transport impact per kilogram than local heated greenhouse production. A “local” label also does not guarantee low emissions if production is energy-intensive or food is delivered in small, inefficient loads.
Moves towards local sourcing can support nearby farms, regional food economies and supply resilience. Seasonal menus can reduce the need for energy-intensive storage or production, depending on crop and method. However, local sourcing may not be possible for every crop, and local products are not automatically affordable to every household. Food policy has to balance availability, nutrition, price, farmer livelihoods, environmental impact and resilience.
Agribusiness describes large-scale, commercially organised farming and linked processing or distribution. It can use mechanisation, specialist technology, data and contract supply chains to produce food efficiently and consistently. Large operations may access capital and markets that smaller farms cannot. Risks include concentration of ownership, pressure on farm workers, high input use, reduced crop diversity, habitat loss and dependence on a small number of suppliers. It is not simply a synonym for “bad farming”; evaluate its production and distribution model and the rules that govern it.
Water in the UK
Water demand changes with population, household use, farming, manufacturing, power generation and service activity. Per-person use may change as household size, appliances, gardens and attitudes change. Water companies need to estimate future demand, leakage, drought probability, environmental flow requirements and the costs of new supply. A region may need more water even when annual rainfall appears high if rainfall falls in a different season or is not stored where demand occurs.
The UK has broad north–west and south–east differences in rainfall and demand. South-east England has high population and economic demand relative to available water in many catchments, while parts of the north and west tend to be wetter. This is a general pattern, not a rule for every catchment. Water-company boundaries, river basins and local geology do not align neatly, and climate change may alter rainfall timing and drought risk.
Water quality can be affected by sewage discharges, agricultural runoff, industry, road drainage and physical changes to rivers. Treatment and pollution control help protect public health and ecosystems, but monitoring, maintenance and enforcement are ongoing tasks. Wastewater treatment returns water to rivers or the sea after removing specified pollutants; it does not mean every contaminant is removed. Pollution management can involve treatment investment, source controls, catchment partnerships, wetlands and enforcement.
Water companies balance supply and demand with reservoirs, groundwater abstraction, river abstraction, water transfers, leakage reduction, demand management and, in some areas, desalination. A water deficit occurs where demand is greater than the reliable supply available locally. A surplus indicates greater availability relative to demand over a defined period. These categories depend on the time period, environmental limits and infrastructure, not only rainfall.
Water transfers move water from a place or time with more available supply to one with greater demand. Reservoirs can store water from wetter periods, but new storage takes land and money and may affect habitats or communities. A transfer may improve resilience for receiving users while reducing flexibility in the source catchment. Conservation and leakage reduction can lower pressure, but they need public participation, fair pricing and investment in repairs.
Energy in the UK
The UK energy mix has changed as domestic coal, oil and gas production has declined and low-carbon electricity has grown. The exact shares vary by year and by whether a statistic describes electricity generation, primary energy supply or final energy consumption. These measures are not interchangeable: electricity is only one energy carrier, while oil used in transport or gas used for heating may be counted elsewhere.
Fossil fuels remain important in heating, transport, industry and some electricity generation. Domestic production has fallen from historical peaks, so the UK also uses imports. Import dependence can support supply but expose consumers to international prices, exchange rates and geopolitical disruption. Domestic extraction can provide jobs and revenue, but may affect landscapes, air, water and climate. The balance between security, price and environmental cost is a policy decision.
Renewable sources include wind, solar, hydroelectricity, bioenergy and marine energy. Their output and impacts vary. Offshore wind can produce large quantities of electricity when winds are favourable, but requires grid connections, ports, maintenance and balancing with other supply. Solar output changes with daylight, cloud and season. Hydropower depends on river flow and can alter habitats. Bioenergy may emit carbon when burned and its overall climate effect depends on feedstock, land-use change, processing and regrowth.
The transition creates opportunities for engineering, construction, manufacturing and maintenance, while also requiring investment in grids, storage, interconnection and flexibility. Costs are distributed among taxpayers, billpayers, companies and communities in different ways. Renewable infrastructure can be contested over visual effects, land and marine use. Planning and community participation influence whether national climate goals are compatible with local priorities.
Comparing the three UK resource systems
| Resource | Changing UK demand or provision | Main opportunity | Main challenge |
|---|---|---|---|
| Food | All-year choice, imports, organic demand and agribusiness supply chains | Reliable variety, export markets, local sourcing and innovation | Emissions and vulnerability through production, trade, waste and unequal affordability |
| Water | Population and economic demand vary against rainfall, catchments and infrastructure | Transfers, storage, conservation, treatment and recycling can improve reliability | Deficits, pollution, leakage, ecosystem needs and unequal affordability |
| Energy | Domestic fossil-fuel supplies decline while the electricity mix changes | Renewables, efficiency, skills and new industries can reduce emissions | Reliability, affordability, import exposure, grid investment and land/sea impacts |
Do not assume these are three separate problems. For example, drought can reduce crop yields and raise food prices; irrigation uses energy; energy prices influence fertiliser and transport costs; and water treatment and distribution require electricity. A policy that changes one part can create costs or benefits elsewhere.
UK demand and supply: why national averages can mislead
Population totals and national supply figures provide context, but resource systems operate through catchments, farms, ports, electricity networks and household budgets. Water availability changes with rainfall, storage, abstraction and the condition of local infrastructure. Energy is carried by different networks and fuels; a household using gas for heating faces a different system from one relying on electric heating. Food access depends on shops, transport, income, diet and the ability to store or cook food.
Even within a well-resourced country, affordability can create insecurity. A household that spends a high proportion of its income on energy may ration heating, while another household uses more power for comfort and convenience. A person living far from a supermarket or with limited mobility may have fewer options for affordable nutritious food. A water connection may be available, but bills or poor water quality may still be a barrier. These are examples of unequal access, not proof that the country has no resource supply.
Local geography also matters. A coastal town can face different options for water supply than an inland city; an area with strong winds may suit wind generation but still need grid capacity; a fertile lowland may be important for agriculture but also face pressure from housing and transport. Resource management is about negotiating different uses of land and infrastructure, not simply locating a physical resource.
How resource demand changes
Demand is influenced by population size and structure, household income, technology, prices, culture and public policy. More people can increase total demand even if each person’s use is unchanged. Rising income may increase demand for a varied diet, private transport, appliances and heating or cooling. Efficient appliances and insulation can lower the resource required for a service, while rebound effects may occur if lower operating costs encourage more use.
Technology can change the demand as well as the supply. Cold storage reduces food spoilage but uses electricity; irrigation can raise crop yield while using water; data centres support online services but need power and cooling; electric vehicles shift energy demand from liquid fuels to electricity and require charging infrastructure. Assess both the direct effect and the wider system that makes the technology possible.
Prices influence behaviour, but price signals can affect low-income households most strongly. A higher water or energy tariff may encourage conservation, yet can make essential use unaffordable without support. A tax or subsidy can change incentives, but its impact depends on alternatives available. If a family cannot insulate its home, it cannot respond to a high heating cost in the same way as a household able to retrofit and switch technology.
Resilience, redundancy and trade-offs
Resilience is the ability of a resource system to continue functioning or recover when disrupted. A resilient food system can combine domestic production, diverse import sources, storage, local distribution and reduced waste. A resilient water system can manage catchments, repair leakage, store water, reduce peak demand and protect multiple sources. A resilient energy system can use a mix of generation, storage, interconnection, demand response and reliable networks.
Redundancy means having backup capacity or alternative routes. It can improve reliability, but building and maintaining spare infrastructure is expensive and can cause environmental impacts. A system designed only for average conditions may fail during a drought, cold spell, storm or geopolitical shock. Designing for resilience therefore requires decisions about the acceptable level of risk and who pays to reduce it.
Diversification can lower dependence on a single supplier, crop, river basin or fuel, but may create more complex supply chains. Domestic production can reduce some external exposure while increasing pressure on land, labour and water. Imports can diversify climate risk between growing regions while increasing reliance on ports and freight. No strategy removes all risk; management distributes and reduces it.
From a hazard to resource insecurity
A weather event does not affect resource security in the same way everywhere. A prolonged dry spell can reduce harvests, river flow and reservoir storage. The effect on people depends on how much reserve is available, whether crops have irrigation, whether food can be imported, how well roads function and whether households can afford higher prices. A flood can damage crops and roads while also contaminating water supplies. The same event may create a short disruption in a wealthy, well-connected region and a longer crisis where storage, health care or transport is limited.
This is why exposure and vulnerability matter. Exposure describes people, crops and infrastructure located where a hazard can occur. Vulnerability describes how susceptible they are and how well they can cope and recover. A resource-security answer should connect the physical hazard to the system and the people affected: rainfall deficit → lower crop yield → reduced market supply → higher price → lower access for households with little income. Another pathway could be low reservoir storage → restrictions → reduced industrial output or household use. State the links and do not skip straight from “drought” to “famine” or “conflict.”
Preparedness can interrupt the chain. Crop diversification, early warnings, insurance, storage, water efficiency, social support and alternative transport routes may reduce the consequences. Each option requires finance, institutions, community trust and maintenance. A drought-resistant seed only helps if farmers can obtain it, it is suitable for local conditions and households retain access to the harvest. Resilience depends on access and decision-making as well as technology.
This chain can be used with both global and UK examples. In a UK catchment, a dry winter can reduce soil moisture and refill of reservoirs; a hot summer can increase household demand at the same time. Farmers, water companies, wildlife and households may then compete for limited flows. In a food-importing city, the same dry period may be less visible at first because supply arrives through retailers, yet global harvest conditions and transport costs can still influence prices. Resource insecurity can be displaced across distance rather than removed.
Think about who has the power to respond. A large farm may invest in storage or irrigation, while a tenant farmer may not control the land or have access to credit. A well-insulated home can use less energy to stay warm than a poorly insulated one. A company can purchase water or energy backup while a low-income household cannot. Management that reduces total pressure but ignores unequal capacity may leave the most exposed people facing the greatest risk.
Choosing evidence for a resource-management question
Before using a statistic, identify what it represents. “Energy” might mean primary energy supply, final consumption or electricity generation. “Food availability” can describe national calories, crop output or supermarket supply, while food security also includes affordability and nutrition. “Water access” may mean a household connection or a safely managed service. The same term may be measured differently by separate organisations, so quote the unit and year.
When describing a resource flow, use arrows only where the source supports direction. An import map shows trade between locations, but may not reveal the final consumer or ownership of the goods. A river basin map can identify upstream and downstream places, but should not suggest that every household is connected to the river. A supply chart can show how the mix changes over time, but it needs a denominator and a clear category definition.
For an evaluation, compare at least two strategies using common criteria. A reservoir and leakage-reduction programme can both improve water security, but differ in delivery time, cost, reliability, environmental impact and who benefits. A local-food initiative and an import-diversification strategy both aim to strengthen food supply, but address different risks. Explain what each option solves, then identify the remaining problem.
4. A resource-security decision framework
When comparing management strategies, ask the same questions for each proposal:
- Which constraint is being addressed? Is the main issue physical supply, pollution, transport, price, unequal access or waste?
- Who benefits, and at what scale? Identify households, farmers, firms, regions and future users.
- What is the time horizon? Is the measure an emergency response, a temporary bridge or a long-term system change?
- How reliable is it? Consider drought, equipment failure, market prices, political change and maintenance.
- What other resources does it use? Trace land, water, energy, materials and labour.
- What are the social and environmental costs? Include displacement, pollution, affordability and habitat impacts.
- What evidence would show success? Use outcomes—such as reliable safe water or reduced food waste—not just money spent or infrastructure built.
For a water-transfer proposal, for example, ask whether the source basin has enough water after ecological needs are met; how much reaches users; who pays; whether the route crosses communities or habitats; and what happens in a simultaneous drought. A transfer may be justified, but only a whole-system assessment can show whether it is better than leakage repair, storage, conservation or a combination.
5. Exam use: map, graph and data practice
Resource data often use different units. Food may be reported in tonnes, calories per person per day, crop yield per hectare or a household affordability measure. Water may be measured as litres per person per day, river flow, storage volume or percentage of people using a service. Energy may be measured in kilowatt-hours, terawatt-hours, capacity, generation or share of total supply. Identify the denominator before comparing.
For a map, check the key, scale, boundaries and date. A choropleth can show regional water stress, but classes may conceal large differences within each area. A flow map can show the direction of an import or water transfer, but line width must be read from the legend. For a chart, identify whether values are totals or percentages and whether the vertical axis begins at zero. Describe a clear pattern first, support it with data, and then offer an explanation that matches the evidence.
When two resources are compared, avoid claiming causation from correlation alone. If high-income places use more energy, income may be one explanation, but climate, industry, household size and infrastructure may also matter. If rainfall is high but safe-water access is low, the map may suggest an infrastructure or governance constraint, but another source is needed to test it.
Common misconceptions
- “A resource exists, so everyone can use it.” Availability is different from access, affordability, quality and reliability.
- “Imports always reduce security.” Trade can diversify supply, but dependence on vulnerable routes or suppliers can add risk.
- “Local food is always lower-carbon.” Production method, season, storage and transport mode also affect impact.
- “The UK has one water supply pattern.” Catchments, companies, demand and rainfall vary regionally and seasonally.
- “Renewable energy has no environmental impact.” Materials, construction, land use, grid and end-of-life effects matter.
- “More supply solves every resource problem.” Reducing losses, improving access or lowering waste may address the actual constraint more effectively.
Self-check
- How can a place experience economic water scarcity even if annual rainfall is high?
- Give two links between food, water and energy systems.
- Why is food-mile distance alone insufficient to compare food footprints?
- Explain one reason UK water supply and demand vary by region.
- Why must energy data distinguish electricity generation from total energy use?
- What evidence would help decide whether a resource project is successful?
Revision points
Learn the resource-security dimensions and be able to apply them to food, water and energy. Know the broad UK demand and provision issues, then revise the school’s detailed option separately. In every answer identify the scale, time period, resource flow and group affected; support explanations with evidence and evaluate trade-offs across the whole system.
Place example
Use UK food, water and energy examples to show that national supply can mask local or household access. This core guide is required; AQA then requires schools to study one option in depth: food, water or energy.
Maps, data and evidence
Read a resource-flow map or supply chart with units and dates. Distinguish production, consumption, imports and access; use per-capita measures carefully.
Common misconception
Resource scarcity can be physical, economic or infrastructural. A country can have adequate national supply while some communities lack secure access.
Self-check
- Why are food, water and energy interdependent?
- Name one UK food-system challenge and one water-supply challenge.
- Which of the three detailed options does your school study?
Revision points
Revise the shared overview, then focus your detailed case-study learning on the one resource option chosen by your school. Be able to distinguish total resource supply from household access, and explain how resilience changes between places and seasons.
Curriculum alignment
- Curriculum coverage IDs:
aqa.3.2.3.resource-management - Related practice packs:
gcse_geo_p2_human_environment_june_2022,gcse_geo_p2_human_environment_june_2023,gcse_geo_p2_human_environment_june_2024,gcse_geo_p2_human_environment_november_2020,gcse_geo_p2_human_environment_november_2021 - Shared concept tags:
resource-management,food-security,water-security,energy-security,natural-resources
Sources
- Curriculum/specification: https://www.aqa.org.uk/subjects/geography/gcse/geography-8035/specification/subject-content/challenges-in-the-human-environment
- Further reading: FAO: World food situation
- Further reading: Environment Agency: Water resources
- Further reading: International Energy Agency: Energy system
- For case-study facts, use the source list and figures selected by your teacher; dates, totals and local conditions can change between datasets.