 FoxChild@Learn
19. Issue evaluation
Curriculum status: Required core content.
This guide follows AQA GCSE Geography 8035. Named examples below are suggested teaching examples where the specification allows a school choice; use your teacher’s selected case study and verify current figures before an assessment.
Required knowledge
- Interpret an advance resource booklet and unseen resources about a contemporary issue.
- Analyse evidence, identify stakeholder viewpoints, compare options and justify a decision.
- Connect physical and human processes across scales and evaluate likely impacts of a proposal.
Key vocabulary
| Term | Meaning |
|---|---|
| stakeholder | person/group affected or interested |
| synoptic | drawing together several course themes |
| trade-off | gain in one area linked to a cost elsewhere |
| evaluation | reasoned judgement against stated criteria |
| secondary data | evidence collected by someone else |
How the geography works
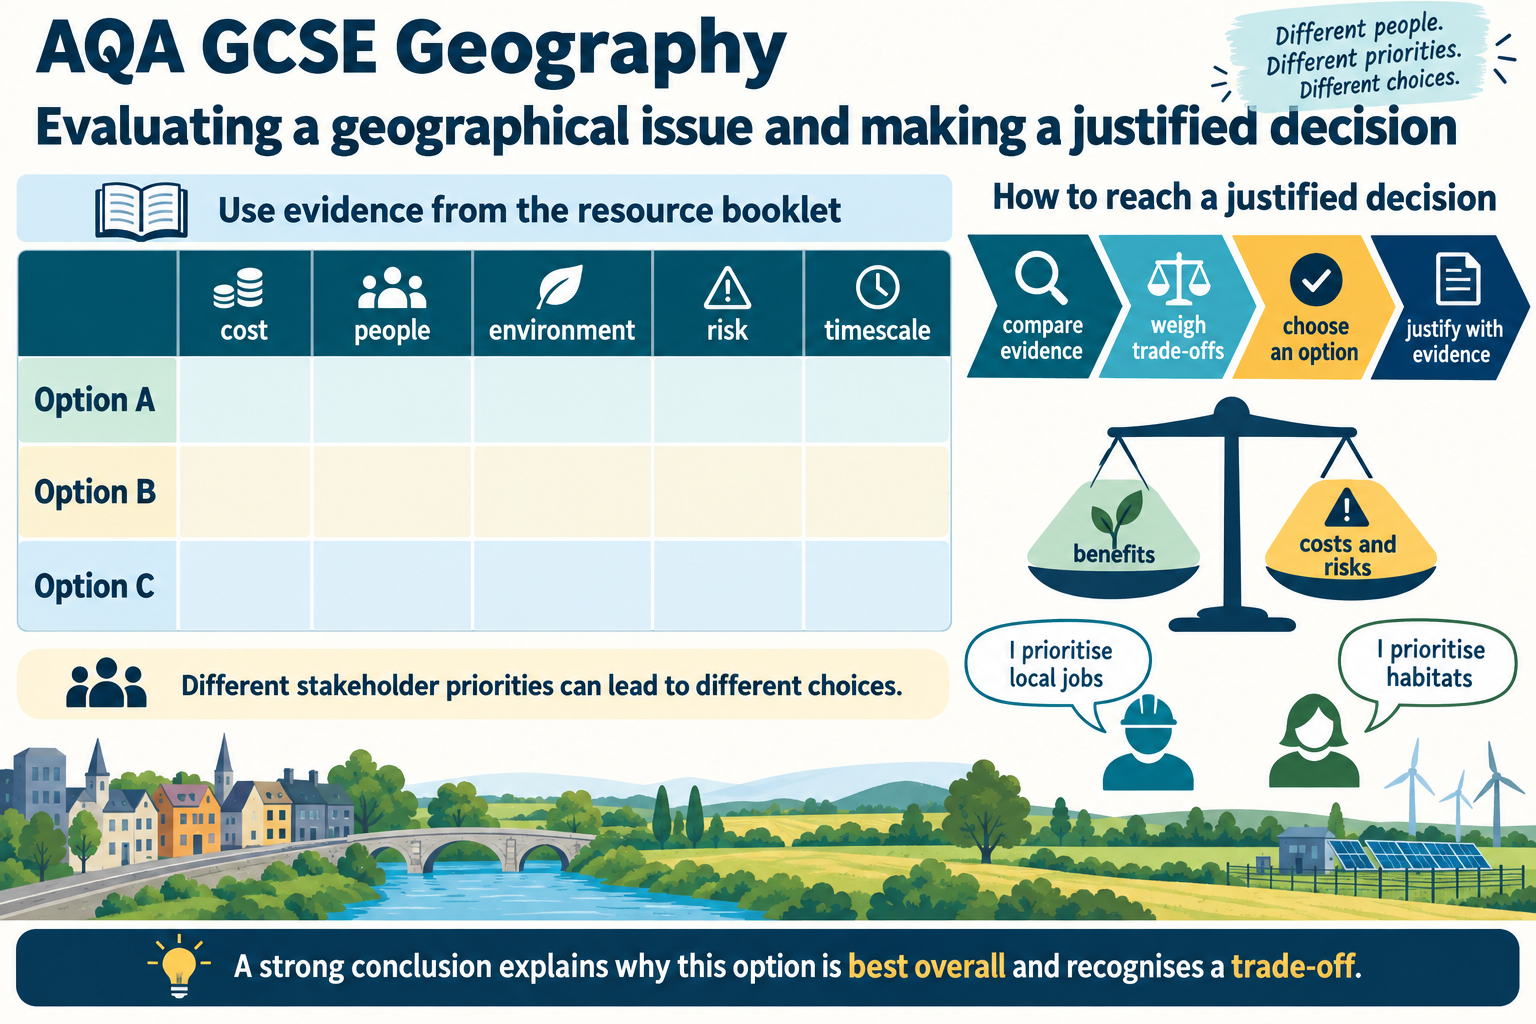
Start by locating the issue and reading every source for type, date, scale and viewpoint. Extract evidence, identify uncertainty and affected groups, compare options against explicit criteria, then reach a justified decision. A strong judgement recognises trade-offs and explains why one option is preferable overall.
1. What issue evaluation asks you to do
Issue evaluation is the synoptic and decision-making part of AQA GCSE Geography 8035 Paper 3. It asks you to apply knowledge, understanding and skills from the wider course to a contemporary geographical issue. The context may be unfamiliar, but the processes, relationships and ways of evaluating are grounded in the physical and human themes you have studied.
The task usually builds from interpreting sources towards a final evaluative response. You may be asked to identify a pattern, use figures, explain an issue, analyse viewpoints, compare possible options and justify a decision. The final response should show that you can connect evidence to geographical processes and explain likely effects on people and the physical environment.
AQA’s specification states that the pre-release resource booklet is made available twelve weeks before the examination. Students can become familiar with its material, but the examination provides a clean copy. The question paper may add unseen material or a new context. Always follow your current teacher’s instructions and the current AQA assessment information for your exam series; the exact issue and resources change.
The central chain
Issue evaluation brings together six tasks:
- Locate and frame: What is happening, where, at what scale and over what time period?
- Interpret: What do maps, graphs, photographs, statistics and written sources show?
- Explain: Which physical and human processes create the pattern or problem?
- Compare: What options are available, and how do their effects differ?
- Evaluate: Who benefits, who bears costs, how certain is the evidence and what trade-offs matter?
- Decide: Which option is most justified against the criteria, and under what conditions?
The decision should follow from the evidence and criteria. Do not begin by choosing your preferred option and then search only for support. Consider each option fairly, including disadvantages of the option you ultimately favour.
2. Prepare the pre-release materials
The pre-release booklet is not a script to memorise. It is a set of sources to understand and use. Before the examination, build a compact issue file that helps you recognise the place, processes, interested groups, options and evidence. During the exam, read the booklet again because questions may direct attention to details you did not focus on in preparation.
First read: orient yourself
Record the issue in one plain sentence. Identify the location, the proposed change or conflict, the main decision being considered and the date of the information. Mark unfamiliar place names and use an atlas or locator map to establish relative and absolute location. Find the local area, its region, country and wider connections.
Then identify the geographical scale. Is the issue about one site, a neighbourhood, a city, a river basin, a region or an international connection? The same proposal may have different effects at different scales. A new road can reduce journey times locally, change regional access to jobs and add national carbon emissions. Keep those scales distinct.
Build a source inventory
For every source, note:
- its format: map, graph, photograph, satellite image, field sketch, table, quotation or written extract
- who produced it and for what purpose, where this is stated
- date, time period, location and scale
- what it measures or depicts
- one useful claim it can support
- a limitation, uncertainty or missing perspective
An inventory prevents important resources from being overlooked. It also helps you select the best evidence when writing. Do not treat all sources as equally strong for every claim. A map is useful for location and distribution; a photograph shows visible conditions at one moment; a survey records the experiences of its respondents; a technical report may provide measurements but use specialist assumptions.
Organise knowledge, not a memorised essay
Prepare brief notes under five headings:
- Place: locator, site, surrounding land use, population and connections.
- Processes: relevant physical and human geography, including interactions.
- Stakeholders: groups affected, their interests and their evidence.
- Options: likely benefits, costs, timescale and uncertainty for each.
- Questions: what remains unknown and what additional evidence would improve the decision.
This organisation lets you respond to the wording of the examination question rather than reproducing a prepared answer that may not fit. Use course knowledge to explain the resources, not to replace them.
3. Interpret evidence with care
Maps
Before interpreting a map, read its title, legend, scale, north arrow, grid or coordinate system and date. Identify the mapped area and the relationship between the issue site and surrounding features. Look for clusters, gradients, routes, barriers, land uses and possible affected groups. If two maps use different scales or time periods, state that before comparing them.
For a choropleth map, values are assigned to areas, so a shaded district may contain substantial internal variation. For a flow-line map, line width represents a quantity only if the key says so. A site plan can show the location of a proposal but may omit nearby uses or future development. Make an inference, then state the evidence that supports it.
Graphs and tables
Read axes and units before describing a trend. Establish whether values are totals, rates, percentages, averages, capacity, output or forecasts. Check the time period and whether a vertical axis starts at zero. A large-looking change on a truncated axis may be numerically small; a stable average can hide differences between groups.
Use precise values where helpful. Compare two dates, identify a maximum or minimum, describe a pattern and explain its geographical meaning. If a graph shows a relationship, do not claim causation without evidence. An association between traffic and air pollution might reflect road use, weather, street layout or other sources.
Photographs and satellite images
Describe what is visible before inferring what it means. A photograph may show construction, traffic, erosion, vegetation, settlement density or land use, but the viewpoint and date limit what can be concluded. Identify scale using known features. A satellite image can show land-cover change across a wider area, but it does not automatically show ownership, income, health or people’s opinions.
Compare images taken at different times only if location, resolution, season and conditions are sufficiently similar. A dry-season image and a wet-season image can make vegetation appear to have changed even when the long-term land cover is similar. Treat captions and dates as part of the evidence.
Written extracts and quotations
An extract may explain policy, describe an impact or report a stakeholder view. Identify the speaker’s role and interest. A developer may emphasise jobs and delivery; a resident may focus on housing, noise or access; an environmental organisation may emphasise habitat and long-term risk. Each viewpoint can provide useful evidence, but a quotation is not automatically representative of the whole group.
Use short paraphrases rather than copying long passages. Link the statement to the speaker’s perspective and compare it with another source. If an extract makes a claim but gives no data or method, treat it as a viewpoint or assertion whose reliability needs testing.
Statistics and uncertainty
Every statistic has a definition and method. Ask who was counted, how many observations were made, how the sample was selected, what period was covered and whether the statistic is an estimate, forecast or direct measurement. A forecast describes a possible future under assumptions; it is not a guaranteed outcome. A percentage may conceal the size of the group it represents.
Use uncertainty openly. You might say “the survey suggests” if the sample is small, “the forecast indicates” if it is modelled, or “the photograph shows conditions at this site on the date taken.” Careful qualification shows that you understand evidence, not that you lack confidence.
4. Understand stakeholders and conflicting viewpoints
A stakeholder is a person, group or organisation that affects, is affected by or has an interest in a decision. Stakeholders may include residents, landowners, tenants, commuters, businesses, workers, farmers, visitors, public agencies, developers, utilities, environmental groups and future generations. Some stakeholders have formal decision-making power; others may have less access to consultation or compensation.
For each stakeholder, identify:
- their location and how directly they experience the proposal
- their likely priorities, such as safety, jobs, affordability, access or habitat
- what evidence or experience supports their view
- what they might gain or lose in the short and long term
- how much influence they have over the decision
Do not assume every member of a group agrees. Residents may value jobs and worry about noise at the same time. Businesses may support improved access but oppose construction disruption. Workers may support a project that offers employment while asking for safe conditions. Viewpoints can be mixed, conditional and change over time.
Power, participation and fairness
Decision-making can favour groups with money, technical expertise, legal access or political influence. Some communities may have less information or be consulted after key choices are made. A fair process explains alternatives, gives affected groups time and accessible ways to respond, and shows how feedback influenced the final design.
Equity questions include who receives the benefits, who pays, who is displaced, whose travel or access improves, and who faces noise, pollution or risk. A proposal can increase total economic output while concentrating gains among a few owners. It can also create a public benefit while imposing a severe local cost. Evaluation should report both.
Stakeholder conflict is geographical
Conflicting viewpoints often reflect different relationships to place. A commuter may value a faster road connection; a nearby resident may experience traffic and noise. A farmer may depend on water for crops while downstream households need drinking water. A conservation group may value habitat continuity; a developer may focus on housing or employment. These perspectives arise from spatially different exposure, dependence and access.
Map where stakeholders live or work in relation to the proposal. Identify upstream and downstream users, near and distant residents, source and destination regions, or urban and rural connections. This makes the conflict more than a list of opinions.
5. Compare options using explicit criteria
Before comparing options, identify what each option actually involves. Distinguish a location change from a design change, a demand-management approach from a new supply, and a short-term response from a long-term strategy. Options may also be combined; a decision could select one main proposal with conditions or mitigation measures.
Useful criteria include:
- Social: health, safety, housing, access, displacement, community cohesion and fairness.
- Economic: construction and operating costs, jobs, productivity, local business, prices and public revenue.
- Environmental: emissions, air and water quality, soil, habitats, landscape, resource use and resilience.
- Geographical scale: effects at the site, neighbourhood, region, national network and global system.
- Time: implementation delay, short-term disruption, long-term benefits and maintenance.
- Feasibility: technology, land, finance, skills, planning, legal constraints and delivery capacity.
- Risk and uncertainty: likelihood, severity, reversibility, evidence quality and ability to respond.
Use criteria that relate directly to the question. If the question asks which option is most sustainable, explain what sustainability means in that case: long-term reliability, affordability, environmental limits and social fairness may all matter. Do not apply a checklist mechanically when some criteria are irrelevant.
A comparison matrix
| Criterion | Option A | Option B | Evidence needed |
|---|---|---|---|
| Cost and who pays | Direct and indirect costs; one-off or ongoing | Direct and indirect costs; one-off or ongoing | Budget, maintenance estimate, household costs |
| People affected | Beneficiaries, displaced groups, nearby residents | Beneficiaries, displaced groups, nearby residents | Population map, survey, access data |
| Environment | Emissions, water, soil, habitat and landscape | Emissions, water, soil, habitat and landscape | Baseline surveys, forecasts, monitoring |
| Time and reliability | Build time, service life, failure risks | Build time, service life, failure risks | Delivery schedule, technical evidence |
| Fairness | Distribution of gains and costs | Distribution of gains and costs | Stakeholder evidence, distribution data |
The matrix helps organise thinking, but do not add points as if every criterion has equal value unless the question or evidence justifies equal weighting. One severe irreversible impact may matter more than several small benefits. Explain how you weigh criteria and why.
Consider no action and alternatives
If “do nothing” is an option, evaluate its likely consequences. The current situation may continue to create costs, but it may also avoid construction impacts or preserve flexibility. Do not describe no action as having no effect. Existing trends, hazards or inequalities continue even without a new project.
Alternative options can reduce a problem in different ways. A city facing traffic might build a road, improve public transport, manage parking or support active travel. A water-scarcity issue might be addressed through transfer, storage, reuse, conservation or leakage repair. A flood-risk issue might involve hard engineering, land-use planning, warning systems or restoration of natural storage. Compare the mechanism each option uses and the scale it serves.
6. Apply physical and human geography together
The issue evaluation is synoptic: it may require links between physical and human processes. A physical hazard affects people according to exposure, vulnerability, infrastructure, wealth, governance and preparedness. A human decision can alter the physical environment through land cover, water flow, pollution or habitat change. Explain the interaction rather than treating the two themes as separate paragraphs.
For a development proposal, consider relief, geology, drainage, climate, ecosystems and natural hazards as well as population, transport, employment, housing and services. For a resource decision, consider physical supply and environmental flows alongside price, ownership, demand and distribution. For a coastal or river issue, connect process and landform with settlement and management.
Link scales and networks
Geographical decisions have effects beyond the project boundary. A new port can create jobs locally, change transport demand regionally and alter trade flows internationally. A water transfer can increase urban supply while affecting a source basin. A renewable-energy development can supply a national grid while changing local landscapes and sea uses. Trace the link through at least two scales.
Networks move goods, people, water, energy, information, pollution and risk. A road may connect a remote settlement to services while increasing traffic or development pressure. A river carries water, sediment and pollution downstream. A supply chain connects local production to distant consumers and markets. Identifying flows helps explain why a decision affects places that are not adjacent.
Explain physical-human feedbacks
A decision may create feedback effects. New housing can increase population and water demand, which prompts further infrastructure; construction can reduce infiltration and raise surface runoff, increasing flood risk. A coastal defence may protect property locally but shift erosion or sediment patterns. Irrigation can raise crop output but lower groundwater, affecting future supply. Explain the sequence and identify where management could reduce the feedback.
Do not assume every feedback is negative. A floodplain restoration scheme may store water, support habitat and provide recreation while reducing flood risk downstream. Public transport can improve access and reduce car use if routes and fares work for residents. A well-managed renewable scheme can lower emissions and support skills. Use evidence to judge the likely scale and reliability of the benefit.
7. Write a reasoned evaluative answer
A paragraph structure
A useful paragraph can follow claim → evidence → explanation → counterpoint → judgement:
- Claim: State a geographical point that answers the question.
- Evidence: Select a relevant figure, map detail, quotation or case-study fact.
- Explanation: Explain the process linking evidence to an impact.
- Counterpoint: Identify who might experience a different effect, or what limits the claim.
- Judgement: Explain the significance of the point in relation to the decision.
Not every paragraph needs all five steps, but extended evaluation should do more than list advantages and disadvantages. Use evidence from more than one resource and connect it to the place and process.
Build an overall judgement
A strong conclusion:
- answers the exact question and states the preferred option
- compares options against the most important criteria
- recognises who benefits and who carries costs
- uses source evidence and subject knowledge
- qualifies the decision where uncertainty or conditions matter
- explains why the chosen option is better overall, not just why it has one benefit
Avoid introducing a completely new argument in the final sentence. The conclusion should weigh the evidence already discussed and resolve a tension. A conditional judgement is often appropriate: “Option A is preferable if the proposed monitoring and access measures are funded; without them, Option B creates a fairer and more reliable outcome.”
Use geographical language precisely
Use terms such as distribution, accessibility, exposure, vulnerability, resilience, interdependence, sustainability, scale, stakeholder, trade-off, flow, pattern and process where they fit. Explain the term through the evidence. Avoid dropping specialist vocabulary into a sentence without showing what it means in the issue.
Use comparative language precisely: “higher than”, “concentrated in”, “increases from”, “declines towards”, “nearer to”, “downstream of” or “more accessible by public transport”. Give a value or named location if the source provides one. Avoid vague statements such as “many people” when the map or table supports a more exact comparison.
8. Time management in the examination
Follow the marks and time guidance provided by your teacher and current exam materials. Do not spend too long rewriting the resource booklet. Read the question verbs and underline the required task: describe, explain, assess, compare, evaluate or justify. Circle the place, issue, options and criteria in the question.
Use planning time to choose a judgement and organise evidence. A brief plan can list two criteria, one source for each option, one counterpoint and the conclusion. While writing, refer to source numbers or figure labels where relevant. Leave time to complete the judgement and check that every paragraph relates to the question.
If a source is unfamiliar, use what it actually shows. Identify location and scale; describe a pattern; connect it to a process you know; qualify the inference. Do not panic if the topic is new. The paper tests how you apply geographical knowledge and evidence, not whether you memorised that exact case before.
9. Practice issue: a fictional coastal transport proposal
The following scenario is invented for practice and does not describe a real proposal. A coastal town has seasonal congestion and limited public-transport access. A new bypass could move through farmland and near a wetland. A bus corridor could connect the town centre with a station, but would require funding and changes to parking. A third option is to manage traffic and improve walking routes without new major infrastructure.
Build the evidence questions
Before deciding, ask what evidence is available or missing:
- Where do traffic queues occur, at what times and in which season?
- Which residents rely on cars, buses, walking or cycling, and why?
- Is the wetland protected, flood-prone or important for water quality?
- How many jobs or services are difficult to reach without a car?
- What are the construction, operating and maintenance costs?
- How might induced demand change traffic after a bypass opens?
- Could parking management or bus frequency change travel choices?
- What are the baseline levels of air pollution, noise and habitat condition?
These questions identify where a proposal has uncertainty. If the booklet gives a traffic forecast but no method, explain that its reliability is uncertain. If a habitat map shows a wetland, identify the likely physical processes and potential impacts but do not invent species data. If a resident survey includes only a small sample, state that it may not represent the whole town.
Compare the options
The bypass could reduce through-traffic in the town centre and improve freight movement. It could also increase road capacity, generate new traffic, occupy farmland, affect wetland flows and encourage development at the town edge. Its benefits and costs may differ between drivers, local shops, farmers and wildlife.
The bus corridor could improve access for people without cars and connect the town to rail. It may reduce some car trips if services are frequent, affordable and reliable. It needs ongoing funding, suitable routes, accessible stops and enough demand. Changes to parking can affect local businesses and residents differently.
Traffic management and walking improvements may cost less and deliver more quickly. They could reduce short trips by car and improve safety, but might not solve freight congestion or journeys from remote settlements. The option could be combined with the bus corridor or targeted to areas with the highest conflict.
Reach a reasoned decision
A defensible judgement depends on the evidence and the main objective. If congestion is caused mainly by through-freight and the wetland impact can be avoided or mitigated, a bypass may be justified. If the issue is unequal access to jobs and services, a reliable bus corridor may perform better. If most trips are short and local, traffic management and walking improvements could be more proportionate. A combined approach may be strongest if funding and delivery capacity permit.
The point is not that one option is always correct. The student must use source evidence, connect it to geographical processes, account for stakeholders and explain why the chosen criteria matter. An answer that acknowledges uncertainty can still make a clear decision.
10. Practice issue: managing flood risk in a fictional river town
This scenario is also invented. A town beside a river has experienced more frequent surface-water and river flooding. The local authority is considering a higher embankment, a restored floodplain upstream, or property-level protection and revised planning rules. The town centre has shops and a hospital; upstream land includes farms; downstream communities also rely on the river.
Define the problem before choosing a measure
First distinguish the flood sources. River flooding occurs when channel flow exceeds capacity and water spreads onto the floodplain. Surface-water flooding can occur when intense rainfall overwhelms drainage, especially where impermeable surfaces limit infiltration. Both may happen in one storm. The options therefore need to be matched to the relevant processes rather than treated as interchangeable.
Locate the most exposed areas and identify who lives or works there. A map of flood zones may show probability categories, but it does not reveal whether a building has flood barriers, whether residents can evacuate or whether the hospital has backup power. A photograph after a flood shows damage at one time; a long-term gauge record is better for trends but may not represent future climate. Use several resources together.
Compare hard engineering and natural storage
An embankment can raise channel capacity and protect selected properties during floods below its design threshold. It may require land, construction work and inspection; if it fails or is overtopped, floodwater can arrive quickly. It can also transfer risk downstream by speeding or constraining flow. Check whether the design includes the whole reach and who is responsible for maintenance.
Floodplain restoration can give water more space upstream, slow flows and provide wetland habitat. It may reduce peak discharge downstream if the restored area is large and connected to the floodplain. Farmers may lose some productive land or need compensation; a single restored site may not prevent flooding from an extreme event or surface-water runoff. Evidence should include storage capacity, location and expected flow change.
Property-level protection and planning rules can reduce damage and future exposure. Flood doors, raised electrical systems and safe evacuation plans may protect households; planning restrictions can prevent new buildings in high-risk areas. These measures may be more targeted and less disruptive than a large structure, but require household awareness, finance, enforcement and support for vulnerable residents. They reduce consequences more than the probability of flooding.
Evaluate distribution and timescale
An embankment may protect high-value town-centre assets quickly, while farm households upstream face construction effects. Floodplain restoration may create long-term environmental benefits but require negotiation and time. Property protection can help individual buildings but may be inaccessible to renters or low-income residents. A fair plan could combine upstream storage, targeted defences, early warnings and property adaptation.
The decision should consider not only total expected damage but also where risk moves. Ask whether the scheme changes water levels downstream, whether residents have an evacuation route, whether emergency services can reach the hospital, and whether flood insurance remains affordable. No option removes all risk; good planning makes residual risk visible and prepares communities to respond.
11. Worked response plan and evidence use
Suppose the question asks: “Assess which option would be most effective in reducing flood impacts on the town.” A short plan might be:
| Paragraph | Main point | Evidence to select | Evaluation |
|---|---|---|---|
| 1 | Establish which areas and assets are exposed | Flood map, hospital/centre location, population | Map scale and probability definition |
| 2 | Assess embankment | Design height, protected locations, cost | Overtopping and downstream risk |
| 3 | Assess floodplain restoration | Area, storage, flow evidence, land use | Delay, farmer costs and extreme events |
| 4 | Assess property protection/planning | Building count, vulnerability, access | Unequal ability to pay and future development |
| 5 | Decide and justify | Strongest evidence across sources | Conditions, uncertainty and combined measures |
The plan does not dictate the final choice; it ensures that every option receives evidence-based consideration. If the booklet shows the hospital inside the highest-risk zone and restoration far upstream, the relationship between location and timing matters. If the map shows new housing planned within the floodplain, planning controls may be essential even if a defence is built.
Calculations that can support evaluation
If a source gives costs and benefits, calculate differences only when units and periods match. A one-off construction cost cannot be compared directly with one year of avoided damage without considering project life, maintenance and discounting assumptions. If a survey says a certain number of people support an option, calculate a percentage only if the sample size is supplied and representative enough for the claim.
Percentage change can be calculated as:
percentage change = (new value − original value) ÷ original value × 100
State whether the result is an increase or decrease and give the period. Avoid false precision: an estimate derived from approximate figures should not be reported to multiple decimal places. A calculation supports an argument only if the interpretation is relevant to the decision.
A model evaluative paragraph
“Restoring the floodplain upstream could reduce peak river flow by giving floodwater additional storage before it reaches the town. The map places the restored area above the hospital and residential centre, so the location is relevant to the assets at risk. However, the forecast applies to a specified storm and does not show that surface-water flooding would fall. Farmers could lose productive land, while the scheme would take time to establish. Restoration is therefore a strong long-term measure if the flow model is reliable and landowners receive fair support, but it should be combined with property protection and an emergency plan for events beyond the forecast.”
This paragraph refers to evidence, explains a physical process, considers a stakeholder and reaches a conditional judgement. Replace the example details with the evidence actually provided in the examination booklet.
12. Common errors and how to improve them
| Common error | How to improve |
|---|---|
| Choosing an option before interpreting sources | Extract evidence for every option first, then compare. |
| Copying a quotation without explaining it | Paraphrase the viewpoint and explain its geographical significance. |
| Treating a forecast as certain | State the assumptions or uncertainty and consider another outcome. |
| Listing stakeholders but not their interests | Explain who gains or loses, where and over what period. |
| Discussing only construction impacts | Compare short-term disruption with operation, maintenance and closure. |
| Using a national statistic for a neighbourhood | Match the scale of the data to the claim. |
| Assuming economic growth benefits all residents | Consider distribution, employment quality, affordability and displacement. |
| Giving a conclusion with no criteria | State why the chosen criteria matter and how options compare. |
| Ignoring no action | Explain what existing trends or risks would continue. |
| Claiming correlation proves cause | Identify other possible explanations or evidence needed. |
13. Triangulate sources and test claims
Triangulation means checking a claim against more than one kind of evidence. If a developer states that a project will create jobs, compare the claim with employment estimates, the project’s construction timeline and evidence about similar schemes. If a resident reports flooding, compare the location with flood maps, rainfall records and infrastructure plans. Different sources may answer different parts of the question.
Sources can agree for different reasons. A map and a photograph may both indicate settlement near a river, but they do not independently prove flood frequency. A policy document and a developer’s brochure may repeat the same forecast. Two sources are not automatically independent because they have different formats; ask where their information came from.
Check whether evidence is relevant, reliable, representative, current and at the correct scale. A survey can be reliable about the respondents’ views but not representative of all residents. A scientific reading can be accurate at one monitoring point but not describe a whole catchment. A recent statistic may use a different definition from an older one. A detailed case study can explain a process but may not generalise to the new location.
Separate fact, forecast and viewpoint
- Observed fact: a measurement or recorded event, with date, method and location.
- Estimate: a value inferred where direct measurement is incomplete.
- Forecast: a modelled future under stated assumptions.
- Target: an intended result, not an achieved result.
- Viewpoint: a person’s or organisation’s position, experience or interpretation.
These categories can appear in the same source. A planning document may include current traffic counts, forecast traffic after construction and a target for job creation. Label the difference in your reasoning. A target can show policy intent; it cannot prove the outcome will occur.
Use counter-evidence fairly
Counter-evidence is information that complicates or challenges a claim. If an option is forecast to reduce travel time, ask whether the forecast includes induced traffic or only initial conditions. If a project promises new jobs, ask whether the jobs are temporary or permanent, local or imported, and what training is available. Counter-evidence should be relevant and evidenced; do not invent a weakness simply to sound balanced.
Decide how much weight to give evidence
Evidence deserves greater weight when it is directly relevant, measured with a clear method, current enough for the decision, representative of affected places and supported by independent sources. Give less weight to broad promises, unverified claims or a single anecdote when the question concerns a whole region. A small sample can still be valuable for lived experience; explain what it reveals and what it cannot establish.
The final choice should reflect both evidence strength and the seriousness of possible impacts. A low-probability hazard with severe irreversible consequences may deserve more attention than a frequent minor inconvenience. A forecast with uncertainty may support a cautious or phased option, monitoring and review. Explain the reasoning behind the weight you assign.
Turn incomplete evidence into a practical decision
An examination booklet cannot contain every fact a planner would want. Treat missing information as uncertainty to manage, not as permission to invent a number. You can still compare the options using the evidence available, state how a missing fact could change the decision, and suggest a proportionate next step. For example, if a map shows a proposed road close to a wetland but gives no species survey, explain that the location creates a plausible ecological risk and recommend a seasonal survey before approval. Do not claim that a protected species is definitely present.
Monitoring can make a decision more adaptable. A flood scheme could record water levels before and after construction; a new transport route could monitor traffic, journey times and air quality; a tourism project could track seasonal employment and pressure on habitats. Useful monitoring names an indicator, a location, a time interval and a trigger for review. “Monitor the impact” is too vague. A trigger might be a measured rise above a baseline or a failure to meet an agreed target, though in an exam you should only propose a numerical threshold when the evidence supports it.
Some choices can be staged. A pilot or phased scheme can test demand, reveal local impacts and allow changes before the full investment. Staging may cost more or delay benefits, so compare those costs with the value of learning under uncertainty. It is especially useful when effects are difficult to reverse, evidence is weak or residents have raised concerns. If delay would expose people to immediate serious risk, however, waiting also has a cost. State who carries that risk while further information is collected.
An evaluative answer can therefore recommend an option with conditions: identify the preferred measure, explain the evidence supporting it, name the safeguard or information needed, and say what should happen if monitoring reveals harm. This is a definite geographical judgement because it explains both the decision and how its uncertainty would be handled.
Self-check
- What information should you record for each source in the pre-release booklet?
- How can a map show an issue at one scale but hide local differences?
- Why is a stakeholder quotation useful but not automatically representative?
- Give three criteria that could be used to compare options.
- How can a physical process and human decision interact in one issue?
- What makes a final judgement reasoned and geographical?
- How would you explain uncertainty without avoiding a decision?
- Why should short-term and long-term effects be assessed separately?
Revision points
Practise locating an issue, inventorying sources, interpreting evidence, explaining physical-human links, identifying stakeholders, comparing options and justifying a decision. Keep claims tied to a source and a scale. Weigh effects on people and the physical environment, state uncertainty clearly and make the final choice explicit.
Place example
The pre-release issue can relate to compulsory physical or human content and may use an unfamiliar context. Practise with planning proposals, resource conflicts or hazard-management choices, but do not assume which issue will appear.
Maps, data and evidence
Cross-check maps, graphs, photographs, statistics and quotations. A graph axis can distort visual differences; a stakeholder quote reveals perspective, not necessarily a representative fact.
Common misconception
A conclusion is not justified merely because it is the most popular option. Evidence can be incomplete or conflicting; state how that affects confidence.
Self-check
- Which source best supports each claim, and what are its limits?
- Who gains or loses under each option?
- What criteria support your final decision?
Revision points
Use claim → evidence → explanation → counterpoint → judgement. Make the final choice explicit and justify it with more than one criterion and scale.
Curriculum alignment
- Curriculum coverage IDs:
aqa.3.3.1.issue-evaluation - Related practice packs:
gcse_geo_p3_geographical_applications_june_2022,gcse_geo_p3_geographical_applications_june_2023,gcse_geo_p3_geographical_applications_june_2024,gcse_geo_p3_geographical_applications_november_2020,gcse_geo_p3_geographical_applications_november_2021 - Shared concept tags:
issue-evaluation,decision-making,evidence,stakeholders
Sources
- Curriculum/specification: https://www.aqa.org.uk/subjects/geography/gcse/geography-8035/specification/subject-content/geographical-applications
- For case-study facts, use the source list and figures selected by your teacher; dates, totals and local conditions can change between datasets.