 FoxChild@Learn
20. Fieldwork and geographical enquiry
Curriculum status: Required core content.
This guide follows AQA GCSE Geography 8035. Named examples below are suggested teaching examples where the specification allows a school choice; use your teacher’s selected case study and verify current figures before an assessment.
Required knowledge
- Complete two enquiries with primary data collected outside the classroom and school grounds on at least two occasions.
- Use contrasting environments and show understanding of human and physical geography; at least one enquiry must examine their interaction.
- Plan, sample, record, present, analyse, conclude and evaluate data and methods.
Key vocabulary
| Term | Meaning |
|---|---|
| hypothesis | testable proposed relationship |
| primary data | collected first-hand for the enquiry |
| sampling frame | set of units from which a sample is drawn |
| systematic sampling | regular interval selection |
| reliability | consistency of a measurement or method |
| validity | whether evidence addresses the question |
How the geography works
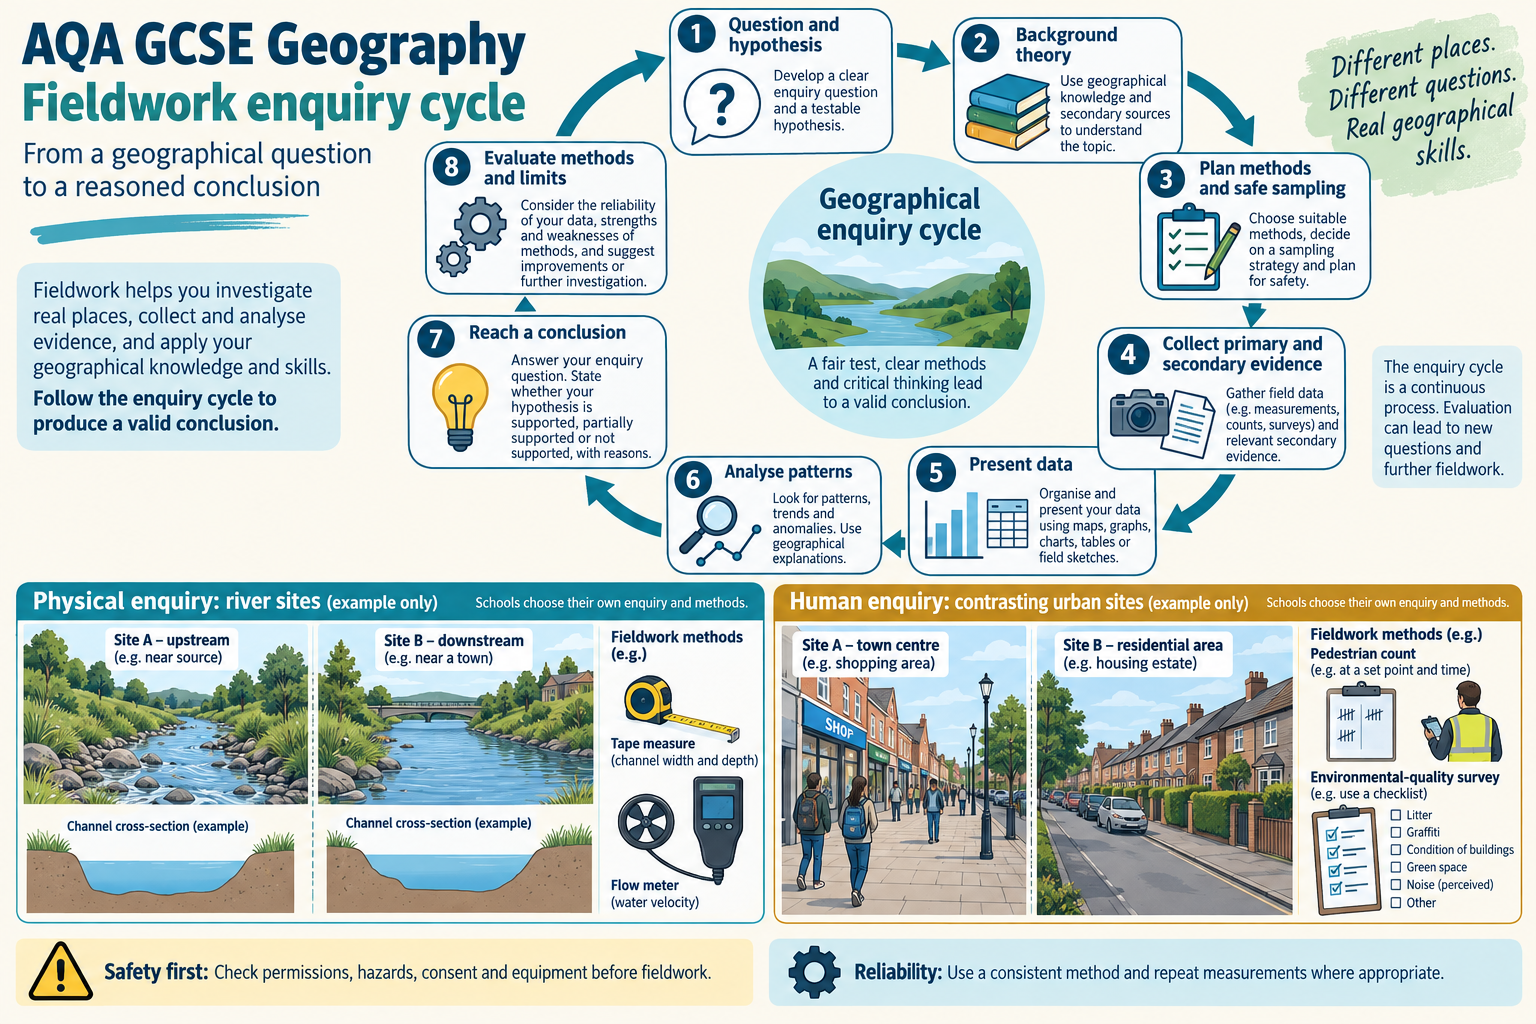
A fieldwork enquiry moves from question and theory to method, safe collection, presentation, analysis, conclusion and evaluation. Choose variables that operationalise the question; use consistent sampling and recording. Identify anomalies, link datasets and use suitable statistics without overstating what a small sample proves.
1. AQA’s fieldwork requirement
AQA GCSE Geography 8035 requires two geographical enquiries, each using primary data collected during fieldwork outside the classroom and school grounds on at least two occasions. The enquiries should take place in contrasting environments and demonstrate understanding of both physical and human geography. At least one enquiry must show an interaction between physical and human geography.
Fieldwork is assessed through questions using unfamiliar fieldwork materials and questions about students’ own enquiry work. Students identify the titles of their individual enquiries. This means you need to understand your own methods, results, conclusions and limitations, but also practise applying the enquiry process to a context you have not visited.
The enquiry should relate to geographical theory or a course concept. A field trip is not automatically an enquiry: it needs a clear question, a justified method, systematic data collection, analysis, a conclusion and evaluation. Each choice should help answer the question.
2. The enquiry cycle
Stage 1: Ask a geographical question
A useful question is geographically located, answerable with evidence and narrow enough to investigate. It identifies a place or transect, a process or relationship, and the data needed. Examples include:
- How does channel width vary downstream along a named river reach?
- How does environmental quality vary between the centre and edge of a town?
- Is there an association between distance from the central business district and land use?
- How does pedestrian flow vary between two streets at different times?
- How do building density and surface cover relate to observed runoff risk?
Questions such as “Is the river interesting?” or “Is the town sustainable?” are too broad or subjective. A question can be adapted to the site, access, time available and safety requirements. The place name and scale should be specific enough that another student could understand where the data were collected.
Stage 2: Develop a hypothesis or sub-questions
A hypothesis is a proposed relationship that can be tested. It should name the variables and predict a pattern. For example, “Channel width increases downstream along the study reach” predicts a measurable change in width with distance. A human geography hypothesis might be “Pedestrian counts are higher in the town centre than at the suburban shopping area during the sampled weekday period.”
Not every enquiry needs one formal hypothesis. Sub-questions can break a complex issue into parts, such as how land use, traffic and environmental quality vary along an urban transect. The question should guide what is measured; avoid collecting lots of interesting data that do not help answer it.
Stage 3: Establish geographical theory
Theory explains why a pattern might occur. In a river enquiry, discharge may increase downstream as tributaries add water; channel dimensions may adjust to the flow, but local geology, engineering and land use can alter the pattern. In an urban enquiry, accessibility, land value, planning, transport and function may influence land use or pedestrian flow. Theory provides an explanation to test rather than a conclusion to assume.
Stage 4: Plan methods, sampling and safety
Choose appropriate data and sampling, prepare recording sheets, identify equipment and sites, assess hazards, obtain permissions and plan how results will be processed. Consider time, tide or weather, access, group size, accessibility and the effect of the fieldwork on other people or the environment.
Stage 5: Collect primary and secondary evidence
Primary data are collected first-hand for the enquiry, such as a river width, environmental quality score, traffic count or interview response. Secondary data were collected by someone else, such as census data, a rainfall record, a map, a planning document or a published survey. Secondary evidence can add context and comparison; it does not replace AQA’s requirement for primary data in both enquiries.
Stage 6: Present and process data
Select methods suited to the data type and question. Use clear titles, labels, units, legends, scale and locations. Calculate suitable statistics carefully and record working so that results can be checked.
Stage 7: Analyse and explain
Describe the pattern, use numerical evidence, compare datasets and explain relationships through geographical theory. Identify anomalies and consider whether they represent a real local difference, measurement error or an unusual condition.
Stage 8: Conclude and evaluate
Answer the original question using evidence, state how strongly the data support the hypothesis and explain uncertainty. Evaluate the method and reliability of the conclusion, then suggest specific improvements or additional data.
3. Designing a testable question
Define the variables
An independent variable is the factor expected to change or the position along a transect; a dependent variable is what is measured in response. In a river investigation, distance downstream might be the independent variable and channel width the dependent variable. In a town, distance from the centre could be compared with percentage of retail land use or a pedestrian count.
Some studies compare categories rather than a continuous variable. A comparison of two neighbourhoods might examine environmental quality scores, traffic and land use. Define each variable so everyone in the group records it in the same way. “Busy” needs an operational definition, such as number of pedestrians passing a fixed point during a ten-minute period.
Operationalise subjective concepts
Concepts such as environmental quality, deprivation, accessibility and sustainability are broad. Choose indicators that represent the part of the concept you are investigating. Environmental quality might use noise, litter, traffic, greenery and building condition, each scored with a clearly defined scale. Accessibility might consider walking distance, route barriers, service frequency and step-free access.
An indicator is not the whole concept. A high environmental-quality score does not prove all residents are healthy or satisfied. State what the indicator captures and what it leaves out. Using several indicators can give a fuller picture, but only if the enquiry has time to measure them consistently.
Define the study area and scale
Choose a site where the process can be observed safely and where measurements answer the question. For a river, define the start and end points of the reach and note tributaries, bridges, weirs or channel modifications. For an urban transect, define the route and the points or sections to be sampled. A site selection based only on convenience can bias results; explain why the selected area is suitable.
Scale affects what can be concluded. A few measurements along one reach may describe that reach but not every river. A set of shops on one street may not represent an entire city. Use a precise conclusion such as “In the sampled section…” unless the sample supports a broader inference.
4. Sampling methods
Sampling selects a manageable number of observations from a larger area or population. Good sampling aims to represent the variation relevant to the question and reduce bias. It does not guarantee perfect representation; justify the method and record how it was used.
Random sampling
In random sampling, each unit in a defined sampling frame has a known chance of selection. A grid over an area can be used to generate random coordinates. Random sampling can reduce deliberate selection bias, but may miss small subgroups or clusters, especially if the sample is small. It can also be impractical where some locations are inaccessible or unsafe.
Systematic sampling
Systematic sampling selects observations at regular intervals, such as every 50 metres along a transect or every tenth person passing a point. It is simple and creates even spatial coverage. It may produce a biased pattern if the interval matches a repeating pattern in the area. Start points should be chosen fairly, and intervals should be consistent.
Stratified sampling
Stratified sampling divides a population into relevant groups—such as land-use zones or neighbourhood types—and samples each group, often in proportion to its size. It can ensure smaller but important groups are represented. It requires reliable information about the strata and takes more planning. If group boundaries are subjective, the classification itself can introduce bias.
Opportunity sampling
Opportunity or convenience sampling uses people or sites that are easiest to reach. It may be practical in limited time, but can over-represent people who are present, available or willing to respond. A survey outside one shop at lunchtime may not represent residents, workers and visitors across the day. Acknowledge the limitation rather than describing the result as fully representative.
Sample size and representation
A larger sample can reveal more variation and make an average less sensitive to one observation, but only if measurements are relevant and consistently collected. A very large biased sample remains biased. Consider the number of sites, observations at each site, time periods and groups represented. State the sample size so the reader can judge its strength.
For changing conditions, repeat measurements at several locations and times. A traffic count collected once may reflect an unusual event; multiple time periods can reveal variation. Fieldwork constraints are real, so explain what the sample can and cannot establish.
5. Risk assessment, ethics and environmental care
Fieldwork should be planned to protect students, the public and the environment. Follow school procedures, teacher instructions, land-access rules and local guidance. A risk assessment identifies hazards, who may be harmed, likelihood and severity, and control measures. Risk assessment is not a paperwork exercise; it should change where, when and how data are collected.
Common fieldwork hazards
- Rivers and coasts: deep or fast water, slippery banks, tides, waves and unstable ground. Stay in designated safe areas; do not enter water unless the school has explicitly planned and authorised a method with suitable controls.
- Roads and urban sites: traffic, crossings, crowded pavements and construction. Use safe crossings, stand clear of vehicles, work in groups and keep equipment out of the route.
- Weather and terrain: heat, cold, rain, lightning, steep slopes, mud and dehydration. Check forecasts, clothing, footwear, water, shelter and cancellation criteria.
- Equipment: sharp tools, probes, tripods, tapes and electrical devices. Receive instructions, check equipment and carry it safely.
- People and property: conflict, trespass, privacy concerns and disruption. Obtain permission, explain the study, avoid blocking access and follow school supervision rules.
Ethical data collection
Participation in a questionnaire or interview should be voluntary and informed. Explain the purpose, avoid pressuring respondents, allow them to decline and do not collect unnecessary personal information. Do not record names or sensitive data unless the school has authorised a safe method and there is a clear reason. Store information securely and report it in a way that does not identify individuals.
Ask neutral questions. Leading wording can push respondents toward an answer. Avoid questions that could stigmatise a neighbourhood or group. If taking photographs, follow school rules, respect privacy and avoid identifying people without consent. Do not assume that a visible feature reveals a person’s income, health or background.
Environmental responsibility
Do not damage habitats, remove organisms, disturb wildlife or leave litter. Minimise trampling, stay on authorised routes and avoid contaminating water. Return equipment and samples as instructed. A fieldwork project should observe a place without creating the impact it is studying.
6. Collecting primary data
The method must fit the question, variable, place and available time. Record data at the time of collection, include units and location, and use the same method at each site. Pilot a method where possible: a short trial can reveal unclear scales, equipment problems or missing categories.
Physical geography methods
River channel measurements
A river enquiry may record channel width, depth, wetted perimeter, velocity, bedload size, gradient, discharge, bank material or channel shape. Measurements should be taken at clearly defined cross-sections and with equipment suited to the variable. A tape can measure width across a safe section; depth readings can be taken at consistent intervals using a metre rule from an authorised position; flow velocity may be estimated using a float over a measured distance when safe and permitted.
Discharge is the volume of water passing a cross-section per unit time. A simplified estimate can be calculated as:
discharge = cross-sectional area × mean velocity
The channel is not a perfect rectangle, so divide a cross-section into smaller sections to estimate area more accurately. Measure velocity at several points because it varies across the channel and with depth. A float at the surface moves differently from the average water flow; record the method and limitation.
Coastal fieldwork
At a coast, students might record beach profiles, sediment size and shape, pebble orientation, groyne effects, land use or evidence of erosion and deposition. Transects should be located consistently, and measurements should be repeated at suitable intervals. Tide, wave conditions, recent storms and management structures can affect the result. Work only in safe areas and follow tide and weather plans.
Weather and microclimate
Temperature, wind, cloud, shade and surface type can be compared between locations. Use the same instrument, height, exposure and time interval. A handheld thermometer in direct sun is not comparable with one in shade; note the setting. A short fieldwork period describes conditions during that period, not a full seasonal climate.
Biophysical and environmental quality
Vegetation cover, habitat features, litter, noise or water conditions can be observed using defined categories. Some measurements are objective; others involve judgement. Create a clear scale with examples for each score and train the group to use it consistently. Separate what was directly observed from an interpretation.
Human geography methods
Land-use survey
Classify the dominant ground-floor use or land use at set points or plots. Categories should be mutually clear—for example retail, residential, office, leisure, public service, transport or vacant. Decide how to code mixed uses. A map can display categories along a transect; a tally or percentage can compare zones. Land use changes with time, so note the date and time of observation.
Pedestrian and traffic counts
Choose a fixed counting line and time period. Count people or vehicles by category over a set duration, such as five or ten minutes. Repeat at different times or locations if the question concerns spatial or temporal variation. Avoid counting the same person twice. Note weather, school times, roadworks or events that could affect a count. A count estimates movement during the sample, not total daily use.
Environmental quality survey
Select indicators such as noise, litter, greenery, building condition, traffic and maintenance. Define a score scale and use it consistently. If one person’s “quiet” is another’s “noisy,” the score is subjective; several observers can score the same site and compare differences. Avoid combining all indicators into one total without considering their importance or scale.
Questionnaires and interviews
Questionnaires can gather comparable responses; interviews can give more detailed explanations. Use open questions to explore reasons and closed questions for consistent categories. Avoid leading, double-barrelled or overly technical wording. Pilot questions and ensure the sample includes relevant groups. Responses reflect memory, interpretation and willingness to participate; do not assume they are objective measurements of the whole population.
Environmental perception and place
People experience places differently based on age, mobility, identity, work, safety and familiarity. A place-perception survey can record how respondents evaluate a location, but it should not present one group’s view as universal. Combine perceptions with observable conditions such as crossing facilities, lighting, green space or traffic if the question requires explanation.
7. Use secondary data to support the enquiry
Secondary data can establish context and compare field observations with longer-term patterns. Possible sources include OS and thematic maps, census data, local plans, traffic records, river-flow gauges, rainfall records, environmental assessments, satellite images, historical photographs and published research.
Record source, date, location, definition and scale. A council transport plan may describe planned improvements rather than completed works. A census reflects a specific date and method. A river gauge may be some distance from the field site. Satellite classification can misidentify land cover. Explain how the secondary source supports or limits the conclusion.
Primary and secondary data can be triangulated. A traffic count provides a short local snapshot; a council dataset may show seasonal or annual change. An environmental quality score records field observations; a resident survey describes lived experience. Agreement increases confidence, while disagreement may reveal different scales, timings or definitions.
8. Data recording and field notes
Use a recording sheet that captures site, date, time, units, method, sample number and observer. Define each code before collection. Leave space for anomalies and field notes such as weather, flow conditions, roadworks, tide state, unusual events or access restrictions. Record a zero accurately; do not leave a blank that could mean either zero or missing data.
Use consistent precision. If a tape is marked to centimetres, do not report a measurement to tenths of a millimetre. If a score is qualitative, do not imply greater precision by calculating several decimal places. Keep original records safe and make a working copy before processing.
Sketch maps can show sampling points, transects, land uses, flow direction and field observations. Include a title, north arrow, key, scale or reference features and labels. A field sketch should select and communicate relevant features rather than copy every detail.
9. Present fieldwork data
Choose a presentation method that suits the data and question. Label axes, categories, units, sample size, date and location. Give a title that states what is shown. Use a sensible scale that displays variation without exaggerating it.
| Data type or question | Possible presentation | Why it may fit |
|---|---|---|
| Continuous change along a transect | Line graph or profile | Shows a spatial trend between ordered locations |
| Categories at different sites | Bar chart | Makes discrete categories easy to compare |
| Share of a whole | Pie chart or divided bar | Shows proportions when categories sum to a meaningful total |
| Frequency distribution | Histogram | Shows grouped continuous measurements using class intervals |
| Relationship between two variables | Scattergraph | Shows association, clusters and possible outliers |
| Spatial variation | Choropleth, proportional symbols or dot map | Shows geographic distribution using a clear key |
| Direction and volume of movement | Flow-line or desire-line map | Shows movement between origin and destination |
| Ordered river/coast profile | Cross-section or transect | Shows change in height or shape across a measured line |
Do not use a pie chart for values that do not make a whole; do not use a line graph for unordered categories; do not hide missing data. A graph is a communication tool, not proof of the explanation.
Cartographic presentation
Use a choropleth map for data measured by area, such as a rate per district, and consider how boundaries and class intervals affect appearance. Use proportional symbols for totals at points, flow lines for movement and isolines for continuous values. A dot map can show counts or distribution if each dot has a defined value. Legends should explain symbols and classes clearly.
Graph construction checks
- Place the independent variable on the horizontal axis where appropriate.
- Label both axes with quantity and unit.
- Choose regular intervals and a scale that uses the graph space well.
- Plot points accurately and distinguish measured values from estimated lines.
- Include a key if multiple datasets are shown.
- Use class intervals consistently in a histogram.
- Do not connect discrete categories as if values between them were measured.
10. Analyse and explain results
Begin with an overall pattern, then support it with selected values. State whether a variable increases, decreases, fluctuates, clusters or has no clear trend. Compare sites or groups and identify the range. Avoid listing every value without explaining what the pattern means.
Link results to geographical theory. If channel width generally increases downstream, explain how tributaries and discharge may contribute, then consider local structures or geology. If retail land use is more frequent near the centre, discuss accessibility, land values and urban function, while recognising that planning and historic development may alter the pattern.
Measures of central tendency
The mean is the total of values divided by the number of values. It uses all observations but can be strongly affected by an extreme value. The median is the middle value after ordering data; for an even number of observations, average the two middle values. The mode is the most frequent value or category. Choose the measure that fits the data and explain why.
Measures of spread
The range is maximum minus minimum and is simple but sensitive to extremes. Quartiles divide ordered values into four parts. The interquartile range (IQR) is Q3 minus Q1 and describes the spread of the middle half of observations. Spread helps compare consistency: two transects can have the same median but different variation.
Percentages and change
Percentage change compares a difference with the starting value:
percentage change = (new value − original value) ÷ original value × 100
Use the correct time period and state whether the result is an increase or decrease. A difference of 10 vehicles is not the same relative change when counts start at 20 or 200. If sample sizes differ, raw totals may not be comparable; use a rate or proportion where appropriate.
Correlation and scattergraphs
A scattergraph can show positive, negative or no apparent association. A line of best fit summarises a trend but does not pass through every point. Identify clusters and anomalies and consider whether they reflect subgroups, measurement errors or local conditions. Correlation does not prove one variable caused the other. A third factor may influence both.
Interpolate within the observed data range cautiously. Extrapolating beyond it is less reliable because the relationship may change. Predictions should be described as estimates and explained with relevant limits.
Anomalies and outliers
An anomaly is a value or location that differs from the general pattern. Do not remove it automatically. Check the original record, method, location and conditions. It might be a recording error, or it may reveal a meaningful local feature such as a bridge, weir, traffic signal, market, construction site or unusual land use. Explain whether it changes the overall conclusion.
11. Draw a conclusion
A conclusion should directly answer the original question or hypothesis. Summarise the pattern, cite evidence, explain geographical processes and state how strongly the data support the prediction. Include contradictory evidence or anomalies where they matter. A conclusion should not claim more than the sample can show.
For example: “Channel width generally increased across the sampled downstream sites, from the first cross-section to the final one. This is consistent with the hypothesis and may reflect tributary inputs and increased discharge. However, a weir affected one site and the sample covers only one reach and one fieldwork period, so the pattern should not be generalised to the whole river.”
This conclusion is stronger than “the hypothesis was correct” because it gives evidence, process and limitations. It is also stronger than repeating the graph without answering why the pattern matters.
12. Evaluate methods and reliability
Reliability describes how consistent a method or result is when repeated under similar conditions. Validity asks whether the method measures what the question intends. Accuracy describes closeness to a true or accepted value; precision describes the fineness or repeatability of measurements. These terms are related but not interchangeable.
Sources of uncertainty
- Instrument: limited scale divisions, calibration error or faulty equipment.
- Observer: different judgement, reaction time, reading angle or category coding.
- Sampling: too few sites, uneven intervals or a biased sampling frame.
- Time: changing tide, weather, flow, traffic or activity during collection.
- Location: measurements made at different positions or under different conditions.
- Question wording: ambiguous, leading or misunderstood questions.
- Data processing: rounding, coding, class intervals or calculation errors.
- Access and safety: some sites or groups could not be included.
Improve the method specifically
An improvement should address a named limitation. If the channel depth readings varied between observers, use a marked staff and train the group to use the same cross-section positions. If a pedestrian count was collected only once, repeat it at several times and days. If a survey reached only shop owners, sample residents, workers and visitors. If an EQS was subjective, define each score and compare independent raters.
“Collect more data” is too vague. State where, when, how many, which groups or variables and how the new data would improve the conclusion. More data are useful only when they reduce a relevant uncertainty and can be collected consistently and safely.
Evaluate the whole enquiry
Consider the original question, theory, site selection, sampling, methods, presentation, analysis and conclusion. Did the method answer the question? Were contrasting environments meaningfully different? Did at least one enquiry reveal a human-physical interaction? Were primary data actually collected outside the school grounds? Did the conclusion recognise limits?
Also consider how the fieldwork might be repeated. Could another group follow the instructions and collect comparable data? Are the site locations, timings, units, scoring scales and sampling intervals recorded? Repeatability matters for confidence and for future comparison.
13. Enquiry design examples
These are model designs, not prescribed titles. Your own enquiry titles, sites and methods may differ.
Physical enquiry: how does a river channel vary downstream?
Question: How do width, depth, velocity and bedload size vary downstream along a safe study reach?
Theory: Tributaries can add water and discharge downstream; channel dimensions and sediment may change with flow, geology, land use and management. Local features such as weirs or bridges can alter the pattern.
Sampling: Select several cross-sections at measured intervals from upper to lower reach, with sites safely accessible. Use the same method at each section and record structures or tributaries. If a site cannot be reached, record the reason and avoid quietly replacing it with a different type of location.
Methods: Measure channel width at each cross-section, take depth readings at fixed intervals and estimate velocity using the same timing distance and float method where permitted. Measure bedload along a set line or use a systematic selection and record the intermediate axis. Record weather, flow conditions, channel modifications and uncertainty.
Presentation and analysis: Use line graphs for width/depth against downstream distance; plot bedload size separately; calculate range and median where appropriate; compare velocity and cross-sectional area to estimate discharge. Identify any local departure from the general pattern and consider how channel structures or tributaries explain it.
Limitations: One fieldwork period gives a snapshot; a float estimates surface speed; water depth can vary across a section; stones may be hard to sample randomly; a weir may create an anomaly. Repeat measurements, sample more cross-sections and use a flow meter or gauge where safe and available.
Human enquiry: how does land use change across a town transect?
Question: How does land use and environmental quality vary from the town centre towards a suburban edge?
Theory: Land values, accessibility, transport, historic development and planning influence urban land use. Retail and services may cluster centrally, while housing, industry or open space vary across the transect. Local redevelopment can alter the pattern.
Sampling: Define the route and sample regular points or street blocks. Choose a time period that can be completed safely. If sites are stratified by urban zone, describe how zones were defined and sample each consistently.
Methods: Record the dominant ground-floor land use at each point using a clear category list. Complete a structured EQS for noise, litter, green space, building condition and traffic. Count pedestrians at selected fixed points and use the same duration. Conduct a small voluntary survey if the question includes perceptions, with consent and neutral wording.
Presentation and analysis: Map land-use categories along the transect; use a bar chart for counts by category; plot EQS values against distance; compare median scores between zones; describe any variation by time. Explain patterns using accessibility and urban function while considering planning and redevelopment.
Limitations: Ground-floor use can be mixed; an EQS has subjective scores; one time period may miss daily or seasonal variation; a survey may over-represent available respondents. Pilot categories, train observers, repeat at different times and stratify the respondent sample where feasible.
Human-physical interaction enquiry
An enquiry about urban flood risk can combine physical surface observations with human land use. Record the percentage of impermeable cover, location of drains, slope direction, green space and visible water accumulation after rain. Compare sites with different development patterns. This can reveal how land cover may affect runoff, but one short observation cannot measure the full drainage capacity or prove that a particular land use caused a flood. Rainfall intensity, soil, maintenance and underground infrastructure also matter.
Another example is coastal tourism and erosion. Students could record visitor access, path condition, beach profile and management features at contrasting sites. They should separate observed erosion evidence from the effect of visitor use and consider waves, geology, structures and seasonal differences. A human-physical enquiry is strongest when both processes are measured and their interaction is explained carefully.
14. Preparing your own enquiry notes
For each of your two enquiries, create a one-page record containing:
- exact title and question
- aim and geographical theory
- site location and a labelled sketch or map
- variables and the reason for each method
- sampling approach, sample size and timing
- fieldwork safety and ethical controls
- results pattern and two or three precise values
- presentation and statistical techniques used
- conclusion linked to the original question
- anomalies, limitations and specific improvements
Do not memorise only the final conclusion. Assessment questions may ask why a method was suitable, how the data could be improved, what an unfamiliar graph shows or how reliable a conclusion is. Knowing the full enquiry lets you answer those variations.
15. Questions based on unfamiliar fieldwork
An unfamiliar fieldwork question gives maps, images, data or methods from a context you may not have studied. Use the same enquiry logic:
- Read the question and identify what variable or relationship is being tested.
- Examine the source title, location, units, sample and date.
- Describe a pattern using evidence.
- Apply relevant physical or human geography theory.
- Identify a limitation or alternative explanation.
- Suggest a method or improvement that directly addresses the question.
If a graph shows values at three sites, use the actual values and site order. If a photograph shows a river, do not infer depth or water quality unless the evidence supports it. If a table records respondents’ views, describe them as survey responses rather than the opinion of everyone in the area.
16. Worked method review: a fictional river transect
The values below are invented for practice. Imagine a class measures channel width at five sites, recording distance downstream and three depth readings at each site. The question is whether channel width increases downstream.
Check the method before analysing
Confirm that each width was measured between the same channel boundaries. If one site uses the water surface and another uses bankfull width, the values are not comparable. Check the tape was held straight across the channel and the reading point was agreed. For depth, use the same vertical point and measure from the water surface to the bed. Note if a bridge, weir or tributary occurs near a sample point.
The sites should cover the reach at planned intervals, not only places that are easy to stand. Three depth readings at a site may capture cross-channel variation better than one, but their placement should be consistent, such as left, centre and right portions of the channel. If a site is unsafe or inaccessible, record the reason and explain the change to the sampling design.
Choose a summary statistic
Suppose one cross-section has depth readings of 18 cm, 21 cm and 23 cm. The mean is 20.7 cm, while the median is 21 cm. The two summaries are close because no reading is extreme. If the readings were 18 cm, 21 cm and 65 cm due to a deep pool or measurement error, the mean would rise sharply while the median would remain 21 cm. The unusual value should be checked rather than removed automatically.
If the question is about typical depth, a median can be robust to local pools. If the question concerns total flow, the cross-sectional shape and distribution of depth matter, so a median alone is insufficient. Statistics must match the geographical question.
Describe and explain a pattern
If width rises from 2.4 m at the upstream site to 5.1 m at the downstream site, state both values and the direction of change. Then examine the intermediate sites for a steady increase, fluctuation or anomaly. A tributary may add water and flow; local bank material or human structures may create a departure. Do not say discharge caused the width increase unless the data and theory support the link and other factors are considered.
Write a bounded conclusion
“Width increased overall across the sampled reach, from 2.4 m upstream to 5.1 m downstream, which supports the hypothesis for these five sites. The rise was not perfectly uniform; the site near the weir was narrower than the adjacent measurement. This may reflect channel management or a local cross-section, but the small sample and one fieldwork period do not establish the pattern for the entire river.”
This answer identifies a trend, uses figures, notes an anomaly and limits the claim to the evidence. That is the right balance between making a conclusion and recognising uncertainty.
17. Repeat visits and contrasting environments
Two enquiries should use contrasting environments in a meaningful geographical sense. This could mean a physical river setting and a human urban setting; a high-density centre and a lower-density edge; or two coastal sites with different management. Explain what contrasts and why the comparison helps address each question. Simply visiting two locations does not guarantee that they are contrasting.
At least one enquiry must consider an interaction between physical and human geography. For example, urban land cover may influence runoff; coastal defences can change sediment processes; river engineering can affect channel form and flood risk; tourism can affect erosion and habitat. Measure or observe both sides of the interaction and explain the mechanism. Do not infer a causal link from two variables changing together without considering other factors.
Fieldwork takes place on at least two occasions outside the classroom and school grounds. The repeated occasions may support the two different enquiries or provide repeat data, according to the school’s plan. Repeating a measurement improves confidence when conditions are comparable; collecting data in different seasons can reveal variation but means that weather or activity changed too. Record the date, time and conditions so the comparison is interpretable.
For a time-sensitive investigation, plan comparable periods. A weekday morning count and a Saturday afternoon count may reflect different travel purposes. A river measured after rain cannot be compared directly with a dry-weather measurement without noting the flow conditions. Repetition helps distinguish a persistent spatial pattern from temporary variation, but it does not remove all uncertainty.
18. Statistics and relationship tests in fieldwork
Select statistics according to the data type, distribution and question. For a small number of sites, median and range may be clearer than a mean alone. Quartiles and IQR can compare spread between two locations. A cumulative-frequency curve can show how values are distributed and allow estimates of median or quartiles, if the data and sample size support it.
Percentage increase or decrease can compare change from a baseline, but check that the starting value is not zero and that units match. A rate such as pedestrians per ten minutes allows comparison across equal time periods; if durations differ, convert to a common time basis and state the calculation. Ratios can compare proportions, such as green space to built area, if the measurements use the same boundary.
A scattergraph can examine a relationship between two variables, such as distance from the centre and percentage of retail land use. Sketch a trend line only if the pattern supports one. A statistical association does not prove a process: land values, planning, transport and historic development could influence both distance and land use.
Some fieldwork courses use rank correlation to test whether two ranked variables show a relationship. If you use a test, check that it fits the data, understand the null hypothesis and interpret the result in plain language. A statistic does not replace a map or geographical explanation. A weak relationship may still reveal clusters or local exceptions that matter to the enquiry.
19. Communicate fieldwork clearly
A good fieldwork report lets another person follow the enquiry. Use a clear title, question, location map, method, results, analysis, conclusion and evaluation. Keep raw data separate from processed data and show a sample calculation. Include units, site labels, dates and a key. Explain any data that were missing or changed during collection.
Use photographs and sketches with captions that say where and when they were taken, what feature is relevant and what inference they support. Annotate features rather than writing generic descriptions. A field sketch may help show channel shape, land use, settlement or coastal management; it is not a substitute for measured data when the question requires measurement.
When presenting results to others, choose a format suited to the audience. A map can show where the pattern occurs; a graph can show how values change; a short written explanation can connect results to theory. Do not overload a map with decorative labels or combine variables that use incompatible units. Clear presentation helps the reader assess the evidence and the limits of the conclusion.
Design a recording sheet before leaving school
A well-designed sheet makes the method repeatable. Put the enquiry question and site at the top, then give each variable its own column with a unit or category definition. Include a site number, location, date, time, observer and relevant conditions. Leave enough space for raw observations and a separate notes column for unusual events. If a group is recording the same variable, agree how to use the scale before splitting up.
For example, an urban environmental-quality sheet could list fixed sites down the left and criteria across the top: litter, noise, traffic, green space and building condition. Define what scores 1, 3 and 5 mean, and whether a high score indicates better or worse quality. Record observations as well as the score: “few vehicles during a ten-minute count” is more transparent than a bare value. Avoid changing the scale half-way through because the first sites look different.
Pilot the sheet with one or two sites. Check that categories do not overlap, that the units are clear, and that the method can be completed safely in the available time. A pilot may show that a ten-minute count is too long for the route or that a “dominant land use” category does not work for mixed-use buildings. Amend the method before the main sample and note the change. If a method changes after data collection begins, record which observations used each version; otherwise apparent differences might be methodological.
Keep raw data and processing traceable
Write down original readings before calculating averages or drawing a graph. If a value looks unusual, mark it and investigate rather than quietly replacing it. Keep units throughout: centimetres should not be mixed with metres, and counts from different time intervals should not be compared as if they covered the same duration. A sample calculation shows how raw results became a processed value and allows another reader to check the arithmetic.
When several people collect data, compare a small number of observations taken independently at the same site. If their scores differ, discuss whether the definition is unclear, the equipment is being used inconsistently, or the feature itself varies. A calibration check or shared demonstration can improve consistency. Do not average incompatible readings until you understand why they differ.
Record missing data honestly. A blocked route, an unsafe bank or a faulty instrument can leave a gap. Do not fill it with a guess and present the guess as a measurement. Explain how the gap affects the analysis; if appropriate, repeat the measurement later or use a clearly labelled secondary source. A transparent small dataset is stronger than a complete-looking table that hides uncertainty.
Match precision to the instrument
Precision is the detail expressed by a measurement; accuracy is how close it is to the true value. A tape read to the nearest centimetre may be precise, but a sloping tape or poorly defined channel edge can still make it inaccurate. Record a realistic number of decimal places: do not report a river width as 4.837 metres if the tape and field conditions only support an estimate to the nearest 0.1 metre.
Repeat measurements can reveal variation and help detect mistakes. Calculate a mean only when repeated values measure the same thing under comparable conditions. A range of repeated velocity readings may describe real variation across a channel rather than instrument error. State whether you report the mean, median or individual measurements and why. More decimal places do not remove uncertainty.
Questionnaires and interviews
Use a questionnaire when the enquiry concerns people's views, choices or reported experiences. Begin with a short explanation of the purpose, make participation voluntary and avoid collecting names unless there is a clear, authorised reason. Questions should be relevant, neutral and understandable. “How often do you use this bus stop?” is clearer than “Do you agree the bus service is poor?” A closed response scale is quick to compare, while an open question may reveal an unexpected reason; a small enquiry can combine both.
Pilot questions with a few people who are not part of the final sample. Check that wording is interpreted as intended and that answer options cover likely responses without overlap. “Other” and “prefer not to say” may be needed. Avoid double questions such as “Is the street safe and clean?” because a respondent may think it is safe but not clean. Ask each idea separately.
Record how respondents were selected, the location, date, time, number approached and number who replied. A response rate can be calculated as completed responses divided by people approached, multiplied by 100. A low response rate or an opportunity sample limits representativeness. People willing to answer outside a shopping centre may not represent residents who are at work, at home or unable to access that location. State whose views are represented and whose may be missing.
Field sketches and annotated records
A field sketch can record the arrangement of landscape features from a fixed viewpoint. Draw the skyline and major shapes first, then add features relevant to the question: valley sides, channel, settlement, land use, transport or management. Keep relative positions credible and avoid filling the page with details that do not support the enquiry. Include viewpoint direction, date and a concise caption.
Annotations should connect observation to geographical meaning. For example, a note might identify a broad floodplain and explain that it provides space for overbank flow, while recording nearby buildings as assets potentially exposed during a flood. The sketch alone cannot show how often flooding occurs or how deep water becomes. Pair it with suitable measurements, maps or recorded events.
20. Check the quality of an enquiry before the conclusion
Before interpreting results, audit the dataset. Confirm that each row has a site, unit, date and method; check for impossible values, duplicated entries and missing observations. Compare repeated measurements and identify any method change. Keep a brief field diary for weather, tide, crowds, events, access problems, equipment faults and decisions made on site. Context can explain an outlier or warn you that two readings are not comparable.
Separate measurement uncertainty from natural variation. If several river depths differ at one cross-section, the variation may describe channel shape. If two people score the same location differently, observer judgement may be involved. If a pedestrian count changes between visits, the difference may reflect time of day, weather or a real change in use. Do not remove a value just because it makes the graph untidy; explain what you investigated and why you retained or excluded it.
Use a short method audit for each dataset:
- Validity: does this variable answer the question, or is it only a proxy?
- Reliability: would the same method produce similar results when repeated?
- Accuracy: were the instrument, position and units suitable?
- Representativeness: do the sites, times and respondents cover the variation being discussed?
- Ethics and safety: were people, property and the environment protected?
No field enquiry is perfect. The aim is to make a defensible claim whose strength matches the evidence. A small, safe sample can show a local pattern; it should not be presented as a complete account of a whole city, coast or river basin.
Common misconceptions
- Primary data are automatically better. They may be poorly sampled or measured; secondary data may provide longer time series or a wider context.
- A large sample guarantees reliability. Method consistency and representation matter too.
- A hypothesis must be proved true or false. Evidence may support it strongly, weakly or not at all, and alternative explanations remain.
- A correlation proves cause. Other physical or human factors may influence both variables.
- An anomaly should be deleted. It may reveal a local process or method problem; investigate it first.
- A fieldwork day is enough to describe a whole year. It records conditions during a limited period.
- A conclusion is just a summary of results. It must answer the question and explain evidence through geography.
- A limitation is fixed. Specific improvements can reduce uncertainty in a future enquiry.
Self-check
- What makes a question geographically testable?
- How would you justify systematic rather than random sampling?
- How can you evaluate whether a conclusion is reliable?
- Why must both required enquiries include primary data?
- What makes at least one enquiry a human-physical interaction study?
- How would you improve an EQS with subjective scores?
- When is a median more appropriate than a mean?
- Why does repeated data collection improve some enquiries but not others?
- What should a fieldwork risk assessment change about the method?
- How do you write a conclusion that does not overgeneralise?
Revision points
For each enquiry, know the title, theory, site, methods, sample, results, conclusion and evaluation. Explain why methods and graphs fit the question. Use evidence and geographical processes together. Distinguish reliability, validity, accuracy and representativeness. Keep safety, ethics and environmental care part of the design from the start.
Place example
A physical enquiry might test how channel characteristics vary downstream; a human enquiry might measure land use or environmental quality across an urban transect. Actual school sites and investigation titles differ; pupils should know their own titles and methods.
Maps, data and evidence
Select graphs that match data type: line for continuous change, bar for categories, proportional symbols for quantities by place. Use units, sample size and location. Explain why a method fits and how timing, access and observer judgement affect results.
Common misconception
More data do not automatically mean better evidence. A correlation across sites does not prove one variable caused the other.
Self-check
- What makes a question geographically testable?
- How would you justify systematic rather than random sampling?
- How can you evaluate whether a conclusion is reliable?
Revision points
For each enquiry memorise title, aim, theory, site, methods, sample, presentation, results, conclusion, limitations and improvements. For unfamiliar fieldwork, infer carefully from the resources provided.
Curriculum alignment
- Curriculum coverage IDs:
aqa.3.3.2.fieldwork - Related practice packs:
gcse_geo_p3_geographical_applications_june_2022,gcse_geo_p3_geographical_applications_june_2023,gcse_geo_p3_geographical_applications_june_2024,gcse_geo_p3_geographical_applications_november_2020,gcse_geo_p3_geographical_applications_november_2021 - Shared concept tags:
fieldwork,geographical-enquiry,primary-data,evaluation
Sources
- Curriculum/specification: https://www.aqa.org.uk/subjects/geography/gcse/geography-8035/specification/subject-content/geographical-applications
- For case-study facts, use the source list and figures selected by your teacher; dates, totals and local conditions can change between datasets.