 FoxChild@Learn
10. Coastal landscapes in the UK — school option
Curriculum status: Optional school choice. Choose two of coasts, rivers and glaciated landscapes.
This guide follows AQA GCSE Geography 8035. Named examples below are suggested teaching examples where the specification allows a school choice; use your teacher’s selected case study and verify current figures before an assessment.
Required knowledge
- Distinguish constructive and destructive waves and explain mechanical/chemical weathering, sliding/slumping/rock falls, hydraulic action, abrasion, attrition, longshore drift and deposition.
- Explain headlands/bays, cliffs/wave-cut platforms, caves/arches/stacks, beaches/dunes/spits/bars through rock type, structure and process.
- Compare sea walls, rock armour, gabions, groynes, beach nourishment/reprofiling, dune regeneration and managed retreat using a named UK coastline and management scheme.
Key vocabulary
| Term | Meaning |
|---|---|
| swash/backwash | uprush and return flow of a wave |
| attrition | particles collide and become smaller/rounder |
| longshore drift | net alongshore sediment transport |
| groyne | barrier interrupting sediment movement |
| managed retreat | planned realignment of the coastline |
| fetch | uninterrupted distance over water across which wind transfers energy to waves |
| hydraulic action | erosion as wave pressure compresses air or water in cracks and forces them apart |
| abrasion | erosion when sediment carried by water scrapes or strikes a rock surface |
| mass movement | downslope movement of rock or sediment under gravity |
| sediment cell | a broad coastal system in which sediment is sourced, transferred, stored and lost |
| spit | a narrow ridge of deposited sediment attached to land at one end and projecting into water |
| bar | a ridge of sediment that extends across a bay or river mouth |
| terminal groyne effect | increased erosion or sediment shortage beyond the downdrift end of defended structures |
| coastal realignment | moving a defence line to allow a more natural shoreline or intertidal area to develop |
| shoreline management plan (SMP) | a long-term plan for managing erosion and flood risk along a defined coast |
How the geography works
Waves transfer energy to the coast. Destructive waves tend to remove beach material; constructive waves tend to deposit it. Mechanical/chemical weathering and mass movement weaken or move rock; hydraulic action, abrasion and attrition erode it. Longshore drift follows angled swash and perpendicular backwash. Continued erosion can extend a crack into a cave, arch and stack; differential erosion creates headlands and bays. Deposition can build beaches, dunes, spits and bars where energy and sediment conditions permit. Geology and structure influence the rate and shape of change.
Waves and coastal energy
Waves transfer energy across water. Most everyday coastal waves are generated when wind blows over the sea surface. Friction transfers energy from moving air to the water. Wave size is influenced by wind speed, duration and fetch: the uninterrupted distance over which the wind blows. Long fetch, strong wind and a longer period of wind can build larger waves. Local seabed shape, water depth, reefs and headlands also modify waves as they approach land.
In a deep-water wave, water particles move in approximately circular orbits and wave energy travels forward. As a wave enters shallower water, friction with the seabed slows its lower part. The wave becomes steeper and may break. Water moves up the beach as swash and returns downslope as backwash. The balance between these flows helps determine whether beach sediment is deposited or removed.
Constructive waves are commonly lower and longer-period waves. They tend to have stronger swash than backwash, carrying material up the beach and building a berm or wider beach. Destructive waves are commonly steeper and more frequent, with stronger backwash relative to swash; they tend to remove beach material and attack the lower beach or cliff toe. These are useful models, not labels for every individual wave. Storms, tides, beach shape, sediment size and preceding weather alter effects on a particular day.
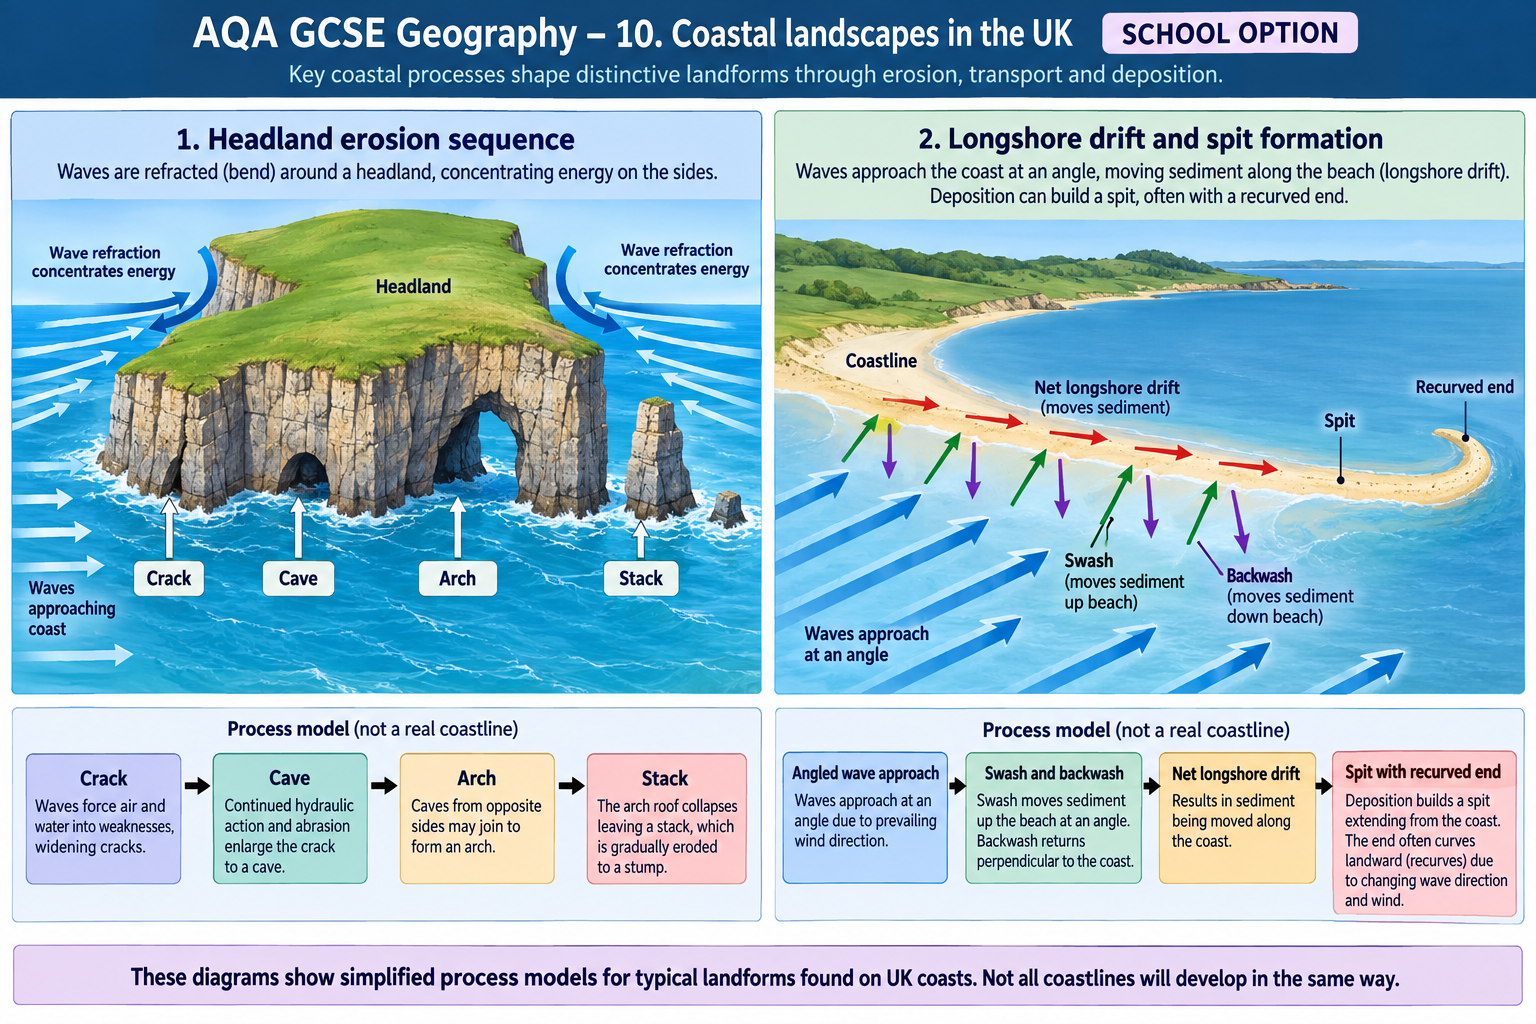
Wave energy is not uniform along a coast. Wave refraction bends waves as different parts enter shallow water at different speeds. Energy may become concentrated on exposed headlands and spread out in bays, helping explain why headlands often erode while beaches accumulate in more sheltered areas. The exact pattern depends on the direction of wave approach, shoreline orientation and underwater relief. A wave-arrow diagram should show the approach direction and the shape of the coast.
Tides are the regular rise and fall of sea level, mainly related to gravitational forces of the Moon and Sun. Tidal range affects the area exposed between high and low water and the elevation at which waves can act. Tides are not the same as waves: high tide can coincide with small waves, and low tide can coincide with storm waves. A storm surge is a temporary rise in sea level linked to atmospheric pressure and wind. It can increase flood risk if it coincides with high tide and large waves.
Weathering, mass movement and erosion
Weathering breaks rock in place
Weathering breaks down rock in situ, meaning in its original location. It weakens cliffs and supplies material that waves may remove later. Mechanical weathering changes the physical size or shape of rock without changing its chemical composition. Chemical weathering alters minerals through reactions with water, acids or oxygen. The importance of each process depends on rock type, climate, joints, vegetation and water availability.
- Freeze–thaw weathering: water enters a crack, freezes and expands, widening the crack. Repeated cycles can loosen blocks. It is most effective where water enters cracks and temperatures repeatedly pass through the freezing point; it does not explain every cliff collapse.
- Salt crystallisation: saline water enters pores or cracks. When water evaporates, growing crystals can exert pressure on the rock. This may be important on exposed coasts and in porous rock.
- Carbonation: slightly acidic rainwater reacts with calcium carbonate in limestone or chalk. Over time, the rock can dissolve along joints and bedding planes. Carbonation is chemical weathering, not hydraulic action.
- Biological weathering: roots can grow into cracks, and burrowing or organisms can disturb some material. The scale varies; roots may break rock in one setting and stabilise soil in another.
Weathering does not itself transport debris away from a cliff. A block may be loosened by weathering, moved by gravity and then removed by waves. Keep the sequence clear: weakening, movement and removal are separate processes.
Mass movement moves material downslope
Mass movement occurs when rock or sediment moves downslope under gravity. Rock fall happens when blocks detach from a steep cliff and fall, bounce or roll. It is more likely where joints or bedding planes create unstable blocks, especially after weathering or undercutting. Material may collect at the foot as scree until waves remove it.
A slide is a relatively coherent mass moving along a planar weakness, such as a bedding plane. A slump is rotational movement along a curved slip plane, often leaving a stepped or arcuate scar. Water can increase the weight of slope material and raise pore-water pressure, reducing friction between particles. Undercutting removes support at the slope base. Clay-rich cliffs can be susceptible when saturated, although geology and the structure of the slope matter.
On the Holderness coast, waves may undercut weak glacial till cliffs. Heavy rainfall can saturate material; rotational slumping moves part of the cliff downslope; the slipped sediment is broken up and transported by waves. If the beach is narrow, more wave energy can reach the cliff toe. This is a linked sequence of marine erosion, weathering, gravity and transport rather than a single-cause event.
Marine erosion processes
Waves erode the coast in several ways:
- Hydraulic action: water and compressed air force into cracks. Repeated pressure can widen weaknesses and detach material. Cavitation can also create pressure changes as bubbles collapse.
- Abrasion (corrasion): sand, pebbles and larger clasts carried by waves scrape or strike the cliff and shore platform. Effectiveness depends on wave energy, sediment load and rock resistance.
- Attrition: particles collide as they move. They may become smaller and rounder. Attrition does not explain every change in sediment because distance, sorting, breakage and abrasion also matter.
- Solution (corrosion): soluble minerals, particularly calcium carbonate, dissolve in seawater or weakly acidic water. This is most relevant to soluble rock.
Erosion can occur above the ordinary waterline during storms, while weathering and mass movement operate on the cliff face between tides. Cliff change is a combined system. Strong waves may remove debris; rain may saturate a slope; gravity may move material; waves can then transport it away. If debris builds a protective beach, wave attack may temporarily reduce. If the beach is removed, the cliff toe may again be exposed.
Longshore drift and coastal sediment systems
When prevailing waves approach a coast at an angle, swash carries sediment up the beach in that direction. Gravity draws backwash down the beach at roughly a right angle. Repeated movement transports sediment along the shore in a zigzag path. This is longshore drift. Its direction depends on prevailing wave approach and can vary where wind and waves change seasonally.
Longshore drift is one part of a wider sediment budget. A source supplies material, such as eroding cliffs or rivers; transfer moves it alongshore or offshore; stores include beaches, dunes, bars and nearshore banks; sinks include deep water, estuaries or places where sediment is trapped. If a new groyne interrupts transport, sediment can accumulate up-drift while less reaches areas farther along the drift direction. A sea wall may reflect wave energy and affect beach profiles. Beach nourishment adds sediment, but waves can redistribute it.
A sediment cell is a useful planning model for organising sources, stores and transfers. Real coastal systems do not always stop at a line drawn on a map: storms can move material across a boundary, offshore banks exchange sediment with beaches, and human activities change the budget. When evaluating a scheme, describe which sediment pathway it changes and where material may go next.
Coastal landforms and why they form
Geological structure and differential erosion
Rock type and structure influence the rate and style of coastal change. Hard, resistant rocks generally erode more slowly than weak or unconsolidated rocks, but jointing and bedding can create weaknesses in any rock. A coast made from alternating bands of resistant and less resistant rock may develop headlands and bays. If rock layers lie parallel to the shoreline, retreat may be more even; if they meet the coast at different angles, erosion can create an irregular outline.
Headlands and bays: softer rock is eroded faster, forming a bay, while harder rock remains projecting as a headland. Wave refraction can focus energy on the headland, increasing erosion there, while lower energy in the bay may allow a beach to accumulate. This is a result of geology and wave processes; it is not guaranteed wherever two rock types meet.
Cliffs and wave-cut platforms
Waves attack the cliff base, particularly around high tide. Hydraulic action and abrasion can cut a notch. The overhanging rock becomes unstable and may collapse through a fall or slump. Repeated undercutting and collapse make the cliff retreat. A gently sloping rocky surface exposed at low tide can remain in front of the cliff as a wave-cut platform. It develops as the cliff retreats and waves abrade the shore platform, although platforms vary with rock type, joint structure and tidal range. A platform is a bedrock surface, not a beach.
Caves, arches, stacks and stumps
Cracks, joints or faults in a headland provide weaknesses. Hydraulic action and abrasion enlarge a crack into a cave. If erosion cuts through a narrow headland, the opening becomes an arch. Weathering and mass movement weaken the roof; it eventually collapses, leaving an isolated stack. Continued erosion and weathering reduce the stack to a lower stump, often visible near low tide. This is a process model: not every cave becomes an arch, and change is uneven through time.
Coastal diagrams should show the headland and the crack or cave in the correct sequence. Do not draw waves moving the entire cliff inland as one block. Include weakening, undercutting and collapse. Old Harry Rocks on the Dorset coast are a well-known example of chalk stacks and arches; Holderness below illustrates a different mix of hard and soft coastline.
Beaches
A beach is an accumulation of loose sediment at the shore. It may contain sand, shingle or mixed material. Constructive waves, longshore drift and sediment from cliffs or rivers can supply material; destructive waves and offshore currents can remove it. Beach profile changes with season and storms. A wider beach can absorb wave energy and protect a cliff behind it, but this may be temporary if sediment moves offshore or alongshore.
Sand dunes
Sand can be blown landward from a dry beach. It accumulates around obstacles such as driftwood, marram grass or fencing. Marram tolerates burial and traps more sand with its stems and roots. Dunes can form a sequence from embryo dunes near the beach through foredunes to more mature dune ridges. Vegetation and soil may become more established inland. Trampling, storms, grazing and access can damage dunes, while fencing and boardwalks reduce pressure. A dune is a depositional landform shaped by wind and vegetation, not waves alone.
Spits and bars
A spit forms where longshore drift continues beyond a bend or interruption in the coastline. Sediment is deposited in a ridge extending from land, with one end attached. If wave direction or currents change, the far end may become recurved. Behind a spit, sheltered water can allow mud deposition and saltmarsh growth. If a spit grows across a bay and joins the opposite side, it may form a bar and enclose a lagoon. Tidal channels, storms, sea-level change and sediment supply can alter these features; a spit is not permanently fixed.
Depositional conditions
Sediment is deposited when the transporting water or wind loses enough energy to carry its load. This may happen when waves become constructive, enter a sheltered bay, meet a change in coastline orientation or when a current slows in an estuary. Larger particles often settle before finer ones, but turbulence, cohesion and density also matter. Mud can remain suspended and travel into a quiet estuary before settling; sand and shingle may build beaches in more energetic settings.
Deposition requires sediment supply as well as lower energy. A sheltered bay with little incoming sediment may not develop a wide beach. A longshore-drift pathway may deliver sediment to a point where the coastline changes direction and a spit begins to grow. Dunes need dry, wind-blown sand, a suitable beach and obstacles or vegetation to trap grains. In each case, explain both the source and the condition that permits deposition.
Erosion, transportation and deposition can occur along the same coast at different places and times. A storm may erode a beach and move sediment offshore; calmer waves may later return some material. A groyne may retain sediment on one side but increase its deficit beyond the structure. The coast is a changing sediment system.
Place example
Suggested coastline: Holderness, East Yorkshire
Holderness is on England’s North Sea coast. The Environment Agency’s current Shoreline Management Plan explorer describes roughly 60 km of cliffs from Sewerby to Easington, generally less than 3 m to around 40 m high, composed mainly of silts and clays. It reports erosion rates across the frontage ranging from about 1 to 4.5 m per year, showing why one local rate should not be used as though it applies everywhere (Environment Agency, Holderness Cliffs). The coast is a strong example of how geology, wave exposure, sediment transport and human decisions interact.
A more resistant boundary: Flamborough Head
Flamborough Head projects into the North Sea at the northern end of the study frontage. Its near-vertical chalk cliffs are about 30–50 m high in the current SMP description. Chalk is comparatively resistant beside the clay cliffs of Holderness, so the headland erodes more slowly and shelters parts of the coast to its south from common north-easterly waves. The Environment Agency notes small bays with sandy and rocky beaches, including South Landing and Danes Dyke (Environment Agency, Flamborough Head).
Joints in the chalk provide weaknesses that waves can enlarge into caves and arches. The Joint Nature Conservation Committee identifies Flamborough as supporting more than 200 sea caves, particularly around the headland and north-facing cliffs; their exposure, water depth and geology vary (JNCC, Flamborough Head SAC). This makes Flamborough useful for explaining how geological structure controls cave development and how one coast can contain both erosion landforms and protected habitats. Use a separate sourced example, such as Old Harry Rocks in Dorset, if your class specifically needs a named stack sequence.
At the northern end, Flamborough Head is a more resistant chalk headland. To its south, weaker glacial deposits and till form much of the eroding Holderness cliffs. The contrast in resistance helps create a broad headland-to-bay pattern: the harder chalk resists erosion more effectively while softer material retreats faster. The retreating cliffs supply sand, clay and other sediment to the coast. Material is moved by waves and longshore drift towards the Humber and Spurn area, although sediment paths include offshore movement and stores as well as alongshore transport.
The BGS records till cliffs at Aldbrough, around the middle of the Holderness frontage, being eroded by toppling and rotational landsliding. Its repeated terrestrial LiDAR surveys demonstrate how coastal change can be monitored over time, while also showing that weather, tide, access and survey positioning affect data quality (BGS, Aldbrough case study). A historical recession rate at one monitored cliff should not be copied as the rate for all Holderness.
Landforms along the coast include resistant cliffs and rocky shore platforms around the chalk headland, softer retreating till cliffs farther south, beaches and the long sand-and-shingle spit at Spurn Head. Spurn is a depositional form linked to sediment moving south and the changing shape of the Humber entrance. It is a dynamic landform: storms can breach or reshape it, and tidal channels can change. The coastline shows both erosion and deposition; it is not a single process acting in one direction everywhere.
Spurn Head: sediment at the Humber mouth
Spurn Head is a long, narrow spit projecting across the northern side of the Humber entrance. JNCC describes it as a shingle spit around 5 km long with blown sand over the top; nearby intertidal flats and mudflats are sheltered in its lee. Sediment eroded from the Holderness cliffs contributes to the coastal sediment system, and longshore drift transfers material southwards. Waves, tidal currents and storms then reshape the spit and its tip. The sediment budget is more complex than one arrow: offshore bars, the Humber estuary and changing shoreline geometry also matter.
The spit demonstrates how depositional landforms can shelter other environments. Lower wave energy behind it allows fine sediment to settle and saltmarsh or mudflat habitats to develop. At the same time, a breach can alter local access and expose sheltered areas. Spurn is not simply a final pile of beach material; it is a mobile part of the Humber estuary system with geomorphological and ecological value. The Humber Estuary and Spurn area also contain protected habitats, so engineering that affects sediment movement can have consequences beyond the immediate beach.
For a case-study map, label Flamborough Head, Bridlington, Hornsea, Mappleton, Withernsea, Easington, the Humber Estuary and Spurn Head. Mark the main eroding cliff frontage and indicate a general southward sediment-transfer pathway as a simplified model. Add the North Sea and an arrow for prevailing wave approach only after checking a suitable atlas or local coastal-process map. A hand-drawn case map should be schematic and should not invent precise cliff-retreat rates.
Why defend Mappleton?
Mappleton lies south of Hornsea, where the B1242 runs close to the retreating coast. The local council identifies Mappleton, nearby towns and important infrastructure among the defended parts of the East Riding shoreline; it also explains why the full 85 km cannot reasonably be defended, since sea walls and groynes are costly and can affect the landscape and environment (East Riding Council, defending the coastline). The road supports connections along the coast. Losing it could affect residents, visitors, emergency access and businesses as well as the village itself.
In 1991, a local scheme was built at Mappleton using rock armour and two rock groynes. The specific arrangement and approximate historical cost are documented in the East Riding coastline technical account produced with coastal researchers (The East Riding Coastline: Past, Present and Future). If using the cost in an exam, identify it as the reported construction cost at that time, not a current price or a full lifetime cost.
The groynes interrupt longshore drift and encourage sediment to accumulate on their up-drift side. A wider beach can absorb wave energy and reduce erosion at the cliff toe. Rock armour reflects or dissipates wave energy at the base of the frontage. The combined scheme aims to hold the line at a particular short section; it does not stop all erosion on the Holderness coast.
Benefits include protecting a settlement, the B1242 and associated access. Beach material can support recreation and local tourism, while the cliff may retreat more slowly immediately behind the defences. Regular inspection and maintenance can extend the useful life of structures. For a transport network with few parallel coastal routes, protection of a road can benefit people beyond the village.
Costs and limits include the expense of constructing and maintaining large rock structures, changes to the natural appearance of the coast and the fact that structures may need repair as conditions change. Groynes can reduce sediment movement down-drift. The Environment Agency’s Shoreline Management Plan describes a broader rationale for allowing erosion along much of the currently undefended coast: cliff erosion supplies sediment that helps protect areas farther south, including parts of East Yorkshire and Lincolnshire. This means a local scheme needs to be assessed in the context of sediment movement, not only its immediate frontage.
The term terminal groyne effect is often used for increased erosion downdrift of the last groyne in a defended frontage. It is a useful possible consequence, but the exact outcome depends on wave conditions, sediment supply and other structures. Do not write that a groyne inevitably “causes” a fixed number of metres of erosion beyond it. Local monitoring is needed to distinguish the effect of defences from natural variation and other causes.
Shoreline management and competing interests
An SMP takes a longer view than a single defence project. The East Riding Council explains that the Flamborough Head to Gibraltar Point Shoreline Management Plan assigns policies by coastal section, including hold the existing defence line, advance the existing defence line, managed realignment and no active intervention. A policy may depend on funding and approval and is reviewed as evidence, government policy and coastal conditions change. “No active intervention” means not investing in new defences on that frontage; it does not mean abandoning emergency response or refusing to plan for change.
Different groups experience the same policy differently. Residents and road users may value protection of homes, access and local business. Landowners may want to retain farmland up to the cliff edge. A local tourism operator may value beaches and a natural-looking coast. Down-drift communities may depend on sediment transported from eroding cliffs. Conservation bodies may value the dynamic shore, saltmarsh, lagoons or geological exposures. Public authorities must also consider cost, safety, legal duties and whether a scheme is sustainable across a wider frontage.
Allowing erosion can cause real losses: farmland and property may be lost and road routes may need adaptation. Defending everywhere could be technically or financially unsustainable and might reduce sediment supplied to beaches or estuary systems. An SMP therefore makes choices about where investment has the greatest benefit and where natural change should continue. These choices do not make individual losses unimportant; they make the distribution of costs visible.
Evaluation example: The Mappleton scheme can be judged successful in its local objective if the village and road have remained protected while defences are maintained. It is not evidence that the entire coast is safe, that the structures have no downdrift effects, or that the original cost captures all long-term maintenance. A defensible conclusion is that targeted protection can be justified for a strategic community and transport route, while the wider shoreline plan should monitor sediment effects and make clear where continued erosion is accepted. If a school uses a different named scheme, keep Mappleton as a comparison rather than substituting it for the required case study.
Managing coastal erosion and flooding
Coastal management aims to reduce risk to people, property, infrastructure or habitats; it cannot remove the physical processes that create the risk. A strategy may protect one frontage, change sediment transport, alter flood pathways or allow the coast to move. The most suitable approach depends on the value and vulnerability of the assets, geology, waves, sediment system, environmental designations, funding and community priorities. Compare options over the same time period and area.
Hard engineering
Hard engineering uses built structures to control or interrupt coastal processes. Structures can be effective locally, but have capital, maintenance and environmental costs. Some reflect wave energy or transfer erosion to an adjacent place; they may also need upgrading as sea levels and storm conditions change.
Sea walls are barriers built along the shore. A curved or recurved face can reflect or dissipate wave energy; a promenade may also support recreation. Sea walls can protect a high-value settlement from wave attack and overtopping if designed for expected conditions. They are expensive to build, require maintenance and may be visually intrusive. Reflected waves can scour the beach or foot of the wall, and an abrupt wall can interrupt natural sediment and habitat movement. A sea wall can fail or be overtopped if its design threshold is exceeded.
Rock armour (riprap) places large boulders at the cliff or shoreline base. Water can move through the gaps and energy is dissipated as waves break around the rocks. It is usually quicker to install than a continuous concrete sea wall and can protect a cliff toe or infrastructure. However, transporting and placing large rocks costs money; the rocks can alter beach access and landscape character, shift during storms or require replacement. Source and transport of material have their own environmental impacts.
Gabions are wire cages filled with rocks. They can absorb wave energy and are relatively flexible, and may be less costly initially than a large sea wall. Wire can corrode or be damaged, particularly in a high-energy setting; cages may need frequent maintenance and can become untidy or hazardous when they break. Gabions are not automatically an environmentally gentle solution because their lifespan and failure mode matter.
Groynes are barriers built roughly at right angles to the shoreline. They interrupt longshore drift and can build a wider beach on the up-drift side, increasing the amount of material that waves must cross before reaching a cliff or promenade. They can improve beaches used for recreation. But a beach may be narrower downdrift because less sediment passes the structure. Groynes therefore manage material; they do not create new sediment. They require a continuing source of sediment and can transfer erosion risk to another place.
Soft engineering
Soft engineering works with processes or changes materials rather than using a large fixed barrier. These measures can have lower visual impact and may support a more natural coast, but they still need design, space, monitoring and maintenance. They may be unsuitable where wave energy is high or where there is little sediment.
Beach nourishment adds sand or shingle to widen a beach. A larger beach can absorb more wave energy and provide recreation and habitat. Nourishment can be staged and can restore an eroded beach without a tall wall. The material must match the existing beach and be sourced responsibly. Waves and longshore drift can move it away, so repeat additions may be required. A one-off photograph of a nourished beach cannot show whether the scheme is sustainable; compare profiles and sediment budgets over time.
Beach reprofiling reshapes beach material, for example pushing shingle higher to form a ridge that reduces overtopping. It uses existing sediment and machinery rather than necessarily importing large quantities. A storm can flatten the profile again, and frequent re-profiling may be needed. It can disturb organisms or interfere with recreation during works. Reprofiling is more effective when enough suitable material is available.
Dune regeneration protects and restores dunes, which can act as a natural buffer and valuable habitat. Fencing or designated paths keep feet and vehicles away from fragile dune vegetation; planting marram can help trap wind-blown sand. Dune restoration takes time and space and cannot be relied on to stop every storm or flood. If visitors create paths through new planting or grazing removes vegetation, the dune may remain unstable. Community participation and clear access routes improve compliance.
Managed retreat or coastal realignment
Managed retreat sets a defence line farther inland or allows selected low-value land to flood, creating intertidal habitat such as saltmarsh. The new habitat can absorb some wave energy, store water and support biodiversity. Realignment can provide a more flexible response where maintaining a fixed line is becoming costly or unsustainable. It may also create space for future adaptation.
Realignment is not cost-free or conflict-free. Land, homes, farms, roads or familiar places may be lost, and relocation requires agreement, compensation, planning and time. A realigned defence needs suitable ground and enough space for the new intertidal zone. Sediment and habitat change may affect neighbouring areas. “Natural” change still has social consequences, so communities need early involvement and clear evidence about who will be affected.
Non-structural approaches
Shoreline management planning coordinates decisions along a coast by defining sections, objectives, policies and review timescales. The Environment Agency’s SMP Explorer presents current management approaches and notes that actions remain subject to funding and approval. Plans can help avoid defending every stretch equally and can make long-term consequences visible. However, a policy is not a guarantee that a project will be funded or completed, and the approach may change when new evidence, legislation or conditions emerge.
Planning and warning reduce exposure rather than stopping erosion. Coastal-change maps can inform where new buildings should not be placed, while warning and evacuation plans support people during flooding or cliff instability. Property-level measures can reduce damage, and relocation plans can address assets at long-term risk. These tools work only if information is accessible, warnings are understood and people have realistic options.
Monitoring underpins every strategy. Repeated beach profiles, cliff surveys, tide and wave records, photographs, LiDAR and satellite imagery can reveal where the shore is changing. BGS’s Aldbrough programme shows how LiDAR builds three-dimensional models, while noting limits caused by tide, weather, GNSS quality and inaccessible survey areas. Monitoring helps identify whether a scheme is working and whether its effects are being displaced down-drift.
Choose a strategy with evidence
Questions for comparing schemes
Use these questions when comparing hard engineering, soft engineering and realignment:
- Which risk is being addressed? Wave erosion, cliff instability, overtopping, tidal flooding or loss of access may need different responses.
- What is protected? Identify people, homes, road links, farmland, businesses, habitats or cultural places; do not assume all assets have equal value to every group.
- What happens to sediment? Does the scheme trap, add, remove or reflect material? Where might sediment accumulate next?
- How long is the benefit expected to last? Include construction, maintenance and replacement over time.
- Who pays and who benefits? Public investment may protect a strategic road while an adjacent stretch remains exposed.
- What could fail? Consider overtopping, structural damage, sediment deficit, maintenance gaps and changing climate conditions.
- What evidence will be monitored? Set measurable indicators such as beach width, cliff-line movement, overtopping frequency, habitat change or access disruption.
A simple option appraisal
| Criterion | Hard structure | Soft engineering | Managed realignment |
|---|---|---|---|
| Immediate local protection | Can be strong for a defined frontage | Often moderate and dependent on beach/dune condition | Limited at the old line; creates a new line inland |
| Sediment effects | May interrupt or reflect movement | Adds or reshapes sediment, often requiring replenishment | Allows some sediment and habitat processes to continue |
| Space required | Often narrow footprint, but may affect adjoining shore | Needs a suitable beach or dune system | Requires landward space and agreement |
| Cost pattern | High construction and ongoing maintenance | Repeated nourishment or restoration may be needed | Up-front planning, compensation and land transition costs |
| Typical trade-off | Protects concentrated assets; may transfer erosion | Lower visual impact but can be temporary | Can be more adaptable but creates local loss and conflict |
This is a framework, not a ranking that applies everywhere. A hard structure might have a lower lifetime cost than repeated nourishment at one highly valuable urban frontage; at another site, protecting a low-value stretch could be unjustified compared with realignment. Compare alternatives using the actual site evidence and stated objectives.
Mitigation hierarchy and residual risk
Management can be described through a simple hierarchy. First avoid development in the most exposed or environmentally sensitive location where possible. Then reduce the effect with design, maintenance or a smaller footprint. Restore habitats or sediment processes where feasible. Finally, make plans for residual risk that cannot be removed. This sequence helps avoid treating compensation or post-storm repairs as proof that the original impact was prevented.
Residual risk remains after a defence is built. A seawall can be overtopped; a groyne field can lose sediment; a maintained beach can be eroded in a storm; a realignment can affect access or habitat. It is useful to distinguish the hazard (the physical process), exposure (people and assets in the affected area) and vulnerability (how easily they are harmed and how able they are to recover). Coastal management may change any of these, but the sea continues to move sediment and energy.
Maps, data and evidence
Use a map to locate the case and a sequence diagram to explain landform formation. A sediment cell is a useful model, but real sediment budgets can cross simplified boundaries.
Use maps at the right scale
Begin with a national map to locate the coastline, then zoom in to the case-study stretch. On a Holderness map, orient the reader with Flamborough Head, Bridlington, Hornsea, Mappleton, Withernsea, Easington, the Humber Estuary and Spurn Head. Include a north arrow, scale, coastline, sea labels, settlements, main roads and a legend. If arrows show sediment transfer, label them “simplified net movement” and distinguish them from measured local currents.
An Ordnance Survey map can show cliffs, contours, paths, buildings, beach access and roads. Closely spaced contours near a cliff indicate steep ground; a path ending at the cliff may reveal an access issue, but the map alone does not establish when erosion happened. A geological map can show whether the coast is chalk, bedrock, till or superficial deposits. Aerial photographs can reveal beach width or defence structures, but tide level, season, recent storms and viewpoint may make two images difficult to compare.
To describe a coastline from an extract, state an overall pattern first, then use place names and compass directions. For example: “The defended frontage is at Mappleton; much of the coast to the south is undefended, and the shoreline continues towards the Humber mouth.” Do not write that a place is “up-drift” or “down-drift” until you have established the wave approach and sediment transport direction on the supplied evidence.
Read coastal data critically
A coastal-recession value is meaningful only with its measurement method, location and time interval. Surveyors may compare historical maps, fixed cliff-top markers, aerial photographs, satellite data, LiDAR or repeated beach profiles. These methods have different resolutions and errors. Aerial photos must be aligned to stable reference points; cliff-top movement may not equal the loss of land at the cliff base. An average can hide fast-change episodes and slow or stable sections.
The Environment Agency’s Shoreline Management Plan Explorer reports a range of erosion rates for the Holderness cliffs, rather than one uniform figure. That range reflects spatial variation along the coast. Use a value only if you can state the frontage and period. If a question gives a graph, use the graph’s own numbers instead of replacing them with a memorised headline figure.
When describing a beach profile, record the same transect position, direction, tide stage, equipment and vertical interval. A tape measure and clinometer can estimate distance and slope; ranging poles can help identify profile changes. Repeating transects shows variation along the coast. A wider beach after construction does not automatically prove that the beach was caused by the scheme: compare a baseline, a control section or longer-term measurements.
When describing sediment, use at least two measures—such as size, roundness, sorting or composition—and state where samples were collected. A single pebble sample cannot represent an entire beach. Samples near the groyne, at the waterline and farther up the shore may differ because waves sort sediment by size and energy.
Build a causal explanation from evidence
A strong coast answer connects an observation to a mechanism and a consequence. For example: “The cliffs are composed mainly of silts and clays; because these materials are relatively weak, wave erosion and rainfall-triggered slumping can remove material. The cliff supplies sediment to beaches and longshore drift. A defence that traps part of this sediment may widen the beach locally while reducing the supply farther along the coast.” This gives a chain rather than a list.
Then qualify the conclusion. The observed beach may also be affected by storm history, tide, offshore sediment, beach nourishment or recent maintenance. The evidence may show an association rather than a single cause. In physical geography, this caution improves an explanation; it does not prevent you from making a judgement where the evidence is strong.
Coastal fieldwork methods
A manageable enquiry might ask: How does beach width or sediment size vary with distance from a groyne? Define the beach width consistently (for example, from a mapped backshore feature to the waterline at a stated tide stage). Set transects at measured intervals on each side of the structure. Record a pebble sample with a random or systematic method and measure the long axis, roundness and sorting. Photograph each site from the same direction, and note tide, weather, wave conditions and access constraints.
The hypothesis should predict both pattern and mechanism: “Mean beach width will be greater on the up-drift side because the groyne interrupts some longshore sediment transport.” Before collecting data, establish the prevailing wave direction; otherwise “up-drift” has not been defined. Compare a similar un-defended section if possible, while acknowledging that geology and exposure may differ.
Keep a safe distance from cliff edges and unstable slopes. Check tide times and weather, use a risk assessment, work in pairs, obtain permission and avoid disturbing wildlife or protected features. Fieldwork close to groynes or breakwaters can be hazardous in waves. Use secondary data where direct measurements would create unacceptable risk.
For analysis, plot transect position against beach width and display individual values as well as a mean. A box plot or range can show variation. If data are strongly skewed by one storm deposit, the median may better represent a typical site than the mean. A correlation between distance from a groyne and beach width supports a relationship but does not prove the groyne alone caused it. Evaluate sample size, tide consistency, measurement error and the comparison site.
Image and diagram conventions
Process diagrams are models. A headland sequence should be drawn from plan view or with a clear perspective; show a joint becoming a cave, then an arch, stack and stump. A longshore-drift diagram should show oblique swash and more directly downslope backwash, with each step carrying sediment along the coast. Use separate arrows for waves, swash/backwash and sediment transport. A spit diagram should include its attached end, free end and sheltered water; only show a recurved tip when you explain changing wave or current direction.
Always label whether an illustration is a plan view, cross-section or schematic block diagram. Do not mix a diagrammatic landform with a precise map scale. Add a caption explaining the process and any important limitation. The queued visual for this book is intentionally a process model rather than an invented coastline map.
Common misconception
Hard engineering does not remove risk; it can transfer it or leave residual risk. A spit forms through deposition and changing coastline geometry, not because a river simply deposits at the coast. Weathering breaks rock down in place, mass movement moves it downslope, erosion removes material, transportation carries it and deposition lays it down. Longshore drift needs angled wave approach; tides affect water level but are not the same as waves. A wider beach may reduce wave attack for a time, but it can change with storms and sediment supply. A defence can protect one section and change another section’s sediment budget. Shoreline management plans guide choices but are not a promise that every defended scheme will be funded or permanent.
Self-check
Try answering without looking back. Use a process verb, named landform and a condition or qualification where relevant.
- What three factors affect wave size?
- How do constructive and destructive waves commonly differ in swash and backwash?
- What is the difference between weathering and erosion?
- Explain how freeze–thaw weathering can weaken a cliff.
- How can rainfall contribute to a rotational slump?
- Distinguish hydraulic action from abrasion.
- How does attrition change transported material?
- Describe longshore drift using swash and backwash.
- What is a source, store and sink in a sediment budget?
- Explain how alternating resistant and less-resistant rock can form headlands and bays.
- How does a wave-cut notch contribute to cliff retreat?
- Put cave, arch, stack and stump in sequence and explain the transition.
- Name two conditions required for dune formation.
- Explain how a spit forms and why its end might become recurved.
- Why can an estuary be a depositional environment?
- What is one advantage and one cost of a sea wall?
- How can a groyne change the beach on either side?
- Give one benefit and one limitation of beach nourishment.
- What is managed realignment, and why can it create conflict?
- Name two assets protected by the Mappleton scheme.
- Why is one erosion rate not representative of all Holderness?
- How might a groyne affect sediment further along the coast?
- What is a Shoreline Management Plan used for?
- Why should coastal-recession evidence include its location and date range?
- What does a beach-profile transect measure?
- Why should a pebble sample include a stated sampling method?
- What does a correlation between distance from a groyne and beach width fail to prove?
- Name one safety precaution for coastal fieldwork.
- What is the difference between a plan-view diagram and a cross-section?
- Give two groups who may evaluate a coastal-management policy differently.
Suggested answers
- Wind speed, duration and fetch, modified by local water depth and seabed shape.
- Constructive waves commonly have stronger swash than backwash and build beaches; destructive waves commonly have stronger backwash and remove sediment.
- Weathering breaks rock in place; erosion removes material through water, wind, ice or other agents.
- Water enters cracks, freezes and expands, widening weaknesses over repeated cycles until blocks can loosen.
- Rain saturates slope material, increasing weight and pore pressure and reducing friction along a curved slip plane.
- Hydraulic action uses water/air pressure in cracks; abrasion is sediment scraping or striking rock.
- Collisions can make particles smaller and rounder, though abrasion and other processes also affect shape.
- Angled swash carries material up the beach; backwash returns roughly at right angles under gravity; repeated movement shifts material alongshore.
- A source supplies sediment; a store holds it temporarily (such as a beach or dune); a sink receives sediment from the active transfer system.
- Weaker rock erodes faster into a bay, while more resistant rock remains as a headland; wave energy may then focus on the headland.
- Wave erosion undercuts the cliff, leaving an overhang that can collapse; repeated collapse moves the cliff line landward.
- Crack/cave → arch → collapse to stack → continued erosion to stump. Weaknesses are enlarged and the roof eventually fails.
- Dry wind-blown sand, a suitable beach and a trap such as vegetation, fencing or driftwood.
- Drift transports sediment past a bend or interruption and deposits a ridge attached at one end; changing wave/current direction can bend the free end.
- Currents can slow in sheltered estuarine water, allowing suspended sediment to settle, especially in intertidal flats and saltmarsh.
- A sea wall can protect valuable property but is costly and can reflect/scour waves or alter beach access and appearance.
- Sediment may accumulate up-drift, while less passes the groyne and the down-drift beach may narrow.
- It can widen a beach and absorb wave energy; waves may move added sediment away, requiring repeated work.
- Moving the defence line inland or allowing a selected area to flood, often creating intertidal habitat; landowners or residents may lose land or property.
- Mappleton village and the B1242 coastal road.
- Rates vary with cliff geology, beach width, exposure, defence, time period and measurement method.
- By interrupting longshore drift it may reduce supply to a downdrift frontage, though the outcome depends on sediment sources and waves.
- To set and coordinate long-term management approaches for coastal erosion and flood risk along sections of shoreline.
- The coastline varies spatially and rates change through time; data methods and reference periods matter.
- Beach elevation and slope over a measured line from the backshore towards the waterline.
- So another student can assess representativeness, bias and reliability and repeat the method.
- It does not prove the groyne alone caused the pattern; wave approach, beach geology, tide or other structures may also matter.
- Check tide and forecast, keep clear of cliffs/groynes, work in pairs, carry communication, and use a risk assessment.
- Plan view looks down from above; cross-section cuts through a landform from one side to the other.
- Residents, landowners, road users, tourism businesses, conservation groups, public agencies or neighbouring communities.
Exam practice and worked responses
Four marks: describe a coastal feature
Question: Describe the formation of a wave-cut platform. (4 marks)
Model answer: Waves erode a notch at the base of a cliff using processes such as hydraulic action and abrasion. The notch becomes deeper and an overhang is left above it. The overhang collapses through weathering and mass movement. Repeated undercutting and collapse make the cliff retreat, leaving a gently sloping rocky platform in front of it.
The answer describes a sequence in the correct order. It uses process words and explains how the platform becomes exposed. It does not say the waves “push the whole cliff back.”
Six marks: explain longshore drift
Question: Explain how longshore drift moves sediment along a coastline. (6 marks)
Model answer: Where the prevailing waves approach the beach at an angle, swash carries sand and pebbles up the shore in that direction. Backwash returns down the beach at roughly a right angle under gravity. Repetition creates a zigzag movement that transfers sediment along the coast. If a groyne interrupts the movement, material can build up on its up-drift side, while less may reach the next frontage. The direction depends on local prevailing wave approach and can vary with weather, so it should be identified from map or field evidence.
Six marks: explain spit formation
Question: Explain how a spit may form and change shape. (6 marks)
Model answer: Longshore drift moves sediment along the shore. Where the coastline changes direction or a river estuary interrupts it, the sediment can continue out into open water and be deposited as a narrow ridge attached to the mainland at one end. If wave or current direction changes, the free end may become recurved. The sheltered water behind the spit has lower energy, so fine sediment can settle and saltmarsh may develop. Storms, tides and sediment supply can reshape or breach the spit.
Nine marks: evaluate a coastal defence
Question: Assess the costs and benefits of a hard-engineering scheme on a rapidly eroding coastline. (9 marks)
Suggested structure:
- Position: State what the scheme protects and why that asset matters.
- Mechanism: Explain how the defence changes wave energy or sediment movement.
- Benefits: Use the named place. Identify homes, a road, tourism, infrastructure or safety benefits.
- Costs: Include construction, maintenance, landscape change, habitat impacts and possible down-drift effects.
- Scale and time: Compare the protected frontage with the wider sediment system and future maintenance period.
- Judgement: Decide whether the benefits justify the costs and conditions, and name what evidence or monitoring could change the decision.
Model conclusion: At Mappleton, targeted protection can be justified because the village and B1242 road are close to an eroding coast and the route serves wider coastal access. The rock armour and groynes reduce risk at a defined frontage and can help build a beach. However, they do not stabilise the entire Holderness coast, and trapping sediment may affect neighbouring areas. I would continue to support the scheme only with regular structural inspection, cliff and beach monitoring, transparent maintenance funding and a wider plan that protects sediment pathways and explains where erosion will continue. That is a conditional judgement rather than a claim that hard engineering is always best.
Eight marks: explain landform formation using evidence
Question: A photograph shows a cliff, beach and groyne. Explain how physical processes may have shaped the landforms. (8 marks)
Response plan: Identify visible features only: the cliff, beach and groyne. Explain that waves may undercut the cliff, weathering can weaken it, and mass movement can move material down slope. Waves can remove and transport the debris. Longshore drift may move beach sediment parallel to the coast; the groyne interrupts that movement and may retain material on one side. A wider beach may reduce wave energy reaching the cliff. Qualify the explanation: a single photograph cannot establish the longshore-drift direction, the age of the structures, or whether the beach is stable. Use the map and any measurements supplied.
Nine marks: compare management options
Question: “Soft engineering is the most sustainable way to manage the coast.” Evaluate this statement. (9 marks)
Model response: Soft engineering can work with coastal processes. Beach nourishment can widen a beach and absorb wave energy, while dune regeneration can strengthen a natural buffer and provide habitat. These options may have a lower visual impact than a sea wall. However, nourishment can be moved by storms and may need repeated replacement; dunes need space and careful control of access. At a high-value frontage such as Mappleton, the B1242 and village have been protected with rock structures, and a fixed defence may protect a strategic route more reliably in the short term. It is still costly and can alter sediment supply. Managed realignment may be more sustainable where a defence is difficult to maintain, but it can require land, compensation and relocation. Therefore, soft engineering is not automatically the most sustainable everywhere. I would compare lifetime cost, residual risk, sediment effects, habitat and who bears each loss. At low-value stretches with room for change, a soft or realignment approach may be preferable; near a strategic transport link, targeted hard protection may be justified if its wider impacts are monitored.
Why it works: It tests the statement with more than one option, uses a named place and provides conditions. “Sustainable” is defined through long-term cost, process compatibility, environmental effects and equity.
Command words and common marking priorities
- Describe: state what is visible or how a pattern varies. Add evidence from the map, image or graph.
- Explain: show how or why through connected causal steps.
- Compare: use paired statements—“whereas,” “both,” “more than”—and compare the same criterion.
- Assess: weigh evidence and state how important or effective something is.
- Evaluate: consider more than one view, test costs and benefits, and make a supported judgement.
Case-study questions reward accurate detail, not the largest number of memorised facts. A named place, a relevant statistic with location/date, a process mechanism, a stakeholder effect and a justified conclusion are more useful than a paragraph of unrelated figures.
Extended synthesis: connect landforms, sediment and management
Trace sediment from cliff to estuary
Holderness is useful because several coastal processes can be connected in one explanation. Begin at the eroding till cliffs. Weathering and rainfall can weaken the slope; waves undercut the base; slumping or toppling moves material down the cliff. Waves then break up and transport part of this material. Some sediment forms a temporary beach or nearshore bar; some is moved along the shore or offshore. Longshore drift contributes to transport towards the Humber entrance, where the coastline changes shape and a spit has developed. Behind Spurn, lower-energy water supports fine-sediment deposits.
At every step, material may be stored, reworked or removed. A pebble from a cliff does not necessarily travel directly to Spurn. It may be trapped at a beach, reduced by attrition, carried offshore or mixed with sediment from another source. Sediment budgets are models based on measured sources, movement and stores; gaps in the data create uncertainty. This is why a “cliff erosion supplies beach sediment” statement is useful but should not be stretched into “every defended cliff makes all southern beaches erode.”
The relationship creates a management trade-off. A defence may protect a settlement by reducing cliff erosion, but if it also reduces sediment released to the beach system, neighbouring areas might receive less supply. The scale and significance depend on the volume involved and other sources. A groyne can trap material up-drift and reduce transfer down-drift; a groyne on one frontage is therefore part of the next frontage’s sediment context. The Environment Agency SMP takes a strategic view by assigning different policies to different sections and recognising benefits of continued natural erosion on some undefended stretches. This is a systems explanation, not an argument that local protection is always wrong.
Coastal management as a decision about values
Coastal schemes embody decisions about which places, people and landscapes receive public investment. A high-value road may connect multiple settlements, while a farm frontage may contain less infrastructure but still support livelihoods and food production. A small area of habitat can be important if it is rare or protected. An appraisal should make those values explicit rather than assuming that buildings and roads automatically outweigh farmland, habitat or cultural landscapes.
Short-term and long-term effects may differ. A groyne field can quickly trap sediment, but it needs continued sediment supply and inspection. A sea wall may protect one place now yet require upgrades as sea levels rise. A realignment may cause an immediate loss of land but create a new intertidal habitat and reduce the cost of maintaining a fixed defence line over time. The relevant comparison is the whole life cycle: design, construction, maintenance, replacement, emergency repair and eventual decommissioning.
Distribution matters too. Who pays? Who receives protection? Who loses access or land? Where does sediment go? Who has a voice in setting the policy? Shoreline Management Plans provide a framework for these choices, but they cannot resolve every disagreement. Transparent criteria, public engagement, compensation arrangements, monitoring and review make decisions easier to understand and challenge.
Use a coastal case-study paragraph structure
For a five- or six-sentence case paragraph, use this order:
- Name and locate: identify the frontage and a named settlement or feature.
- Describe a physical condition: state geology, wave exposure, slope or sediment supply.
- Explain the process: connect the condition to erosion, transport or deposition.
- Add the human use or risk: identify a road, settlement, farmland, tourism or habitat.
- Give evidence: quote a sourced rate, date, length, strategy or data value with context.
- Qualify: state who benefits, where another cost may occur, or what the evidence does not show.
For example: “Mappleton lies on the Holderness coast where the B1242 is close to a retreating till cliff. East Riding’s coastal defence information identifies the frontage as defended, and the historical scheme used rock structures and groynes. The groynes retain sediment locally and the wider beach can reduce wave energy at the cliff toe. The village and road benefit, but sediment interruption could affect areas farther alongshore. The outcome should be monitored against local beach and cliff data.” This paragraph is more useful than memorising a bare cost or a slogan about terminal groyne effect.
More retrieval prompts
- What is wave refraction, and how can it change the energy on a headland?
- Explain why a wide beach can protect a cliff without permanently stopping erosion.
- What is a sediment sink? Give one coastal example.
- Why might two maps show different apparent cliff-retreat rates?
- How can a diagram show the difference between deposition on a beach and dune formation?
- Why should “prevailing wave direction” be established before naming up-drift and down-drift?
- Give one reason that saltmarsh may develop behind a spit.
- What could cause sediment to move offshore during a storm?
- Why might a council choose not to defend every kilometre of an eroding coast?
- Give one limitation of a Shoreline Management Plan policy map.
- What is a residual risk after a coastal defence has been built?
- How can LiDAR support monitoring of cliff change?
- What is one limitation of comparing two beach photographs?
- How could fieldwork test whether beach width changes across a groyne?
- Why does a positive correlation between wave exposure and cliff retreat not prove causation?
Suggested answers: 31. Waves bend as they slow in shallower water; energy can focus on exposed headlands. 32. It absorbs energy and moves the breaking zone seaward, but storms and sediment transport can remove material. 33. A place where sediment leaves the active transfer system, such as deep offshore water or a depositional estuary store. 34. Different time intervals, locations, measurement methods and local defences. 35. Use waves/longshore drift for beach material and wind plus vegetation/obstacles for dunes. 36. Because direction depends on local coastline orientation and the wave approach. 37. Water is more sheltered and fine sediment settles. 38. Strong backwash or currents can remove material from the beach profile and carry it into nearshore storage. 39. Defences are costly, can affect sediment and habitats, and may not be sustainable where the benefits are limited. 40. It is a strategic policy framework, not proof that all actions are funded or that local processes will remain unchanged. 41. Overtopping, failure, erosion beside it or damage beyond its design conditions. 42. Repeated laser scans build terrain models that can be compared, with attention to positioning and coverage errors. 43. Different tide, season, viewpoint, weather, scale or recent storm. 44. Measure repeated transects at consistent intervals on both sides and compare with a control frontage. 45. Geology, beach width, structures, tide and storm history may influence both variables.
Read a hypothetical beach-profile data set
The following figures are invented for method practice only. They are not Holderness measurements. Imagine that three beach-profile surveys were taken on the same date and at the same tide stage: up-drift of a groyne, immediately down-drift, and at a comparison beach farther away. The up-drift transect has the widest dry beach; the immediate down-drift transect is narrowest; the comparison beach lies between them. A responsible description reports that pattern and gives exact widths from the supplied table. An explanation can suggest that the groyne interrupts sediment transport, but should consider whether wave exposure, beach angle or another defence also differs.
Now imagine the second survey, after a storm, shows that all three beaches became narrower but the up-drift beach remains widest. The data support two observations: a common storm-related reduction and a persistent spatial difference. They do not prove the groyne is the only reason for the difference, and they do not establish a long-term trend from two dates. More transects, repeated surveys over seasons and a control frontage would improve confidence.
For a graph, put location or transect number on the horizontal axis and beach width on the vertical axis, with units. Plot both dates as separate series and use a legend. A line joining points helps the reader see variation along the transect; it does not mean that the beach is a smooth mathematical line between observations. Add a caption giving survey date, tide condition, scale and the fact that the data are illustrative.
A management-decision exercise
Imagine a second groyne is proposed just south of Mappleton. The decision group should ask whether it is needed to protect an asset, how much sediment it is likely to retain, whether an up-drift beach can be maintained, what the down-drift effect may be, and whether another option would meet the objective. The group should map property, road access, cliff condition, sediment movement, protected sites and existing structures. A short monitoring baseline should be collected before construction so later changes can be compared.
The case for a new groyne is stronger if a high-value route or settlement faces a clearly demonstrated risk and no lower-impact alternative achieves a comparable level of protection. It is weaker if the asset can be moved, if the structure would worsen risk elsewhere, if costs exceed realistic benefits or if the evidence is too uncertain. A decision could require a sediment bypass, nourishment, a staged trial or a review trigger. Conditions need a responsible body and funding; a promise to “monitor later” has little value if no one is accountable for acting on the results.
Quick self-test: process precision
- If waves break at the cliff toe, what process physically removes rock from cracks? Hydraulic action or abrasion, depending on the described mechanism.
- If a rock block falls to the shore platform, has it been transported by longshore drift? No. Gravity caused mass movement; waves may transport it later.
- If a beach becomes wider behind a groyne, has new sediment been created? No. Existing material may have been retained or redistributed.
- If a spit has a curved tip, what should you investigate? Whether wave direction, currents or wind patterns changed; do not label a recurved end without process evidence.
- If a wall protects a promenade, has the coastal hazard disappeared? No. Residual risk remains and erosion or scour may occur elsewhere.
- If a cliff retreats faster in one period, can climate change be identified as the sole cause? Not from that observation alone; storm conditions, geology, beach width and measurement method also matter.
- If sediment is deposited behind Spurn, what condition is likely? Sheltered water and lower energy allow finer sediment to settle.
- If two coasts have the same wave exposure but different erosion rates, what else should be compared? Rock resistance and structure, beach cover, cliff height/slope, rainfall and defences.
Revision points
This is one of three landscape options; schools study two. Explain process before naming landform, then evaluate management with place evidence and stakeholder effects.
| Revision chain | Recall the sequence | Check yourself |
|---|---|---|
| Cliff retreat | Weakness in rock → weathering/undercutting → instability → collapse or slump → wave removal → retreating cliff | Did I distinguish weathering, movement and erosion? |
| Spit growth | Sediment source → angled waves and longshore drift → deposition beyond a change in coast → spit extends → sheltered water → fine sediment/marsh may develop | Did I show the attached end and explain any recurved tip? |
| Management trade-off | Identify asset → choose intervention → explain process change → compare up-drift/down-drift and habitat effects → assess cost and residual risk | Did I say who benefits and who carries the cost? |
Before an exam, practise drawing the three chains from memory and then explain each arrow in a sentence. Add one map location for the Holderness example and one current source for the case evidence. If the question supplies a different coastline, apply the same process knowledge to its map and data instead of forcing a memorised Holderness paragraph into every answer.
On a final review, check that every named rate has a frontage, date range and method; every management claim has an identified beneficiary and trade-off; and each landform explanation contains the process that actually creates it. Update statistics from the current source if a teacher asks for a precise figure. Some coastal policies, funding decisions and monitoring records change, while the core process models remain useful. Keep physical explanation, place evidence and evaluation connected, but do not use an outdated forecast as if it were a present-day observation.
Curriculum alignment
- Curriculum coverage IDs:
aqa.3.1.3.coastal-landscapes - Related practice packs:
gcse_geo_p1_physical_environment_june_2022,gcse_geo_p1_physical_environment_june_2023,gcse_geo_p1_physical_environment_june_2024,gcse_geo_p1_physical_environment_november_2020,gcse_geo_p1_physical_environment_november_2021 - Shared concept tags:
coasts,coastal-processes,coastal-landforms,coastal-management
Sources
- Curriculum/specification: https://www.aqa.org.uk/subjects/geography/gcse/geography-8035/specification/subject-content/living-with-the-physical-environment
- Environment Agency, current Holderness Shoreline Management Plan overview
- Environment Agency, Flamborough Head shoreline overview
- East Riding of Yorkshire Council, coastal defences and shoreline policy
- British Geological Survey, Aldbrough cliff and LiDAR monitoring
- Joint Nature Conservation Committee, Flamborough Head caves and habitats
- Joint Nature Conservation Committee, eastern England coast and Spurn Head overview
- The East Riding Coastline: Past, Present and Future, University of Hull coastal research account
- For case-study facts, use the source list and figures selected by your teacher; dates, totals and local conditions can change between datasets.
Coastal revision checkpoint
Before you finish, make sure each explanation connects a process to a landform and then to place evidence. A wave-cut platform is not just “made by erosion”: explain how hydraulic action and abrasion attack a cliff foot, how undercutting creates a notch, why collapse moves the cliff line landwards, and how repeated retreat leaves a platform. A spit is not simply a beach sticking out: connect longshore drift, a change in coastline direction or estuary conditions, deposition, changing wind direction and possible recurved ends. For management, connect the selected technique to the local problem, identify who benefits and who may pay, then state its limits. These linked explanations are more useful in an unfamiliar photograph or map than memorised labels alone.